

Abstract
The size-dependent variations of plant height L and mass M with respect to basal stem diameter D are important to the analysis of a broad range of ecological and evolutionary phenomena. Prior examination of some of the world's largest trees suggests that the scaling relationships L α D2/3 and M α D8/3 hold true, ostensibly as functional adaptations for mechanical stability. This concept remains engrained in the literature in the form of null hypotheses (or predictive models), despite numerous examples showing that the 2/3 and 8/3 rules are violated by small and intermediate-sized plants. Here, we present a growth-hydraulic model that provides more accurate and biologically realistic predictions of L and M. This model also sheds light on why L, D, and M scale differently across species and habitats as a result of differences in absolute size.
Mechanical constraints are widely thought to dictate tree size-dependent relationships. This assumption comes largely from McMahon's seminal application of the Euler-Greenhill formula (1, 2) to estimate the maximum theoretical height that can be reached by exceptionally large tree specimens. This formula predicts that plant height (L) [and mass (dry weight) M] should scale as the 2/3 power (and as the 8/3 power) of basal stem diameter (D), provided that bulk tissue properties are comparatively uniform within and across stems differing in size. McMahon showed convincingly (1, 2) that these scaling rules confer elastic self similarity, which is functionally adaptive because it permits uniform and consistent deflections when branches bend under their own weight regardless of their size.
Because of these important conceptual contributions, the 2/3 and 8/3 scaling rules of McMahon have been used either to model tree biomass relationships or as null hypotheses with which to compare empirical trends (3-10). Additionally, because the Euler-Greenhill formula gives values for L that exceed those observed, the differences between observed and estimated L have been ascribed to safety factors against mechanical instability. This feature, which is intuitively satisfying, is another reason why this formula has gained popularity in the exploration of tree allometries.
In this paper, we show that the same proportional relationships predicted by the Euler-Greenhill formula (i.e., L α D2/3 and M α D8/3) emerge mathematically (and directly) from a consideration of plant growth and hydraulics and require no assumptions regarding mechanical stability. Perhaps more important, the model predicts size-dependent relationships for small and intermediate-sized plants that differ substantially from those observed for large tree-sized plants. Therefore, no single scaling rule holds true across the entire size range occupied by plants with self-supporting stems. The predictions emerging from this model are shown to agree statistically with data gathered from a broad taxonomic spectrum of vascular plants with self-supporting stems differing in height. And, in contrast to the Euler-Greenhill formula, the model yields values for L that agree closely with the values observed for these species. This agreement suggests to us that the safety factors calculated by using the Euler-Greenhill formula are artificial, because this approach assumes (rather than tests) that mechanical constraints define plant heights.
The Growth-Hydraulic Model
The derivation of this model begins with two observations. First, annual growth in dry mass per plant (GT) scales one to one (isometrically) with respect to standing-leaf biomass [leaf dry weight (ML)]. Second, GT remains proportional to the 3/4 power of total body mass MT across ecologically and phyletically diverse vascular plant species (11). Mathematically, these relationships are expressed by the formula
 |
[1] |
where k denotes an allometric constant (different subscripts indicate different numerical values). For vascular plant species, MT equals the sum of leaf, stem, and root masses [ML, stem dry weight (MS), and root dry weight (MR), respectively]. Therefore, Eq. 1 becomes
 |
[2] |
It follows from first principles that the amount of water absorbed by roots per unit time must be conserved as water is transported from roots through stems to leaves, where it is eventually lost. For this reason, ML must scale isometrically with respect to the hydraulically functional cross-sectional area of stems and roots. For most trees, this hydraulic area is proportional to that of sapwood, which scales isometrically, on average, with respect to trunk cross section (see ref. 12). For plants that lack secondary xylem (wood), the functional hydraulic area is proportional to the square of the stem diameter (13). Thus, across all vascular plants, ML = k2 D2. Accordingly, Eq. 2 becomes
 |
[3] |
Finally, prior work has shown that MR scales isometrically with respect to MS (i.e., MR = k3 MS), and that MS is proportional to the product of the stem cross-sectional area and length (i.e., MS = k D2L) (see ref. 14). Therefore, Eq. 3 can be recast as
 |
[4] |
from which it follows that
 |
[5] |
where k5 = (k0 k2/k1)4/3/[(1 + k3) k4] has units of length1/3 and k6 = k2/[(1 + k3) k4] has units of length. Combining Eq. 5 with the relationship MS = k4 D2 L gives the formula
 |
[6] |
These derivations show that the proportional relationships L α D2/3 and MS α D8/3 will hold true across species differing in size provided that k5 D2/3 > k6. However, across small values of D, Eqs. 5 and 6 also predict log-log nonlinear (convex) relationships for L (or MS) vs. D in a manner that depends on the numerical values of k5 and k6.
Our derivations do not predict the numerical values for these allometric constants. These must be obtained empirically (see Materials and Methods). However, numerical simulations show how the numerical values of k5, k6, and D affect the predicted values of L and MS. For example, when k5 = 35, the relationship between L and D is log-log nonlinear across small values of D, gradually changes to a log-log linear relationship, and converges on a line with a slope of 2/3 as D becomes very large (Fig. 1a). Because the values of D at which the log-log linear relationship is achieved depend on the numerical value of k6, our model predicts different scaling relationships depending on the range in the absolute size of D (and the numerical values of k5 and k6, which depend on the biomass partitioning patterns of different species). These features of the model help to explain why the scaling of plant height and stem biomass can and do vary across and within species (as a consequence of morphological, anatomical, or ecophysiological species-specific responses to different habitats).
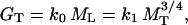
Fig. 1.

Predicted and observed scaling relationships for plant height L (m), basal stem diameter D (m), and total stem dry mass MS (kg). (a) Hypothetical relationships between L and D predicted by Eq. 5 for three different values of k6 when k5 = 35. With increasing numerical values of D, the slope of the log-log L vs. D relationship converges on 2/3; with decreasing values of D, the relationship becomes more log-log nonlinear and convex, as predicted by Eq. 5. (b) The scaling of L with respect to D across self-supporting herbaceous plants and trees. Predictions of the mechanical theory (using the Euler-Greenhill formula for stems with tapering modes α = 0 and α = 1, respectively) are indicated by dashed and solid straight lines, respectively. Prediction of the growth-hydraulic model shown by the solid curved line (using Eq. 5, k5 = 34.64, and k6 = 0.475). The model predicts a log-log linear relationship with a slope of 2/3 for large values of D. The scatter observed for data points is attributed to species- and site-specific differences in k5 and k6 (as a consequence of different growth rates and allocation patterns to stem, leaf, and root construction). (c) The scaling of MS with respect to D. Data from the Cannell compendium and other primary sources. Predictions of the mechanical theory are shown by dashed and solid straight lines (for stems with tapering modes α = 0 and α = 1, respectively). Prediction of the growth-hydraulic model is shown by the solid curved line (using Eq. 6), which has a slope of 8/3 for large values of D.
Our model can be tested in at least three ways. First, it predicts a log-log nonlinear relationship across species with small body sizes. Second, it predicts that tree species will ultimately converge on the 2/3 and 8/3 scaling rules as body size increases. Third, the model predicts biologically realistic values for L and MS, which differ substantially from those predicted by the Euler-Greenhill formula.
Materials and Methods
Data Set and Analyses. To determine the numerical values for the allometric constants in our derivations, we used the Cannell compendium for standing tree leaf, stem, and root dry weight and for leaf, stem, and root annual growth rates (14, 15) and supplemented these data with those collected for smaller or intermediate sized plants (see below).
The Cannell compendium reports average tree height (L in our notation); total community basal stem cross-sectional area; total community leaf, stem, and root dry weight; total community annual growth in leaf, stem, and root dry weight; and the number of plants per community on a hectare basis (plant density). Basal stem diameter for an average plant for each community was computed based on the quotient of total community stem cross-sectional area and plant density. Standing organ weights and growth rates were similarly computed by using plant density as the denominator for the relevant quotient.
Because the data from the Cannell compendium (15) come from large tree-sized plants, and because our model requires data for the allometric trends across a much broader spectrum of plant size to be tested, we supplemented the Cannell data with those collected from smaller species and juveniles of tree species (≤1 yr old). These data were gathered directly from the primary literature. In addition, to examine the predictions of the mechanical hypothesis advocated by McMahon (see below), we incorporated the data originally used by McMahon in his seminal study of tree biomechanics. These data come from the size record holders of tree species.
The allometric constant k4 in our derivations was determined by regressing standing MS against the product of average plant height and the square of average basal stem diameter. For tree species, MS includes the mass of the trunk and all branches, twigs, and bark; for nonwoody species or juveniles of woody species, MS is total stem mass, regardless of whether stem tissues are photosynthetic in part or whole. Model Type II regression analyses of the data were used, because our objective was to find the functional relationships for stem height, diameter, and mass.
The Euler-Greenhill Formula. We compared trends in our large data set against those predicted by the mechanical scenario treated by McMahon (1) and McMahon and Kronauer (2). Specifically, we used the Greenhill formula (16, 17), which is a generalization of the Euler formula (6), to calculate the critical buckling length Lcrit and the critical stem mass Mcrit for plants differing in D.
Lcrit is the height to which a plant can grow before its self-supporting stem buckles under its own weight; Mcrit is the mass of that stem. For columnar and conical stems (α = 0 and α = 1, respectively), Lcrit = 0.79 (E/γ)1/3 D2/3 and Lcrit = 1.24 (E/γ)1/3 D2/3, respectively, where E is Young's modulus (i.e., stiffness), and γ is the specific weight (i.e., density times the acceleration of gravity). For green (wet) wood, E = 6.8 GPa and γ = 9.4 kN/m3 are generally reported (18). Therefore, with tapering modes α = 0 and α = 1, the critical buckling lengths are given by the formulas Lcrit = 70.9 D2/3 and Lcrit = 111.4 D2/3, respectively. Likewise, for a tapering mode α = 0, Mcrit = (π/4) ρ D2 Lcrit = 55.7 ρ D8/3, and for a tapering mode of α = 1, Mcrit = (π/12) ρ D2 Lcrit = 29.16 ρ D8/3 (ρ, bulk tissue density; γ, tissue specific weight). Therefore, when ρ = 557 kg/m3 (see ref. 18), the Euler-Greenhill formula predicts Mcrit = 31,025 D8/3 and Mcrit = 16,242 D8/3, respectively.
Results and Discussion
Reduced major axis regression analyses of the Cannell data set showed that k0 = 2.05 ± 0.02 yr-1 (n = 391, r2 = 0.814, F = 9,559, P < 0.0001), k1 = 0.281 ± 0.02 kg1/4 yr-1 (n = 391, r2 = 0.899, F = 9,856, P < 0.00001), k2 = 136.8 ± 0.04 kg/m2 (n = 587, r2 = 0.789, F = 2,193, P < 0.0001), k3 = 0.423 ± 0.02 (dimensionless) (n = 338, r2 = 0.944, F = 5,676, P < 0.0001), and k4 = 202.3 ± 0.01 kg/m3 (n = 552, r2 = 0.939, F = 8,444, P < 0.00001). Therefore, k5 = 34.64 m1/3 and k6 = 0.475 m (see Eqs. 5 and 6). Based on these values, a log L vs. log D nonlinear (convex) relationship was obtained by using Eq. 5 for small values of D, whereas a log-log linear trend with a slope of 2/3 was predicted for large values of D. Additionally, Eq. 6 predicts a nonlinear (convex) log MS vs. log D relationship for small values of D and a log-log linear trend with a slope of 8/3 for large values of D.
These expectations agreed with the trends observed empirically for log-log plots of either L vs. D or MS vs. D (Fig. 1 b and c). In contrast, the mechanical model obtained using the Euler-Greenhill formula predicted invariant slopes (i.e., 2/3 and 8/3). It also overestimated plant height and stem biomass by one or more orders of magnitude, whereas our model provided, on average, far more accurate estimates of these important variables. In this regard, differences between observed and estimated plant heights using the Euler-Greenhill formula have often been used to calculate safety factors against mechanical failure under the conditions of self loading (e.g., ref. 19). Although this approach is legitimate from a mechanical perspective, the biological meaningfulness of the magnitudes of such safety factors remains problematic, because it is unclear whether the maximum theoretical heights to which plants can grow are defined phenomenologically by strictly mechanical or physiological factors. Certainly, the model presented here successfully predicts plant height (and standing stem biomass) without evoking any mechanical hypothesis.
Under any circumstances, our results are entirely consistent with many other previous reports and also in part with the seminal work of McMahon (1), who showed for the first time that a log-log line with a slope of 2/3 passes through the center of mass of the bivariate plot of L vs. D for exceptionally large (record-holder) trees. Although no statistical analyses were performed by McMahon (see ref. 6), other studies dealing with large trees report a 2/3 slope for the relationship between L and D. However, numerous studies dealing with small or intermediate-sized plants (e.g., refs. 5, 8, and 10) report a log-log nonlinear (convex) relationship for L vs. D, which is predicted by Eq. 5 (see refs. 6 and 9).
Our derivations do not explain why plant growth scales as the 3/4 power of body size, nor why leaf mass scales isometrically with respect to body growth (see Eq. 1). Numerous functional hypotheses have been advocated for this purpose (1, 20-22). Some are based on the surface areas to volumes of n-dimensional objects (20); others stress the importance of mass-transfer principles (21); and others assert that the 3/4 scaling of growth with respect to body mass emerges from a fractal-like inner dimension (22). Each of these hypotheses emphasizes (or at least resonates with) the biological requirement to conduct and distribute fluids, regardless of the body plan involved. The model presented here draws additional attention to this biological imperative, which has recently been highlighted by Koch et al. (23), albeit in different but highly related ways. Our model also shows that plant length, diameter, and mass scaling relationships are flexible, that is, they can and do vary across species due to species-specific differences in biomass partitioning patterns and ecological responses to different environmental conditions. In this sense, our model shows that the scaling relationships governing these variables are adaptive and functionally flexible, particularly when compared with the rigid (and excessive) expectations of a strictly mechanical hypothesis.
Author contributions: K.J.N. designed research; K.J.N. performed research; K.J.N. and H.-C.S. contributed new reagents/analytic tools; K.J.N. and H.-C.S. analyzed data; and K.J.N. wrote the paper.
This paper was submitted directly (Track II) to the PNAS office.
References
- 1.McMahon, T. A. (1973) Science 179, 1202-1204. [Google Scholar]
- 2.McMahon, T. A. & Kronauer, R. E. (1976) J. Theor. Biol. 59, 443-466. [DOI] [PubMed] [Google Scholar]
- 3.King, D. A. & Loucks, O. L. (1978) Radiat. Env. Biophys. 15, 141-165. [DOI] [PubMed] [Google Scholar]
- 4.Norberg, R. Å. (1988) Am. Nat. 131, 249-258. [Google Scholar]
- 5.O'Brien, S. T., Hubbell, S. P., Spiro, P., Condit, R. & Foster, R. B. (1995) Ecology 76, 1926-1939. [Google Scholar]
- 6.Niklas, K. J. (1994) Plant Allometry: The Scaling of Form and Process (Univ. of Chicago Press, Chicago).
- 7.Franco, M. & Kelly, C. K. (1998) Proc. Natl. Acad. Sci. USA 95, 7830-7835. [DOI] [PMC free article] [PubMed] [Google Scholar]
- 8.Holbrook, N. M. & Putz, F. E. (1989) Am. J. Bot. 76, 1740-1749. [Google Scholar]
- 9.Niklas, K. J. (1995) Ann. Bot. 75, 217-227. [Google Scholar]
- 10.Alves, L. F. & Santos, F. A. M. (2002) J. Trop. Ecol. 18, 245-260. [Google Scholar]
- 11.Niklas, K. J. & Enquist, B. J. (2001) Proc. Natl. Acad. Sci. USA 98, 2922-2927. [DOI] [PMC free article] [PubMed] [Google Scholar]
- 12.Bond-Lamberty, B., Wang, C. & Gower, S. T. (2002) Can. J. For. Res. 32, 1441-1450. [Google Scholar]
- 13.Kramer, P. J. (1983) Water Relations of Plants (Academic, Orlando, FL).
- 14.Enquist, B. J. & Niklas, K. J. (2002) Science 295, 1517-1520. [DOI] [PubMed] [Google Scholar]
- 15.Cannell, M. G. R. (1982) World Forest Biomass and Primary Production Data (Academic, London).
- 16.Greenhill, G. (1881) Proc. Cam. Philos. Soc. 4, 65-73. [Google Scholar]
- 17.Spatz, H.-C. (2000) in Proceedings of the 3rd Plant Biomechanics Conference, eds. Spatz, H.-C. & Speck, T. (Thieme, Stuttgart), pp. 30-37.
- 18.Wessolly, L. (1989) Materialkennwerte Grüner Hölzer (Stuttgarter Festigkeitskatalog, Stuttgart).
- 19.Niklas, K. J. (1992) Plant Biomechanics. An Engineering Approach to Plant Form and Function (Univ. of Chicago Press, Chicago).
- 20.Blum, J. J. (1977) J. Theor. Biol. 64, 599-601. [DOI] [PubMed] [Google Scholar]
- 21.Patterson, M. R. (1992) Science 255, 1421-1423. [DOI] [PubMed] [Google Scholar]
- 22.West, G. B., Brown, J. H. & Enquist, B. J. (1997) Science 276, 122-126. [DOI] [PubMed] [Google Scholar]
- 23.Koch, G. W., Sillett, S. C., Jennings, G. M. & Davis, S. D. (2004) Nature 428, 851-854. [DOI] [PubMed] [Google Scholar]