

Summary
Non‐transfusion‐dependent thalassaemias (NTDT) encompass a spectrum of anaemias rarely requiring blood transfusions. Increased iron absorption, driven by hepcidin suppression secondary to erythron expansion, initially causes intrahepatic iron overload. We examined iron metabolism biomarkers in 166 NTDT patients with β thalassaemia intermedia (n = 95), haemoglobin (Hb) E/β thalassaemia (n = 49) and Hb H syndromes (n = 22). Liver iron concentration (LIC), serum ferritin (SF), transferrin saturation (TfSat) and non‐transferrin‐bound iron (NTBI) were elevated and correlated across diagnostic subgroups. NTBI correlated with soluble transferrin receptor (sTfR), labile plasma iron (LPI) and nucleated red blood cells (NRBCs), with elevations generally confined to previously transfused patients. Splenectomised patients had higher NTBI, TfSat, NRBCs and SF relative to LIC, than non‐splenectomised patients. LPI elevations were confined to patients with saturated transferrin. Erythron expansion biomarkers (sTfR, growth differentiation factor‐15, NRBCs) correlated with each other and with iron overload biomarkers, particularly in Hb H patients. Plasma hepcidin was similar across subgroups, increased with >20 prior transfusions, and correlated inversely with TfSat, NTBI, LPI and NRBCs. Hepcidin/SF ratios were low, consistent with hepcidin suppression relative to iron overload. Increased NTBI and, by implication, risk of extra‐hepatic iron distribution are more likely in previously transfused, splenectomised and iron‐overloaded NTDT patients with TfSat >70%.
Keywords: non‐transfusion‐dependent thalassaemia, iron overload, ineffective erythropoiesis, anaemia
Non‐transfusion‐dependent thalassaemias (NTDT) comprise a heterogeneous group of anaemias characterised by impaired production of β‐globin and/or α‐globin chains, for which ineffective erythropoiesis is the underlying mechanism for anaemia (Vichinsky, 2007; Fucharoen & Viprakasit, 2009; Galanello & Origa, 2010; Harteveld & Higgs, 2010). Three main diagnostic subgroups have been identified: β thalassaemia intermedia (β TI), haemoglobin (Hb) E/β thalassaemia and Hb H syndromes (Weatherall, 2012). Management strategies are highly diverse, and may include close observation, sporadic transfusion, splenectomy and Hb F‐inducing agents (Taher et al, 2011; Fucharoen & Weatherall, 2012; Musallam et al, 2012; Vichinsky, 2013).
Patients with NTDT, as well as other iron‐loading anaemias, become iron overloaded mainly because of increased iron absorption (Pippard et al, 1979; Pootrakul et al, 1988), which averages 0·011 mg/kg/day in the absence of transfusion therapy (Taher et al, 2012); sporadic transfusions also directly contribute to further iron accumulation. However, the parameters accounting for variability in iron absorption across the range of NTDT diagnostic subgroups are not well described (Table SI). In principle, iron accumulation could be increased in line with the degree of anaemia and/or by erythroid expansion, both driving down synthesis of the iron regulatory protein hepcidin and hence increasing dietary iron absorption. Bone‐marrow‐derived factors associated with ineffective erythropoiesis have been implicated in inhibiting hepcidin synthesis, including growth differentiation factor 15 (GDF‐15) in humans (Tanno et al, 2007; Tanno & Miller, 2010) and, more recently, erythroferrone in mice (Kautz et al, 2014). In addition, GDF‐11 has recently been identified as a key factor associated with ineffective erythropoiesis in a mouse model of thalassaemia (Dussiot et al, 2014). The same mechanism will also increase the release of recycled iron from the reticuloendothelial system, thus depleting macrophage iron. This typically explains the preferential periportal and hepatocyte iron loading with increased liver iron concentration (LIC) (Origa et al, 2007; Taher et al, 2009a, 2011; Gardenghi et al, 2010; Tanno & Miller, 2010). Chronic anaemia and hypoxia also induce expression of hypoxia‐inducible transcription factors (Tanno & Miller, 2010) and stimulate erythropoietin (EPO) synthesis, thus inducing erythropoiesis and erythron expansion, which further augments iron absorption.
The THALASSA (Assessment of Exjade in Non‐Transfusion‐Dependent Thalassaemia) trial was a prospective, randomised, double‐blind, placebo‐controlled, Phase II clinical trial of deferasirox, which enrolled 166 patients with the three primary diagnostic groups of NTDT and considerable iron burden (Taher et al, 2012). The current analyses of baseline data from the large THALASSA database (prior to treatment with deferasirox) examined how erythropoietic and iron metabolism markers inter‐relate within NTDT diagnostic subgroups. With the associations between ineffective erythropoiesis, chronic anaemia and gastrointestinal iron absorption that lead to iron loading in patients with NTDT, we hypothesised that LIC would be associated with biomarkers of iron turnover, anaemia and erythroid expansion, particularly in untransfused and unchelated patient subgroups. Baseline markers of iron storage (serum ferritin and LIC) and iron turnover (transferrin saturation [TfSat], non‐transferrin‐bound iron [NTBI] and labile plasma iron [LPI]) were examined, as well as markers of erythroid expansion (soluble transferrin receptor [sTfR], GDF‐15 and nucleated red blood cells [NRBCs]). Markers of anaemia (Hb and EPO) were compared between the NTDT subgroups and related to the iron metabolism markers. Plasma hepcidin was measured in all subgroups at baseline and related to markers of iron storage, iron turnover, erythroid expansion, anaemia and hypoxia. The effects of previous management strategies (splenectomy and prior transfusion therapy) on these markers were also examined.
Methods
Study design
THALASSA was a multinational, prospective, randomised, double‐blind, placebo‐controlled, Phase II study (ClinicalTrials.gov number NCT00873041) for which the study design and inclusion/exclusion criteria have been described previously (Taher et al, 2012). Briefly, male or female patients aged ≥10 years with NTDT, iron overload (LIC ≥5 mg Fe/g dry weight [dw] by R2 magnetic resonance imaging [MRI]) and serum ferritin >300 μg/l who received no transfusions within 6 months or chelation therapy within 1 month before study entry were included. Patients with previous exposure to deferasirox were excluded, although patients may have received deferoxamine (DFO), deferiprone or a combination of the two. Additional exclusion criteria included Hb S variants of thalassaemia syndromes, active hepatitis B or hepatitis C, cirrhosis, alanine aminotransferase levels >5 × the upper limit of normal (ULN), serum creatinine >ULN or creatinine clearance ≤60 ml/min on two consecutive measurements, or significant proteinuria (urine protein/urine creatinine ratio >1·0 mg/mg) on two consecutive measurements. Patients (or parents/guardians) provided written, informed consent prior to enrolment. No patients received any transfusions within 6 months or chelation therapy within 1 month prior to enrolment. The study was conducted in accordance with Good Clinical Practice guidelines and the Declaration of Helsinki and was approved by the local ethics committees of the study sites.
Assessments
The THALASSA trial included an initial screening period of 4 weeks, composed of two visits at least 14 days apart. During screening, LIC was measured at one visit using a validated R2 MRI technique (FerriScan®, Resonance Health, Claremont, Australia) and adopted as the baseline measurement (St Pierre et al, 2005). Serum ferritin levels were measured at both screening visits, and baseline levels were calculated from the mean of the two measurements (with a minimum time lag of 14 days between the two assessments). NRBCs and plasma Hb levels were also measured at both screening visits. TfSat, sTfR, NTBI, LPI, EPO, hepcidin and GDF‐15 were measured at baseline (pre‐dose). TfSat was directly measured using the urea gel method and NTBI was detected using high‐performance liquid chromatography at University College London, London, UK, as described elsewhere (Lal et al, 2013; Porter et al, 2014). The LPI assay (FeROS™ LPI, Aferrix Ltd., Tel Aviv, Israel) was performed using methods described previously (Esposito et al, 2003). Plasma hepcidin was determined at King's College London, London, UK (Bansal et al, 2009). All remaining blood chemistry samples were analysed at a central laboratory.
Statistical methods
Demographic and other baseline data (including disease characteristics) are summarised descriptively. All analyses were performed for all patients and by diagnostic subgroup: β TI, Hb E/β thalassaemia and Hb H syndromes. Correlations were assessed by Pearson's correlation coefficients and scatter plots, with simple linear regression models; GDF‐15 and EPO were analysed as log values for these analyses. Nominal P‐values are provided and were considered significant when <0·05.
Results
Baseline demographics and patient characteristics
In total, 166 patients were enrolled (Table 1). Most patients had β TI (n = 95, 57·2%) or Hb E/β thalassaemia (n = 49, 29·5%), while the remaining 13·3% (n = 22) had predominantly Hb H syndromes (Hb H disease [n = 8], Hb H‐CS [n = 6], genotype not determined [n = 6], HbH‐CS and heterozygous HbE [CSEA] Bart's [n = 1] or Hb Agrino [n = 1]). Age was similar across all groups. Splenectomy, previous transfusions and prior chelation therapy were least frequent in patients with Hb H syndromes and most likely in β TI patients (Table 1). Splenectomy was less frequent in patients with Hb E/β thalassaemia than in patients with β TI. Previous chelation therapy was most frequent in patients with β TI (40%) and least frequent in patients with Hb H syndromes (5%). The proportion of patients who received sporadic or more frequent transfusions and the median number of transfusions were similar across diagnostic subgroups.
Table 1.
Baseline demographics and patient characteristics by underlying disease
| Characteristic | All patients (n = 166) | β TI (n = 95) | Hb E/β thalassaemia (n = 49) | Hb H syndromes (n = 22) |
|---|---|---|---|---|
| Age at screening, years | ||||
| Mean ± SD | 32·1 ± 12·0 | 33·0 ± 11·7 | 27·7 ± 11·1 | 37·7 ± 12·4 |
| Median (range) | 31·5 (10–69) | 33·0 (11–69) | 27·0 (10–52) | 35·5 (18–60) |
| Splenectomy, n (%) | 88 (53·0) | 67 (70·5) | 18 (36·7) | 3 (13·6) |
| Transfused previously (sporadic), n (%) | 145 (87·3) | 80 (84·2) | 47 (95·9) | 18 (81·8) |
| Median (range) number of previous transfusionsa | 8 (1–75) | 10 (1–75) | 6 (1–47) | 6 (1–43) |
| Patients with 1–<10, n (%) | 76 (45·8) | 38 (40·0) | 29 (59·2) | 9 (40·9) |
| Patients with ≥10,b n (%) | 65 (39·2) | 39 (41·1) | 18 (36·7) | 8 (36·4) |
| Previous chelation therapy,c n (%) | 44 (26·5) | 37 (38·9) | 6 (12·2) | 1 (4·5) |
β TI, β thalassaemia intermedia; Hb, haemoglobin; SD, standard deviation.
The proportion of patients who received sporadic or more frequent transfusions was similar across diagnostic subgroups.
Patients did not receive any transfusion in the 6 months prior to study entry and data were missing in four patients.
Data were missing in four patients.
Patients did not receive any chelation therapy within 1 month prior to study entry and patients with previous exposure to deferasirox were excluded.
Anaemia and erythropoietic biomarkers
Baseline levels
All patient subgroups were anaemic with elevated EPO levels (Table 2). However, Hb levels were notably higher and EPO levels lower in patients with Hb H syndromes compared with other diagnostic subgroups, while Hb levels were lowest in patients with Hb E/β thalassaemia. Markers associated with ineffective erythropoiesis (sTfR, GDF‐15 and NRBC) were also lowest in patients with Hb H syndromes (Table 2).
Table 2.
Baseline anaemia, erythroid expansion, iron storage and iron turnover biomarkers in all patients and by diagnostic subgroup
| Parameter, median (range) | All patients (n = 166) | β TI (n = 95) | Hb E/β thalassaemia (n = 49) | Hb H syndromes (n = 22) | Laboratory normal ranges |
|---|---|---|---|---|---|
| Hb, g/l | 81·0 (47·0–140·0) | 84·0 (47·0–140·0) | 72·0 (50·0–93·0) | 91·0 (55·0–106·0) | 113–175 |
| EPO, u/l | 101·0 (18·3–3405·0) | 108·0 (18·3–3405·0) | 115·0 (19·1–649·0) | 57·0 (26·1–403·0) | 3·7–31·5 |
| NRBC,/100 WBC | 45·3 (0·0–827·5) | 128·5 (0·0–827·5) | 18·0 (0·0–631·0) | 1·00 (0·0–17·0) | 0 |
| sTfR, mg/l | 28·7 (8·3–64·3) | 27·9 (8·3–56·5) | 30·5 (17·4–51·3) | 24·9 (11·6–64·3) | 1·9–5·0 |
| GDF‐15, ng/l | 9144 (689–53 730) | 10,864 (1075–53 730) | 9114 (1748–31 667) | 2081 (689–6515) | 337–1060 |
| Serum ferritin, μg/l | 992 (304–6419) | 956 (304–3176) | 1050 (393–6419) | 1084 (330–3365) | 15–400 |
| LIC, mg Fe/g dw | 12·1 (2·6–49·1) | 11·7 (2·6–49·1) | 14·7 (5·0–42·1) | 11·3 (6·2–34·6) | <1·8[Link] |
| TfSat, % | 88·0 (24·0–100·0) | 88·5 (24·0–100·0) | 88·0 (32·0–97·0) | 77·0 (42·1–98·3) | 20–55 |
| NTBI, μmol/l* | 2·2 (–3·2–8·5) | 1·8 (–3·2–8·5) | 2·6 (–1·7–5·5) | 1·8 (–2·7–7·5) | 0·3–1·5 |
| LPI, LPI units | 0·0 (0·0–2·9) | 0·0 (0·0–2·9) | 0·0 (0·0–1·7) | 0·0 (0·0–2·4) | 0–0·4 |
| Hepcidin, nmol/l | 4·4 (0·1–51·0) | 3·8 (0·1–51·0) | 5·6 (0·8–38·7) | 5·0 (1·2–15·7) | 2·0–7·5 |
| Hepcidin/serum ferritin ratio·1000 | 5·0 (0·0–50·0) | 4·0 (0·0–40·0) | 6·0 (0·0–50·0) | 5·0 (0·0–50·0) | 23·2[Link] |
β TI, β thalassaemia intermedia; dw, dry weight; EPO, erythropoietin; GDF‐15, growth differentiation factor 15; Hb, haemoglobin; LIC, liver iron concentration; LPI, labile plasma iron; NRBC, nucleated red blood cell; NTBI, non‐transferrin‐bound iron; sTfR, soluble transferrin receptor; TfSat, transferrin saturation; WBC, white blood cells.
All patient subgroups were anaemic, with elevated iron metabolism parameters above the normal ranges, although LPI was generally not detected Note: Baseline is defined as the average of all values measured before or on the day of the first dose of study medication.
Relationships between anaemia, erythropoiesis and iron metabolism
There was a negative correlation between Hb and EPO in the overall population as expected (r = −0·35; P < 0·0001; Table SII). The EPO‐to‐Hb relationship was stronger in patients with Hb H syndromes (r = −0·76; P < 0·0001) than in patients with Hb E/β thalassaemia (r = −0·42; P = 0·0028) and β TI (r = −0·32; P = 0·0022). Across all patients, sTfR was negatively related to Hb levels (r = −0·46; P < 0·0001; Fig 1A) and positively correlated with EPO (r = 0·47; P < 0·0001; Fig 1B). This was also evident by diagnostic subgroup (Tables SIII, SIV and SV). A negative relationship was present between Hb and NRBCs (r = −0·46, P = 0·0016) and between Hb and sTfR (r = −0·42, P = 0·0024) in patients with Hb E/β thalassaemia (Table SIV), consistent with more severe anaemias driving increased erythropoiesis; no relationship between Hb and GDF‐15 was apparent.
Figure 1.
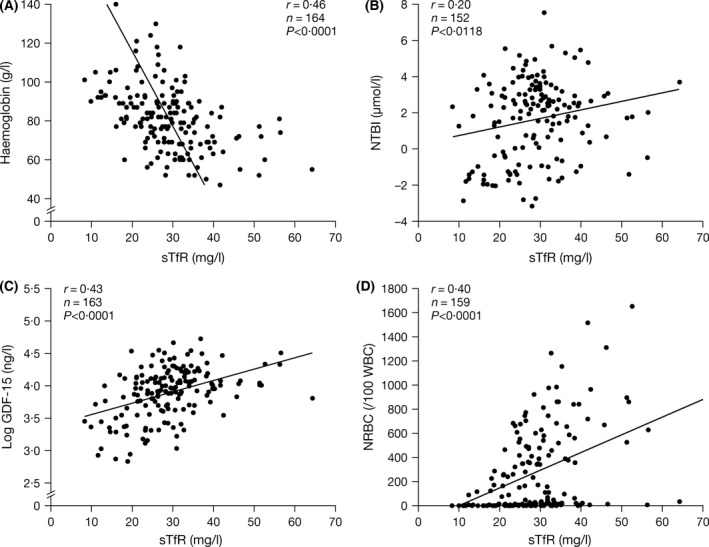
Correlations between sTfR and (A) Hb (B) NTBI (C) GDF‐15 and (D) NRBCs. Evaluable biomarkers of erythroid expansion generally correlated with each other. The strong negative correlation of Hb levels with sTfR supports the concept that sTfR levels reflect erythroid mass, which increases with greater anaemia. GDF‐15, growth differentiation factor‐15; Hb, haemoglobin; NRBC, nucleated red blood cells; NTBI, non‐transferin‐bound iron; sTfR, soluble transferrin receptor.
Iron overload and iron metabolism biomarkers
Baseline levels
Across all diagnostic subgroups, markers of iron storage (LIC and serum ferritin) were raised but similar. Iron turnover biomarkers (TfSat and NTBI) were elevated above normal ranges with lower TfSat and NTBI in patients with Hb H syndromes (Table 2). Overall, median TfSat was 88% (range 24·0% to 100·0%); 34/158 (21·5%) patients with TfSat measured at baseline had 100% TfSat, which contrasts with transfusion‐dependent (TDT) patients, in whom TfSat is typically 100%. LPI was generally not detectable across all subgroups, but reached levels above normal (>0·4 units) in 22 patients overall (β TI, n = 16; Hb E/β thalassaemia, n = 5; Hb H syndromes, n = 1). Hepcidin levels were generally within the normal range, although slightly lower in β TI patients than in the other two patient subgroups (Table 2). The hepcidin/serum ferritin ratio was similar for all diagnostic subgroups (Table 2) and notably less than that described elsewhere in TDT and sickle‐cell disease (SCD) patients, using similar methodology for plasma hepcidin measurement (Porter et al, 2014). This is consistent with hepcidin suppression relative to iron overload in NTDT patients across all subgroups. Hepcidin levels were highest in patients with a history of >20 blood transfusions, despite serum ferritin and LIC being no higher in this group.
Relationships between iron storage, iron turnover and hepcidin
Strong correlations were seen between LIC and serum ferritin overall (r = 0·64; P < 0·0001) and in all diagnostic subgroups (Tables SIII, SIV and SV), with similar slopes (data not shown). TfSat correlated with NTBI (r = 0·84; P < 0·0001), LIC (r = 0·37; P < 0·0001), serum ferritin (r = 0·35; P < 0·0001) and LPI (r = 0·30; P = 0·0002; Fig 2). The relationship between TfSat and NTBI was continuous (Fig 2C), whereas the relationship between TfSat and LPI appeared binary or possibly hyperbolic, with LPI absent (except in four cases) when TfSat was <98% (Fig 2D). This may explain the apparent absence of LPI across diagnostic subgroups, as TfSat was typically <100% (Table 2). NTBI also correlated with LIC (r = 0·35; P < 0·0001; Fig 3A) and serum ferritin (r = 0·39; P < 0·0001; Fig 3B). The relationships between iron storage and iron turnover parameters were generally stronger in patients with Hb E/β thalassaemia and Hb H syndromes than in β TI patients (Tables SIII, SIV and SV). Moderate‐to‐strong correlations between hepcidin and both TfSat and NTBI were identified (r = −0·33; P < 0·0001 and r = −0·24; P = 0·0029, respectively; Fig 4A and 4B). There was no correlation between hepcidin and markers of iron storage (Table SII). This was consistent across underlying diseases (Tables SIII, SIV and SV).
Figure 2.
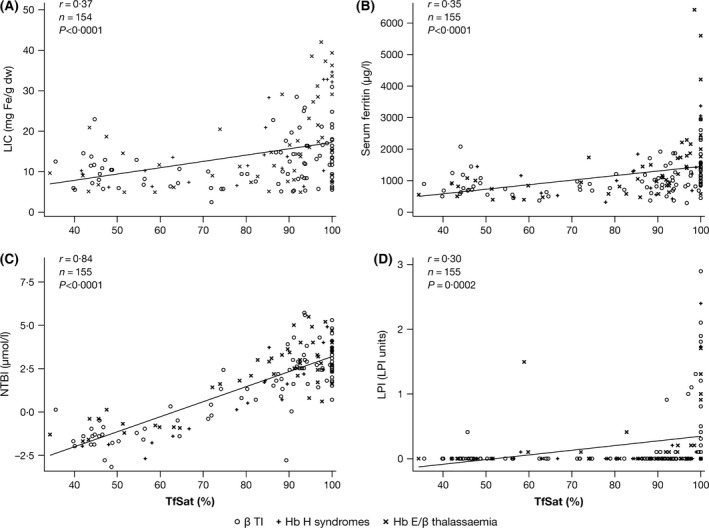
Correlations between TfSat and markers of iron storage: (A) LIC and (B) serum ferritin; and markers of iron turnover: (C) NTBI and (D) LPI. The relationship between TfSat and NTBI was continuous, whereas the relationship between TfSat and LPI appeared binary. β TI, β thalassaemia intermedia; dw, dry weight; Hb, haemoglobin; LIC, liver iron concentration; LPI, labile plasma iron; NTBI, non‐transferrin‐bound iron; TfSat, transferrin saturation.
Figure 3.
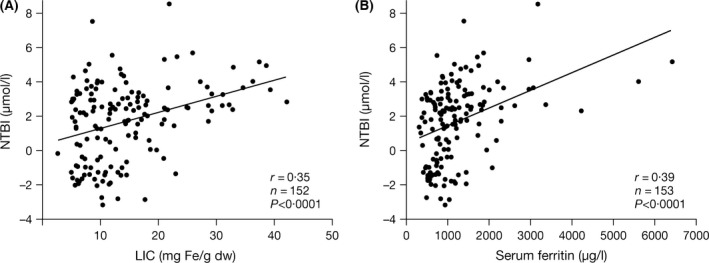
Correlations between NTBI and markers of iron storage: (A) LIC and (B) serum ferritin. Strong correlations were noted between NTBI as a marker of iron turnover and LIC and serum ferritin, markers of iron storage. dw, dry weight; LIC, liver iron concentration; NTBI, non‐transferrin‐bound iron.
Figure 4.
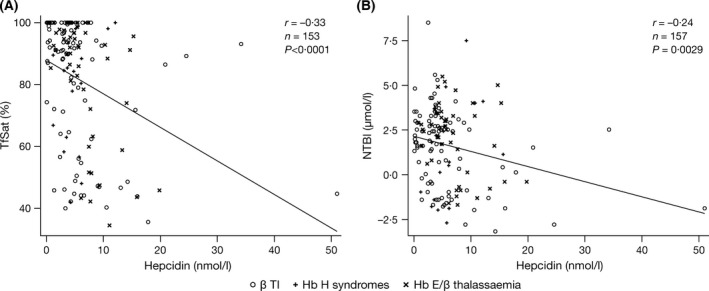
Correlations between hepcidin and markers of iron turnover: (A) TfSat and (B) NTBI. Hepcidin correlated with markers of iron turnover, but not markers of iron storage. β TI, β thalassaemia intermedia; dw, dry weight; NTBI, non‐transferrin‐bound iron; TfSat, transferrin saturation.
Relationships between erythroid expansion, iron metabolism and hepcidin
Evaluable biomarkers of erythroid expansion generally correlated with each other. Overall, there were strong, positive associations between sTfR and GDF‐15 (Fig 1C) and between sTfR and NRBCs (Fig 1D). Moderate, yet significant, correlations between markers of erythron expansion (sTfR, NRBC and GDF‐15) and iron turnover were also identified (Table SII): NTBI and sTfR (r = 0·20; P = 0·013); NTBI and NRBC (r = 0·23; P = 0·0041); TfSat and GDF‐15 (r = 0·17; P = 0·0402); and TfSat and NRBC (r = 0·26; P = 0·0014). These correlations were generally stronger in patients with Hb E/β thalassaemia or Hb H syndromes (Tables SIV and SV). Markers of erythron expansion (sTfR, NRBC and GDF‐15) were not correlated with those of iron storage in patients as a whole, although relationships were identified in patients with Hb H syndromes: between LIC and sTfR (r = 0·44; P = 0·04) and between LIC and GDF‐15 (r = 0·47; P = 0·027). This may be because most of these patients had not received prior chelation therapy, unlike the other diagnostic subgroups. Hepcidin generally did not correlate with markers of erythroid expansion (GDF‐15 or sTfR; Table SII) except in patients with Hb E/β thalassaemia, where a significant inverse correlation between hepcidin and GDF‐15 was seen (r = −0·3; P = 0·0084). A significant inverse relationship between hepcidin and NRBCs was also identified overall (r = −0·21; P = 0·0081), as well as in patients with Hb E/β thalassaemia (Table SII).
Effects of previous management: transfusion and splenectomy
Prior blood transfusion
The majority of patients received sporadic transfusions prior to enrolment (Table 1), with a median of eight lifetime transfusion episodes, although the number was highly variable (range 1–75; Table 1). A higher proportion of patients with Hb H syndromes received no prior transfusions (22·7% Hb H syndromes vs 18·7% β TI and 4·1% Hb E/β thalassaemia patients). Nearly all Hb E/β thalassaemia patients had previously received transfusion therapy, possibly because patients were more anaemic (median Hb levels 72·0 g/l). Patients with prior transfusions generally had lower Hb levels and higher NRBCs and EPO, indicative of a greater degree of ineffective erythropoiesis, as well as increased iron storage and iron turnover biomarkers (Table 3). LIC and serum ferritin levels were not related to the number of previous transfusions, presumably because of previous chelation therapy. TfSat and sTfR levels progressively increased in patients who received more transfusions. Hepcidin levels were also notably increased in patients who had received >20 previous transfusions. NTBI was generally absent in patients in the absence of prior transfusions (the majority were β TI patients; Table 1), in contrast to transfused patients.
Table 3.
Iron and haematological parameters in all patients by number of previous transfusions
| Parameter, median (range) | Number of previous transfusions | |||
|---|---|---|---|---|
| 0 (n = 21) | 1–<10 (n = 76) | 10–20 (n = 46) | >20 (n = 19) | |
| Serum ferritin, μg/l | 622 (304–1473) | 1054 (374–6419) | 1085 (370–3065) | 988 (342–3365) |
| LIC, mg Fe/g dw | 7·4 (5·8–28·6) | 13·5 (5·0–42·1) | 13·0 (2·6–49·1) | 10·7 (5·1–32·2) |
| TfSat, % | 72·0 (26·0–92·0) | 88·0 (32·0–100·0) | 89·5 (29·0–98·3) | 80·5 (24·0–95·0) |
| NTBI, μmol/la | –0·03 (–2·8–4·0) | 2·39 (–3·2–8·5) | 2·4 (–2·0–7·5) | 1·6 (–1·7–5·0) |
| LPI, LPI units | 0·0 (0·0–0·4) | 0·0 (0·0–1·9) | 0·0 (0·0–2·9) | 0·0 (0·0–0·8) |
| Hepcidin, nmol/l | 4·2 (0·1‒10·3) | 4·3 (0·3‒51·0) | 4·2 (0·1‒20·9) | 6·9 (0·5‒47·0) |
| Hb, g/l | 95·0 (69·0–140·0) | 78·0 (52·0–124·0) | 80·0 (47·0–118·0) | 76·0 (50·0–100·0) |
| EPO, u/l | 69·0 (31·2–843·0) | 101·0 (18·3–3405·0) | 101·0 (35·5–1957·0) | 142·0 (28·4–644·0) |
| NRBC,/100 WBC | 3·5 (0·0–361·0) | 27·5 (0·0–631·0) | 207·0 (0·0–827·5) | 11·0 (0·0–420·5) |
| sTfR, mg/l | 24·6 (9·9–41·7) | 27·4 (8·3–64·3) | 29·4 (18·0–56·5) | 31·7 (22·4–42·1) |
| GDF‐15, ng/l | 9179 (689–20 234) | 8599 (748–53 730) | 10,053 (890–46 511) | 9114 (1089–30 778) |
dw, dry weight; EPO, erythropoietin; GDF‐15, growth differentiation factor 15; Hb, haemoglobin; LIC, liver iron concentration; LPI, labile plasma iron; NRBC, nucleated red blood cell; NTBI, non‐transferrin‐bound iron; sTfR, soluble transferrin receptor; TfSat, transferrin saturation; WBC, white blood cells.
TfSat and sTfR levels were progressively increased in patients who received more transfusions and hepcidin levels were notably increased in patients who received >20 previous transfusions. Note: Data were missing in four patients.
Negative values can be interpreted as NTBI being absent from the sample.
Prior splenectomy
Overall, 53% (n = 88) of patients were splenectomised (Table 1). In splenectomised versus non‐splenectomised patients, median (range) serum ferritin levels and LIC were slightly elevated [1116 μg/l (370–6419) vs 834 μg/l (304–3365) and 12·9 mg Fe/g dw (2·6–39·3) vs 11·6 mg Fe/g dw (5·0–49·1), respectively]. The relationship between LIC and serum ferritin differed in splenectomised patients (r = 0·764; P < 0·0001 [n = 88]) versus non‐splenectomised patients (r = 0·552; P < 0·0001 [n = 77]), as the serum ferritin increment was greater in relation to LIC in splenectomised patients (Fig 5). No differences were noted between LIC and other markers of iron metabolism, TfSat and NTBI (data not shown). However, both NTBI and TfSat were notably higher in splenectomised versus non‐splenectomised patients [2·5 μmol/l (−1·9–8·5) vs 0·6 μmol/l (−3·2–7·5) and 91·0% (43·0–100·0) vs 78·0% (24·0–98·3), respectively; Fig 6A, B). Splenectomised patients also had higher median (range) GDF‐15 levels and NRBCs than non‐splenectomised patients (Fig 6C, D): 10 300 ng/l (1075–53 730) versus 7903 ng/l (689–46 511) and 235·0/100 white blood cells (WBC) (3·5–827·5) vs 4·0/100 WBC (0·0–56·0), respectively. Levels of EPO and Hb were similar: 101·0 u/l (18·3–3405·0) vs 101·0 u/l (19·1–1957·0) and 81·0 g/l (47·0–118·0) vs 81·0 g/l (55·0–140·0), respectively.
Figure 5.
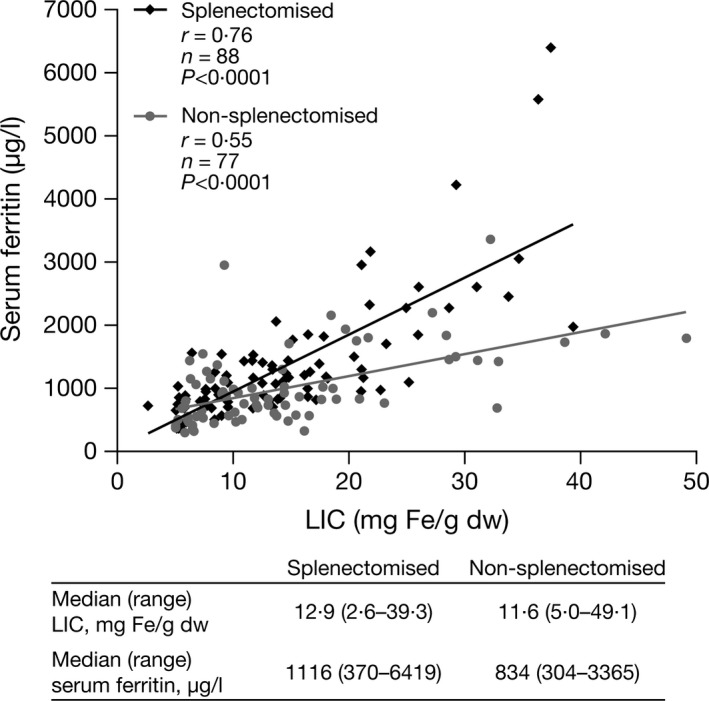
Correlation between serum ferritin and LIC in splenectomised and non‐splenectomised patients. The relationship between LIC and serum ferritin differed in splenectomised patients, as the serum ferritin increment was greater in relation to LIC. dw, dry weight; LIC, liver iron concentration.
Figure 6.
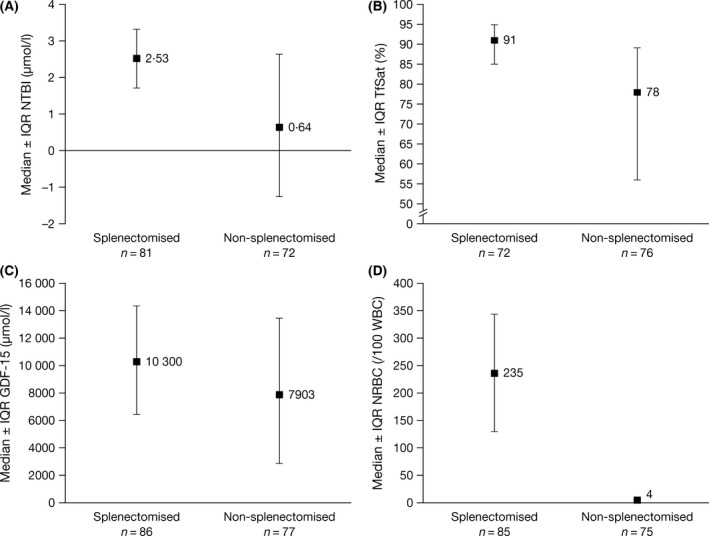
Median ± IQR baseline levels of (A) NTBI, (B) TfSat, (C) GDF‐15 and (D) NRBCs in splenectomised and non‐splenectomised patients. Splenectomised patients generally had higher levels of NTBI, TfSat, GDF‐15 and NRBCs. GDF‐15, growth differentiation factor 15; IQR, interquartile range; NRBC, nucleated red blood cell; NTBI, non‐transferrin‐bound iron; TfSat, transferrin saturation.
Discussion
To our knowledge, this is the first study to compare a range of biomarkers of iron metabolism and erythropoiesis, including plasma hepcidin, across a range of diagnostic NTDT subgroups. Our findings provide insight into the heterogeneity and similarities across NTDT syndromes, as well as the pathophysiological processes associated with the expanded erythroid and disordered iron metabolism. Patients enrolled in the THALASSA study were not currently receiving regular transfusions or chelation within the past month, but were sufficiently iron overloaded, as defined by LIC and serum ferritin levels, to potentially benefit from iron chelation therapy (Taher et al, 2012). Even without a history of transfusions, iron overload occurred across the spectrum of NTDT subgroups.
Anaemia and hypoxia
Increased markers of anaemia, hypoxia, ineffective erythropoiesis and erythroid expansion (sTfR, GDF‐15 and NRBC) were seen across all NTDT subgroups. These markers were distinctly lower in patients with Hb H syndromes and higher in those with β TI. Hb E/β thalassaemia patients were, on average, more anaemic than those with β TI, but EPO levels were similar to β TI patients (Table 2). This is consistent with the right‐shifted oxygen dissociation curve and typically lower Hb F levels in patients with Hb E/β thalassaemia than with β TI (Rees et al, 1999). The negative correlation between Hb levels and EPO across all patient groups supports the known EPO response to anaemia and hypoxia (Premawardhena et al, 2005; O'Donnell et al, 2007; Taher et al, 2011). The weaker relationship between EPO and Hb in patients with β TI may also be due to increased variability in the presence of Hb F (Galanello et al, 1994), which was not measured in this study. The strong negative correlation of Hb levels with sTfR (Fig 1A) supports the concept that sTfR levels reflect erythroid mass, which increases with greater anaemia. Indeed, sTfR levels have been linked with the incidence of extramedullary erythropoiesis in β TI patients (Ricchi et al, 2012). It is notable that patients with the most previous transfusion episodes (>20) had the lowest Hb values and the highest EPO and sTfR levels, indicative of a group of patients with the greatest demand on the erythron when not regularly transfused.
TfSat, NTBI and LPI
Across NTDT subgroups, raised TfSat and NTBI were associated with increased blood transfusion history, splenectomy, increased sTfR, increased NRBCs and lower plasma hepcidin. The strong correlation between TfSat and NTBI, observed for all NTDT subgroups, is consistent with the relationship previously identified in haemochromatosis and thalassaemia major (Loreal et al, 2000; Walter et al, 2008). In this study, NTBI was predominantly evident in patients when TfSat exceeded approximately 80%. TfSat is a relatively simple and inexpensive marker and we would recommend its use when NTBI is not routinely available. Prior use of transfusions appeared to be a key factor in the generation of NTBI and TfSat. NTBI was absent in patients without previous transfusions despite median LIC values >7 mg Fe/g dw (Table 3). This observation suggests that increased macrophage iron may be a key factor in the generation of NTBI because patients overloaded from gastrointestinal iron absorption alone have predominantly periportal hepatocellular iron, whereas transfusion therapy initially loads iron to the macrophage compartment (Origa et al, 2007). Rapid egress of iron is the key route to transferrin binding and, potentially, NTBI generation (Porter et al, 2014). By contrast, LPI levels showed no obvious relationship to blood transfusion. LPI was not detected in the majority of patients (i.e. levels below the ULN of 0·4 units), whereas other markers of iron storage and iron turnover were elevated. Raised LPI levels were mainly confined to those patients with 100% TfSat [n = 34 (21·5%); Fig 2D], which explains why, on average, LPI was generally not raised. These findings suggest that LPI is unlikely to be a useful marker of small changes in iron overload in NTDT patients. The binary or hyperbolic relationship of LPI to TfSat (Fig 2D) also contrasts with the continuum seen between NTBI and TfSat (Fig 2C), suggesting that NTBI and LPI identify different iron species in NTDT. As NTDT patients are typically at lower risk of extra‐hepatic iron damage than TDT patients, where LPI is usually raised, this may be consistent with the notion that LPI is a fraction of NTBI that is more likely to distribute extra‐hepatically (Cabantchik et al, 2005).
Relevance of splenectomy
Higher NTBI values in splenectomised than in non‐splenectomised patients have been previously reported for patients with β TI (Taher et al, 2009b). This could represent a more severe subset of patients who required splenectomy. Further studies of NTBI (and LPI) in patients pre‐ and post‐splenectomy would address this issue. Another explanation, however, is that splenectomy diverts erythrophagocytosis away from the spleen, where any NTBI generated would have been cleared efficiently as a first pass by hepatocytes (Brissot et al, 1985). When erythrophagocytosis is diverted to the marrow, NTBI clearance by the liver will occur only after systemic circulation and, hence, with higher NTBI levels and greater extra‐hepatic iron uptake.
Erythrocytic expansion and iron overload
The relationship between markers of iron overload and those of erythron expansion is of mechanistic interest as bone‐marrow‐derived factors, such as erythroferrone (Kautz et al, 2014), are thought to increase iron absorption through suppression of hepcidin. Unfortunately, many patients with β TI and Hb E/β thalassaemia had received previous transfusion and chelation therapy, thus obscuring such relationships. Only in patients with Hb H syndromes, where transfusion and chelation therapy are rarely used, could relationships between erythron expansion and iron overload be reliably explored. Patients with Hb H syndromes received less chelation (only one patient) and had lower splenectomy rates than other NTDT patient subgroups, even though serum ferritin levels and LIC were increased to a similar degree. Therefore, the correlations between markers of iron overload and erythroid expansion in patients with Hb H syndromes are of particular interest and support a relationship between ineffective erythropoiesis and increased iron absorption across NTDT subgroups. These findings should also be considered in the light of newly discovered markers of ineffective erythropoiesis [e.g. GDF‐11 (Dussiot et al, 2014) and erythroferrone (Kautz et al, 2014)], which were reported after the completion of the THALASSA trial (Taher et al, 2012). Analyses of these biomarkers may provide a more complete interpretation of the relationships between erythrocytic expansion and iron overload in patients with NTDT.
Plasma hepcidin
Hepcidin is a key molecule in the regulation of iron metabolism. Generally, plasma levels are thought to be increased by iron overload and decreased by erythron expansion. Our findings support a general relationship between hepcidin and Hb. Hepcidin levels were not elevated above normal reference ranges across all NTDT subgroups, despite the presence of iron overload. This is consistent with inhibitory effects from expanded bone marrow (Tanno et al, 2007; Kautz et al, 2014) outweighing the stimulatory effects of iron overload. It is of interest that hepcidin levels were least suppressed in patients receiving >20 previous transfusion episodes (Table 3). Another way of examining these competing effects is with the hepcidin/serum ferritin ratio (Pasricha et al, 2013). Recently, this ratio (hepcidin *1000/serum ferritin) was found to be higher in controls (ratio = 23·2) than in patients with thalassaemia major or SCD (Porter et al, 2014). In the NTDT patients from the THALASSA trial, the average ratio was approximately 4·4 across all NTDT subgroups (4·0 in β TI; 6·0 in Hb E/β thalassaemia; 5·0 in Hb H syndromes). This ratio is consistent with moderate generalised hepcidin suppression when corrected for iron overload, presumably as a consequence of erythroid expansion. In this cross‐sectional analysis, we also showed that plasma hepcidin in patients with NTDT was more closely related to markers of iron turnover (TfSat and NTBI) than to iron storage (serum ferritin and LIC). Therefore, single measurements of plasma hepcidin are unlikely to be a useful marker of iron overload in NTDT patients.
LIC and serum ferritin
The importance of the relationship between the two markers of iron storage, LIC and serum ferritin, lies mainly in the practical management of iron overload in NTDT patients. Increased LIC and serum ferritin levels in NTDT patients are associated with increased morbidities, including vascular, endocrine and bone diseases (Musallam et al, 2011, 2013, 2014). Serum ferritin underestimates body iron stores in NTDT patients in comparison with patients with TDT (Pakbaz et al, 2007; Taher et al, 2008; Lal et al, 2011). However, clinically relevant serum ferritin thresholds have been identified (Musallam et al, 2014; Taher et al, 2015), providing a convenient and inexpensive method of assessing iron overload and tailoring iron chelation therapy when there is restricted access to MRI technology. In the present study, the relationship between LIC and serum ferritin was consistent across all NTDT subgroups. However, the relationship between these two parameters differed between splenectomised and non‐splenectomised patients as serum ferritin levels were increased relative to LIC in splenectomised patients. A mechanistic interpretation requires consideration. The reported lower serum ferritin levels, relative to LIC, in NTDT versus TDT patients is probably secondary to early iron deposition in periportal hepatocytes rather than macrophages (Origa et al, 2007). As serum ferritin at values <3000 μg/l are mainly derived from macrophages (Worwood et al, 1979), the hepatocellular accumulations are relatively ‘invisible’ to the assay for serum ferritin. It is likely that splenectomised patients received more transfusions prior to splenectomy than non‐splenectomised patients, thereby leading to greater iron in the macrophage system and, hence, higher serum ferritin levels relative to LIC. Despite these caveats, serum ferritin levels show the closest relationship to LIC of any of the biomarkers examined. Indeed, the other biomarkers, while being of mechanistic interest, do not correlate with LIC closely enough to justify clinical decisions about chelation therapy to be made on the basis of their levels.
Conclusions
These analyses add insight into the complex interactions between anaemia, ineffective erythropoiesis and iron metabolism, as well as previous clinical management across the clinical spectrum of NTDT patients. Importantly, we have observed increased markers of iron overload across all underlying diagnostic syndromes, confirming significant iron burden in NTDT patients who may, therefore, benefit from optimised iron chelation therapy. A possible relationship of iron overload to the degree of erythroid expansion was seen in patients with Hb H syndromes but was obscured in other subgroups, most likely due to prior blood transfusions and chelation therapy. These Hb H patients were predominantly untransfused and we suggest that in such patients, biomarkers of erythron expansion could, in principle, be predictive of those patients at most risk of developing iron overload. Future studies should aim to validate these relationships in larger patient groups who have not received transfusion or chelation therapy. Our evidence suggests that NTDT patients are at a low risk of NTBI‐ or LPI‐mediated extra‐hepatic damage unless blood transfusions exceed 20 episodes and transferrin is 100% saturated. Therefore, the history of transfusional iron intake, as well as markers or iron overload, should be considered when assessing patients for iron chelation therapy. The findings with hepcidin are of mechanistic interest, particularly the inverse relationship between hepcidin, TfSat, NTBI and LPI, suggesting that high hepcidin levels may limit TfSat, NTBI and LPI levels in NTDT patients and, hence, the extra‐hepatic distribution of iron. However, our findings suggest that hepcidin measurement would not add significantly to the routine management of NTDT patients. The study patients, while representing a wide diagnostic spectrum, may not be fully representative of the full range of NTDT syndromes in the ‘real world,’ because less iron‐overloaded patients were excluded from this study. Other parameters would be of interest for future studies, such as erythroferrone, a newly described erythroid regulatory hormone of hepcidin. However, this study is the most comprehensive examination of factors associated with iron overload across the NTDT spectrum.
Author contributions
JB Porter, MD Cappellini, A Kattamis, V Viprakasit and AT Taher served as investigators on this trial, enrolling patients. They also served as Study Steering Committee members overseeing the conduct of the trial, from study design to analysis plan and data interpretation. KM Musallam contributed to the analysis, interpretation and reporting of the trial data. Z Zhu served as the trial statistician. All authors contributed to data interpretation, reviewed and provided their comments on this manuscript and approved the final version.
Conflicts of interest
JB Porter reports consultancy, receiving research grant funding and honoraria from Novartis Pharmaceuticals, consultancy and honoraria from Shire, and consultancy for Celgene. JB Porter is supported by the NIHR University College London Hospitals Biomedical Research Centre (BRC); MD Cappellini reports receiving honoraria from Novartis Pharmaceuticals, Genzyme and Celgene; A Kattamis received research funding from Novartis Pharmaceuticals and participated in a speakers’ bureau for Novartis Pharmaceuticals and ApoPharma; V Viprakasit received research grant support and lecture fees from Novartis Pharmaceuticals, Genzyme‐Sanofi, Sebia and Roche Diagnostics and research grant support from Shire, Sideris and Faculty of Medicine, Siriraj Hospital, Thailand; KM Musallam and Z Zhu were full‐time employees of Novartis Pharmaceuticals at the time of these analyses; AT Taher reports receiving research funding and honoraria from Novartis Pharmaceuticals and consultancy for Celgene and Sideris.
Supporting information
Table SI. Overview of anaemia, erythron expansion and iron metabolism parameters examined in this study.
Table SII. Summary of all correlations between biomarkers of iron overload, anaemia and erythroid expansion in all NTDT patients (n = 166).
Table SIII. Summary of all correlations between biomarkers of iron overload, anaemia and erythroid expansion in patients with β TI (n = 95)
Table SIV. Summary of all correlations between biomarkers of iron overload, anaemia and erythroid expansion in patients with Hb E/β thalassaemia (n = 49).
Table SV. Summary of all correlations between biomarkers of iron overload, anaemia and erythroid expansion in patients with Hb H syndromes (n = 23)
Acknowledgements
This study was funded by Novartis Pharma AG. We thank Rebecca Helson, PhD, of Mudskipper Business Ltd for medical editorial assistance. Financial support for medical editorial assistance was provided by Novartis Pharmaceuticals Corporation.
References
- Bansal, S.S. , Halket, J.M. , Fusova, J. , Bomford, A. , Simpson, R.J. , Vasavda, N. , Thein, S.L. & Hider, R.C. (2009) Quantification of hepcidin using matrix‐assisted laser desorption/ionization time‐of‐flight mass spectrometry. Rapid Communications in Mass Spectrometry, 23, 1531–1542. [DOI] [PubMed] [Google Scholar]
- Brissot, P. , Wright, T.L. , Ma, W.L. & Weisiger, R.A. (1985) Efficient clearance of non‐transferrin‐bound iron by rat liver. Implications for hepatic iron loading in iron overload states. The Journal of Clinical Investigation, 76, 1463–1470. [DOI] [PMC free article] [PubMed] [Google Scholar]
- Cabantchik, Z.I. , Breuer, W. , Zanninelli, G. & Cianciulli, P. (2005) LPI‐labile plasma iron in iron overload. Best Practice & Research. Clinical Haematology, 18, 277–287. [DOI] [PubMed] [Google Scholar]
- Dussiot, M. , Maciel, T.T. , Fricot, A. , Chartier, C. , Negre, O. , Veiga, J. , Grapton, D. , Paubelle, E. , Payen, E. , Beuzard, Y. , Leboulch, P. , Ribeil, J.A. , Arlet, J.B. , Cote, F. , Courtois, G. , Ginzburg, Y.Z. , Daniel, T.O. , Chopra, R. , Sung, V. , Hermine, O. & Moura, I.C. (2014) An activin receptor IIA ligand trap corrects ineffective erythropoiesis in beta‐thalassemia. Nature Medicine, 20, 398–407. [DOI] [PMC free article] [PubMed] [Google Scholar]
- Esposito, B.P. , Breuer, W. , Sirankapracha, P. , Pootrakul, P. , Hershko, C. & Cabantchik, Z.I. (2003) Labile plasma iron in iron overload: redox activity and susceptibility to chelation. Blood, 102, 2670–2677. [DOI] [PubMed] [Google Scholar]
- Fucharoen, S. & Viprakasit, V. (2009) Hb H disease: clinical course and disease modifiers. Hematology the Education Program of the American Society of Hematology, 26–34. [DOI] [PubMed] [Google Scholar]
- Fucharoen, S. & Weatherall, D.J. (2012) The hemoglobin E thalassemias. Cold Spring Harbor Perspectives in Medicine, 2, a011734. [DOI] [PMC free article] [PubMed] [Google Scholar]
- Galanello, R. & Origa, R. (2010) Beta‐thalassemia. Orphanet Journal of Rare Diseases, 5, 11. [DOI] [PMC free article] [PubMed] [Google Scholar]
- Galanello, R. , Barella, S. , Turco, M.P. , Giagu, N. , Cao, A. , Dore, F. , Liberato, N.L. , Guarnone, R. & Barosi, G. (1994) Serum erythropoietin and erythropoiesis in high‐ and low‐fetal hemoglobin beta‐thalassemia intermedia patients. Blood, 83, 561–565. [PubMed] [Google Scholar]
- Gardenghi, S. , Grady, R.W. & Rivella, S. (2010) Anemia, ineffective erythropoiesis, and hepcidin: interacting factors in abnormal iron metabolism leading to iron overload in beta‐thalassemia. Hematology/Oncology Clinics of North America, 24, 1089–1107. [DOI] [PMC free article] [PubMed] [Google Scholar]
- Harteveld, C.L. & Higgs, D.R. (2010) Alpha‐thalassaemia. Orphanet Journal of Rare Diseases, 5, 13. [DOI] [PMC free article] [PubMed] [Google Scholar]
- Kautz, L. , Jung, G. , Valore, E.V. , Rivella, S. , Nemeth, E. & Ganz, T. (2014) Identification of erythroferrone as an erythroid regulator of iron metabolism. Nature Genetics, 46, 678–684. [DOI] [PMC free article] [PubMed] [Google Scholar]
- Lal, A. , Goldrich, M.L. , Haines, D.A. , Azimi, M. , Singer, S.T. & Vichinsky, E.P. (2011) Heterogeneity of hemoglobin H disease in childhood. New England Journal of Medicine, 364, 710–718. [DOI] [PubMed] [Google Scholar]
- Lal, A. , Porter, J. , Sweeters, N. , Ng, V. , Evans, P. , Neumayr, L. , Kurio, G. , Harmatz, P. & Vichinsky, E. (2013) Combined chelation therapy with deferasirox and deferoxamine in thalassemia. Blood Cells, Molecules, & Diseases, 50, 99–104. [DOI] [PMC free article] [PubMed] [Google Scholar]
- Loreal, O. , Gosriwatana, I. , Guyader, D. , Porter, J. , Brissot, P. & Hider, R.C. (2000) Determination of non‐transferrin‐bound iron in genetic hemochromatosis using a new HPLC‐based method. Journal of Hepatology, 32, 727–733. [DOI] [PubMed] [Google Scholar]
- Musallam, K.M. , Cappellini, M.D. , Wood, J.C. , Motta, I. , Graziadei, G. , Tamim, H. & Taher, A.T. (2011) Elevated liver iron concentration is a marker of increased morbidity in patients with b‐thalassemia intermedia. Haematologica, 96, 1605–1612. [DOI] [PMC free article] [PubMed] [Google Scholar]
- Musallam, K.M. , Taher, A.T. & Rachmilewitz, E.A. (2012) beta‐thalassemia intermedia: a clinical perspective. Cold Spring Harbor Perspectives in Medicine, 2, a013482. [DOI] [PMC free article] [PubMed] [Google Scholar]
- Musallam, K.M. , Cappellini, M.D. & Taher, A.T. (2013) Evaluation of the 5 mg/g liver iron concentration threshold and its association with morbidity in patients with beta‐thalassemia intermedia. Blood Cells, Molecules, & Diseases, 51, 35–38. [DOI] [PubMed] [Google Scholar]
- Musallam, K.M. , Cappellini, M.D. , Daar, S. , Kairmi, M. , El‐Beshlawy, A. , Graziadei, G. , Magestro, M. , Wulff, J. , Pietri, G. & Taher, A.T. (2014) Serum ferritin level and morbidity risk in transfusion‐independent patients with beta‐thalassemia intermedia: the ORIENT study. Haematologica, 99, e218–e221. [DOI] [PMC free article] [PubMed] [Google Scholar]
- O'Donnell, A. , Premawardhena, A. , Arambepola, M. , Allen, S.J. , Peto, T.E. , Fisher, C.A. , Rees, D.C. , Olivieri, N.F. & Weatherall, D.J. (2007) Age‐related changes in adaptation to severe anemia in childhood in developing countries. Proceedings of the National Academy of Sciences of the United States of America, 104, 9440–9444. [DOI] [PMC free article] [PubMed] [Google Scholar]
- Origa, R. , Galanello, R. , Ganz, T. , Giagu, N. , Maccioni, L. , Faa, G. & Nemeth, E. (2007) Liver iron concentrations and urinary hepcidin in b‐thalassemia. Haematologica, 92, 583–588. [DOI] [PubMed] [Google Scholar]
- Pakbaz, Z. , Fischer, R. , Fung, E. , Nielsen, P. , Harmatz, P. & Vichinsky, E. (2007) Serum ferritin underestimates liver iron concentration in transfusion independent thalassemia patients as compared to regularly transfused thalassemia and sickle cell patients. Pediatric Blood & Cancer, 49, 329–332. [DOI] [PubMed] [Google Scholar]
- Pasricha, S.R. , Frazer, D.M. , Bowden, D.K. & Anderson, G.J. (2013) Transfusion suppresses erythropoiesis and increases hepcidin in adult patients with beta‐thalassemia major: a longitudinal study. Blood, 122, 124–133. [DOI] [PubMed] [Google Scholar]
- Pippard, M.J. , Callender, S.T. , Warner, G.T. & Weatherall, D.J. (1979) Iron absorption and loading in b‐thalassaemia intermedia. Lancet, 2, 819–821. [DOI] [PubMed] [Google Scholar]
- Pootrakul, P. , Huebers, H.A. , Finch, C.A. , Pippard, M.J. & Cazzola, M. (1988) Iron metabolism in thalassemia. Birth Defects Original Article Series, 23, 3–8. [PubMed] [Google Scholar]
- Porter, J.B. , Walter, P.B. , Neumayr, L.D. , Evans, P. , Bansal, S. , Garbowski, M. , Weyhmiller, M.G. , Harmatz, P.R. , Wood, J.C. , Miller, J.L. , Byrnes, C. , Weiss, G. , Seifert, M. , Grosse, R. , Grabowski, D. , Schmidt, A. , Fischer, R. , Nielsen, P. , Niemeyer, C. & Vichinsky, E. (2014) Mechanisms of plasma non‐transferrin bound iron generation: insights from comparing transfused diamond blackfan anaemia with sickle cell and thalassaemia patients. British Journal of Haematology, 167, 692–696. [DOI] [PMC free article] [PubMed] [Google Scholar]
- Premawardhena, A. , Fisher, C.A. , Olivieri, N.F. , de Silva, S. , Arambepola, M. , Perera, W. , O'Donnell, A. , Peto, T.E. , Viprakasit, V. , Merson, L. , Muraca, G. & Weatherall, D.J. (2005) Haemoglobin E b thalassaemia in Sri Lanka. Lancet, 366, 1467–1470. [DOI] [PubMed] [Google Scholar]
- Rees, D.C. , Porter, J.B. , Clegg, J.B. & Weatherall, D.J. (1999) Why are hemoglobin F levels increased in HbE/beta thalassemia? Blood, 94, 3199–3204. [PubMed] [Google Scholar]
- Ricchi, P. , Ammirabile, M. , Costantini, S. , Di, M.T. , Verna, R. , Diano, A. , Foglia, M.C. , Spasiano, A. , Cinque, P. & Prossomariti, L. (2012) A useful relationship between the presence of extramedullary erythropoeisis and the level of the soluble form of the transferrin receptor in a large cohort of adult patients with thalassemia intermedia: a prospective study. Annals of Hematology, 91, 905–909. [DOI] [PubMed] [Google Scholar]
- St Pierre, T.G. , Clark, P.R. , Chua‐anusorn, W. , Fleming, A.J. , Jeffrey, G.P. , Olynyk, J.K. , Pootrakul, P. , Robins, E. & Lindeman, R. (2005) Noninvasive measurement and imaging of liver iron concentrations using proton magnetic resonance. Blood, 105, 855–861. [DOI] [PubMed] [Google Scholar]
- Taher, A. , El Rassi, F. , Isma'eel, H. , Koussa, S. , Inati, A. & Cappellini, M.D. (2008) Correlation of liver iron concentration determined by R2 magnetic resonance imaging with serum ferritin in patients with thalassemia intermedia. Haematologica, 93, 1584–1586. [DOI] [PubMed] [Google Scholar]
- Taher, A. , Hershko, C. & Cappellini, M.D. (2009a) Iron overload in thalassaemia intermedia: reassessment of iron chelation strategies. British Journal of Haematology, 147, 634–640. [DOI] [PubMed] [Google Scholar]
- Taher, A. , Musallam, K.M. , El, R.F. , Duca, L. , Inati, A. , Koussa, S. & Cappellini, M.D. (2009b) Levels of non‐transferrin‐bound iron as an index of iron overload in patients with thalassaemia intermedia. British Journal of Haematology, 146, 569–572. [DOI] [PubMed] [Google Scholar]
- Taher, A.T. , Musallam, K.M. , Cappellini, M.D. & Weatherall, D.J. (2011) Optimal management of b‐thalassaemia intermedia. British Journal of Haematology, 152, 512–523. [DOI] [PubMed] [Google Scholar]
- Taher, A.T. , Porter, J. , Viprakasit, V. , Kattamis, A. , Chuncharunee, S. , Sutcharitchan, P. , Siritanaratkul, N. , Galanello, R. , Karakas, Z. , Lawniczek, T. , Ros, J. , Zhang, Y. , Habr, D. & Cappellini, M.D. (2012) Deferasirox significantly reduces iron overload in non‐transfusion‐dependent thalassemia: 1‐year results from a prospective, randomized, double‐blind, placebo‐controlled study. Blood, 120, 970–977. [DOI] [PubMed] [Google Scholar]
- Taher, A.T. , Porter, J.B. , Viprakasit, V. , Kattamis, A. , Chuncharunee, S. , Sutcharitchan, P. , Siritanaratkul, N. , Origa, R. , Karakas, Z. , Habr, D. , Zhu, Z. & Cappellini, M.D. (2015) Defining serum ferritin thresholds to predict clinically relevant liver iron concentrations for guiding deferasirox therapy when MRI is unavailable in patients with non‐transfusion‐dependent thalassaemia. British Journal of Haematology, 168, 284–290. [DOI] [PubMed] [Google Scholar]
- Tanno, T. & Miller, J.L. (2010) Iron loading and overloading due to ineffective erythropoiesis. Advances in Hematology, 2010, 358283. [DOI] [PMC free article] [PubMed] [Google Scholar]
- Tanno, T. , Bhanu, N.V. , Oneal, P.A. , Goh, S.‐H. , Staker, P. , Lee, Y.T. , Moroney, J.W. , Reed, C.H. , Luban, N.L. , Wang, R.‐H. , Eling, T.E. , Childs, R. , Ganz, T. , Leitman, S.F. , Fucharoen, S. & Miller, J.L. (2007) High levels of GDF15 in thalassemia suppress expression of the iron regulatory protein hepcidin. Nature Medicine, 13, 1096–1101. [DOI] [PubMed] [Google Scholar]
- Vichinsky, E. (2007) Hemoglobin E syndromes. Hematology/the Education Program of the American Society of Hematology, 79–83. [DOI] [PubMed] [Google Scholar]
- Vichinsky, E.P. (2013) Clinical manifestations of alpha‐thalassemia. Cold Spring Harbor Perspectives in Medicine, 3, a011742. [DOI] [PMC free article] [PubMed] [Google Scholar]
- Walter, P.B. , Macklin, E.A. , Porter, J. , Evans, P. , Kwiatkowski, J.L. , Neufeld, E.J. , Coates, T. , Giardina, P.J. , Vichinsky, E. , Olivieri, N. , Alberti, D. , Holland, J. & Harmatz, P. (2008) Inflammation and oxidant‐stress in beta‐thalassemia patients treated with iron chelators deferasirox (ICL670) or deferoxamine: an ancillary study of the Novartis CICL670A0107 trial. Haematologica, 93, 817–825. [DOI] [PubMed] [Google Scholar]
- Weatherall, D.J. (2012) The definition and epidemiology of non‐transfusion‐dependent thalassemia. Blood Reviews, 26, S3–S6. [DOI] [PubMed] [Google Scholar]
- Worwood, M. , Cragg, S.J. , Wagstaff, M. & Jacobs, A. (1979) Binding of human serum ferritin to concanavalin A. Clinical Science (Lond), 56, 83–87. [DOI] [PubMed] [Google Scholar]
Associated Data
This section collects any data citations, data availability statements, or supplementary materials included in this article.
Supplementary Materials
Table SI. Overview of anaemia, erythron expansion and iron metabolism parameters examined in this study.
Table SII. Summary of all correlations between biomarkers of iron overload, anaemia and erythroid expansion in all NTDT patients (n = 166).
Table SIII. Summary of all correlations between biomarkers of iron overload, anaemia and erythroid expansion in patients with β TI (n = 95)
Table SIV. Summary of all correlations between biomarkers of iron overload, anaemia and erythroid expansion in patients with Hb E/β thalassaemia (n = 49).
Table SV. Summary of all correlations between biomarkers of iron overload, anaemia and erythroid expansion in patients with Hb H syndromes (n = 23)