

Summary
In general, plants and arbuscular mycorrhizal (AM) fungi exchange photosynthetically fixed carbon for soil nutrients, but occasionally nonphotosynthetic plants obtain carbon from AM fungi. The interactions of these mycoheterotrophic plants with AM fungi are suggested to be more specialized than those of green plants, although direct comparisons are lacking.
We investigated the mycorrhizal interactions of both green and mycoheterotrophic plants. We used next‐generation DNA sequencing to compare the AM communities from roots of five closely related mycoheterotrophic species of Thismia (Thismiaceae), roots of surrounding green plants, and soil, sampled over the entire temperate distribution of Thismia in Australia and New Zealand.
We observed that the fungal communities of mycoheterotrophic and green plants are phylogenetically more similar within than between these groups of plants, suggesting a specific association pattern according to plant trophic mode. Moreover, mycoheterotrophic plants follow a more restricted association with their fungal partners in terms of phylogenetic diversity when compared with green plants, targeting more clustered lineages of fungi, independent of geographic origin.
Our findings demonstrate that these mycoheterotrophic plants target more narrow lineages of fungi than green plants, despite the larger fungal pool available in the soil, and thus they are more specialized towards mycorrhizal fungi than autotrophic plants.
Keywords: arbuscular mycorrhizal (AM) fungi, habitat filtering, mycoheterotrophy, phylogenetic niche conservatism, specificity, Thismia
Introduction
The interaction between arbuscular mycorrhizal (AM) fungi and over 80% of land plants is one of the most widespread mutualisms on Earth (Smith & Read, 2008). AM fungi, which are abundant in most terrestrial ecosystems, are obligatorily associated with the roots of plants and act like extensions of plant root systems to increase the uptake of nutrients, especially phosphorus (Karandashov & Bucher, 2005). However, despite the ubiquity of the interaction, the mechanisms that control its above‐ and belowground diversity are not well understood (van der Heijden et al., 2015).
Plant diversity and productivity are significantly influenced by the AM fungal diversity in the soil (van der Heijden et al., 1998; Vogelsang et al., 2006). A key component of plant productivity is photosynthetic fixation of inorganic carbon. It is this carbon that plants transfer to their mycorrhizal partners in exchange for soil nutrients (Smith & Read, 2008). Occasionally, plant lineages lose the ability to perform photosynthesis but maintain belowground links with mycorrhizal fungi. This phenomenon has long fascinated researchers (e.g. Ramsbottom, 1929; McLennan, 1958) because, in such systems, the expected outcome is that the fungi would also withdraw their participation in the interaction (Sachs & Simms, 2006). Instead, these nonphotosynthetic plants, known as mycoheterotrophs, still harbor AM fungi growing in their roots (e.g. Leake, 1994; Bidartondo et al., 2002; Merckx et al., 2012).
Mycoheterotrophy is a trophic strategy present in > 20 000 plant species (Merckx, 2013). It is characterized by the absence of photosynthesis, with plants obtaining carbon via the mycorrhizal fungi associated with their roots. The only known way in which AM fungi obtain their carbon is through symbiosis with a photosynthetic plant. Thus, mycoheterotrophic plants must rely on established mutualisms between photosynthetic plants and AM fungi, becoming cheaters within three‐partite interactions (Bidartondo, 2005; Sachs & Simms, 2006). Mycoheterotrophy can occur (1) throughout the life cycle of a plant, such as in some orchids and monotropes, (2) simultaneously with autotrophy, this being termed partial mycoheterotrophy, as in some orchids (Gebauer & Meyer, 2003), or (3) during a short period in the life cycle of a plant, being subsequently replaced by an autotrophic mode of nutrition, such as in many ferns and lycopods, and some orchids (but see Gebauer et al., 2016). Thus, mycoheterotrophy can be seen as a dynamic interaction along a continuum of possible outcomes. Because mycorrhizal associations are generally mutualistic (Smith & Read, 2008), it is intriguing why, and which, fungi are part of a mycoheterotrophic interaction. In particular, the differences between mycorrhizal associations of mycoheterotrophic and green plants, and potential preferences for particular fungal lineages, remain poorly understood. Many mycoheterotrophic plants are known to have more specialized interactions with basidiomycete fungi (i.e. they interact with fewer fungal lineages) than ectomycorrhizal green plants, presumably to increase their fitness by optimizing host adaptation (Cullings et al., 1996; Bidartondo, 2005). However, the level of mycorrhizal specificity for arbuscular mycoheterotrophic plants remains poorly understood, as comprehensive direct comparisons between AM interactions of mycoheterotrophic and green plants have not been reported. To investigate this, data on the mycorrhizal partners of mycoheterotrophic plants need to be generated and compared with those for the fungal communities associated with green plants.
In the past few years, the study of fungal diversity patterns has become more important in understanding the mechanisms driving plant biodiversity (Öpik et al., 2009; Davison et al., 2011; Peay et al., 2013). Next‐generation sequencing techniques to identify AM fungi allow assessments of the complex fungal communities in soil and plant roots (Toju et al., 2014). However, species delimitation of the ancient and apparently strictly asexual AM fungi has long been debated and no consensus has been achieved for suitable molecular markers with sufficient resolution for species‐level identification, nor for the cut‐off values to be used in clustering operational taxonomic units for species prediction (Bruns & Taylor, 2016). Thus, measuring species richness with standard methods may introduce a bias in the assessment of the composition of fungal communities. To better understand how communities are structured, an integration of phylogenetic structure, trait information and community composition can offer relevant insights into the evolutionary and ecological processes shaping communities (Webb et al., 2002). At the community scale, species should be segregated based on relative strengths of habitat filtering and competition among similar species. Community structure can be phylogenetically clustered, random, or overdispersed on the phylogeny of the entire available pool of species. For example, Kembel & Hubbell (2006) showed that phylogenetic structure of rainforest tree communities varied among habitats in Panama. They found communities with more closely related taxa than expected by chance (phylogenetically clustered), suggesting strong habitat filtering as the driving force of community assemblages, while other communities were composed of more distantly related taxa (overdispersion), suggesting current or past competitive exclusion between closely related taxa, or convergent evolution of important traits for persistence in such habitats.
In this study, we considered a community to be composed of fungal operational taxonomic units (OTUs) belonging to the same trophic level and the same guild (AM fungi: mycorrhizal fungi from the Glomeromycota phylum) co‐occurring spatially in the roots of a plant. We compared the phylogenetic structure of the fungal communities associated with Thismia plants and co‐occurring green plants (comparing plant nutrition types: mycoheterotrophic and autotrophic) confined to the distribution area of the selected mycoheterotrophic lineage, by studying the fungal community composition in their roots using high‐throughput DNA sequencing methods. We considered the level of phylogenetic clustering as a proxy for the mycorrhizal specificity of a plant. A plant species can have specialized mycorrhizal interactions by targeting a single or a few phylogenetically narrow fungal clades, or generalist mycorrhizal interactions by targeting more dispersed phylogenetic fungal lineages. We focused on temperate mycoheterotrophic Thismia species to evaluate the mycorrhizal association patterns within a lineage of closely related mycoheterotrophic plants. Because specificity in biotic interactions may differ considerably over a species’ distribution range (Thompson, 2005), we studied the interactions over the geographic range of this Thismia clade. Soil samples were included to estimate the fungal pool available for these species. To evaluate general differences in fungal community structure between mycoheterotrophic and autotrophic plants, we used phylogenetic measures to infer community structure.
Materials and Methods
Sampling
We sampled temperate forest sites in Australia and New Zealand over the known distribution range of the genus Thismia in the region. We visited sites where Thismia species are known to occur, and we surveyed other potential occurrence sites with similar habitats (Merckx & Wapstra, 2013). These plants have always been considered extremely rare, and therefore the number of specimens available per site was limited. At each site, one to five Thismia specimens were sampled, at least 1 m from each other. This resulted in sampling 18 sites within three broad areas: four in New South Wales (NSW), 10 in Tasmania (TAS) and four in New Zealand (NZ). See Supporting Information Fig. S1 for details.
For each specimen, the entire root system of Thismia and the root tips (c. 1 cm) of surrounding plants were taken and preserved in 2X CTAB (hexadecyl trimethyl‐ammonium bromide) buffer. The sampling of the surrounding green plants was carried out by selecting up to eight root tips of green plants found in the same soil clump (10 × 10 cm) as Thismia. To estimate the fungal pool available for all plant species, soil was sampled from the soil clump as well. Soil was dried on silica gel before DNA extraction. The sampling effort resulted in 99 samples, including mycoheterotrophic plants, green plants and soil (Table S1). All plant roots were identified using molecular methods (Methods S1).
Assessment of fungal communities using Ion Torrent
Fungal DNA was extracted from the CTAB‐preserved roots with the KingFisher Flex Magnetic Particle Processor (Thermo Fisher Scientific, Waltham, MA, USA) using the NucleoMag 96 Plant Kit (Macherey‐Nagel Gmbh & Co., Düren, Germany). Subsequently, amplicon libraries were created to amplify the internal transcribed spacer (ITS2), using the fungal‐specific primer fITS7 (Ihrmark et al., 2012) and ITS4 (White et al., 1990) with a unique multiplex identifier (MID) label per sample, following the protocol described in Ihrmark et al. (2012). Sequencing was performed with a Personal Genome Machine (Ion Torrent; Life Technologies, Guilford, CT, USA) with 850 flows. Sequences obtained were processed using the uparse algorithm (Edgar, 2013) incorporated in usearch v.7 (http://www.drive5.com/usearch/). Fastq files were screened for quality control and trimmed at the first base with a Phred score of Q < 20. Dereplication was performed, singletons and sequences with < 100 bp were filtered out, and the resulting sequences were clustered into OTUs at 97% similarity (Blaalid et al., 2013). The taxonomy was assigned to the OTUs with uparse, based on the UNITE + INSD database (10.09.2014) implemented with the current Index Fungorum identification. Only OTUs belonging to the Glomeromycota were kept for further analysis. The raw data were deposited in the National Center for Biotechnology Information (NCBI) Sequence Read Archive under the accession SRP083901. Because of the imbalanced number of specimens obtained for mycoheterotrophic and green plants, we calculated the species richness estimate Chao2 (Chiu et al., 2014) for each plant group, using the function specpool in the vegan R package (Oksanen et al., 2015).
Fungal community dissimilarities among samples
We calculated the phylogenetic relatedness between the OTUs to measure community differences between samples. An alignment of the OTU sequences and several reference Glomeromycota taxa from Krüger et al. (2011) was constructed with Mafft (Katoh, 2013). Phylogenetic inference on the alignment was performed with Raxmlhpc‐sse3 (Stamatakis, 2014) using the GTR + G + I model of substitution as determined by jmodeltest v.2.1.5 using the Akaike information criterion (AIC) (Darriba et al., 2012). The phylogenetic distances among fungal OTUs given the highest likelihood tree were used to obtain a fungal community dissimilarity matrix between all the pairs of samples, using the function Comdist in the picante R package (R Development Core Team, 2008; Kembel et al., 2010). This algorithm finds for each fungal OTU in one sample the average distance to all the OTUs in the other sample, and calculates the mean of these phylogenetic distances. The fungal community dissimilarities were visualized by performing a metaMDS in the vegan R package (Oksanen et al., 2015). We investigated whether these fungal community dissimilarities differed between the ‘type’ of material (mycoheterotrophic plants, green plants, and soil) and ‘region’ (New South Wales, Tasmania and New Zealand) with a permutational MANOVA using the function adonis in the vegan R package (Oksanen et al., 2015).
In addition, we explored whether the community dissimilarity patterns observed in the Thismia species were correlated with the plant evolutionary relationships by computing the Mantel test correlation between the fungal community dissimilarity matrix and the phylogenetic distance matrix among the Thismia species (see Methods S2 for detailed methods).
Fungal phylogenetic community structure
To investigate the fungal community structure, we calculated the phylogenetic community structure indices developed by Webb (2000) for community assessment of rainforest trees, which have previously been successfully applied in fungal community studies (e.g. Peay et al., 2010; Maherali & Klironomos, 2012). The net relatedness index (NRI) and the nearest taxa index (NTI) measure the degree of phylogenetic clustering of a group of taxa over the whole pool of taxa in a phylogenetic tree or within particular terminal clades, respectively. Positive values indicate that the fungal OTUs are more closely related to one another than expected by chance (phylogenetic clustering), and negative values indicate that the fungal OTUs are more distantly related (phylogenetic evenness). The NRI measures the overall clustering across the phylogeny using the average pairwise distance of all taxa from a community. NRI is then equal to 1 – (MPDobserved – MPDrandom)/SD(MPDrandom), where MPD is the mean phylogenetic distance, which measures phylogenetic distance among taxa using the pairwise branch length distances. The pairwise phylogenetic distances among the fungal taxa were obtained from the fungal OTU phylogeny. Numerically, NRI is the inverse of the standardized effect size of the MPD, which compares the average phylogenetic relatedness in the observed and null communities, under a null model of randomizations, standardized by the standard deviation (SD) of phylogenetic distances in the null community (Webb et al., 2002). We obtained 999 randomizations, shuffling the tips of the phylogeny from the total pool of fungal taxa. The NTI measures the terminal clustering among the taxa from the community. NTI is then equal to 1 – (MNTDobserved – MNTDrandom)/SD(MNTDrandom), where MNTD is the mean nearest phylogenetic taxon distance, which measures the minimal distance separating each species in the community. Numerically, NTI is the inverse of the standardized effect size of the MNTD, calculated similarly to MPD (Webb et al., 2002). The standardized effects of the MPD and MNTD measures were calculated using the picante R package (Kembel et al., 2010).
In addition, for Thismia we reconstructed the NRI value of the most recent common ancestor of the clade based on the plant phylogenetic tree (pruned to contain only one taxon per species) and NRI values per species. Reconstruction was performed using phylogenetic independent constrasts (Felsenstein, 1985) as implemented in ape (Paradis et al., 2004).
General patterns of fungal community structure
Because we were interested in general patterns of community structure, such as the specificity of interactions per trophic strategy, we focused on the NRI for an overall view of community clustering along the phylogeny. The observation of an overall phylogenetic clustered pattern indicates more specialized interactions, where the targeted fungal OTU taxa are more closely related than expected by chance. An overall phylogenetic overdispersion pattern suggests that the interactions are more generalist, where the targeted taxa are more spread out over the phylogenetic tree than expected by chance. In order to test the effects of the ‘type’ of material (mycoheterotrophic, green plants, and soil) on the NRI, we constructed a linear mixed‐effects model with NRI as the response variable and ‘type’ of material as the predictor variable. We considered ‘region’ as a random factor to account for the nonindependence of the collections within and across regions. We then used a post hoc pairwise comparison test (Tukey's honest significant difference (HSD)) to assess whether the three types of material differed significantly from each other in their NRI.
Results
Plant identification
We successfully obtained sequences from the roots of 60 specimens of five Thismia species, 24 specimens of 11 green plant species and 25 soil samples (see Table S1 for details). The Thismia species were identified as Thismia clavarioides K. R. Thiele, Thismia hillii (Cheeseman) N. Pfeiff., Thismia megalongensis C. Hunt, G. Steenbeeke & V. Merckx, Thismia rodwayi F. Muell., and a fifth species that remains to be described, here termed Thismia sp. For the green plants, we identified the following species (Methods S1): Apocynaceae sp.; Laurelia novae‐zelandiae A. Cunn., and Doryphora sassafras Endl. (Atherospermataceae); Bignoniaceae sp.; Ceratopetalum apetalum D. Don (Cunoniaceae); Beyeria viscosa Labill. (Euphorbiaceae); Acacia sp. (Fabaceae); Beilschmiedia tawa (A. Cunn.) Kirk (Lauraceae); Pomaderris apetala Labill. (Rhamnaceae); Nematolepis sp. Turcz. (Rutaceae); and Vitaceae sp. (Table S1).
The success rate of sequencing Glomeromycota fungi from the autotrophic plants was considerably lower than for Thismia, and for several surrounding root samples we failed to obtain Glomeromycota OTUs. Some of the autotrophic plants are putatively ectomycorrhizal, which may explain the absence of Glomeromycota OTUs in surrounding roots. Pomaderris apetala and Acacia sp. can be both ectomycorrhizal and AM, and all other species are described as AM (Brundrett, 2008), except for Beyeria viscosa and Nematolepis sp. for which the mycorrhizal status is unknown, making them suitable for the comparisons in the downstream analysis.
Fungal sequences
Ion Torrent sequencing produced 4038 169 raw sequences, of which 3836 916 passed the quality filtering. After the quality control steps, the resulting sequences were clustered at 97% similarity, generating 466 OTUs, of which 99 OTUs were assigned to Glomeromycota and kept for subsequent analysis. Of these, 31 OTUs were found in the mycoheterotrophic plants, 28 OTUs were found in the green plants and 69 OTUs were found in the soil. The number of OTUs was not linearly correlated to the variable number of reads per sample, and thus neither is it linearly correlated to the number of OTUs per type of material (see Fig. S2). Using the Chao2 estimator, we obtained richness estimates of 32.26 ± SD 1.77 for mycoheterotrophic plants, 36.61 ± SD 6.30 for green plants, and 101.67 ± SD 15.12 for soil. Fig. 1 shows the highest likelihood phylogeny among the fungal OTUs and respective presence in mycoheterotrophic plants, green plants and soil. The fungal communities of the five Thismia species included Glomeromycota in the Rhizophagus/Sclerocystis sp. subclade; for the green plants, the same clades of fungi were present with the addition of the Glomus sp. subclade; in the soil, Glomerales, Diversisporales and Archaeosporales fungi were present.
Figure 1.

Highest likelihood tree (LnL = −10519.28) showing the phylogenetic relationships among the Glomeromycota operational taxonomic units (OTUs) found in all the samples, including several reference sequences. The colored circles indicate the presence of the fungal OTUs according to plant group (mycoheterotrophic, yellow; autotrophic, green) and the pool of fungal OTUs present in the soil (blue). Mycoheterotrophic plants of the genus Thismia are associated with fungi in the Glomerales family (one subclade: Rhizophagus/Sclerocystis sp.); and green plants are also associated with fungi in the Glomerales family (two subclades: Rhizophagus/Sclerocystis sp. and Glomus sp.). The soil also harbors fungi from the Glomerales family, and also from the Diversisporales and Archaeosporales families within the Glomeromycota phylum.
Fungal community dissimilarities
Fungal community dissimilarities were calculated among all the samples, including mycoheterotrophic plants, green plants and soil. In Fig. 2, a nonmetric multidimensional scaling plot shows an ordination of the fungal community dissimilarities. Furthermore, we found no phylogenetic signal on the fungal community dissimilarities among the different Thismia species (Mantel test: r = 0.092; P = 0.196). Thus, we proceeded with the fungal community dissimilarity analysis including the green plants and looked for patterns within the ‘type’ of material (mycoheterotrophic plants, green plants and soil), and we also looked for geographic patterns (‘region’: Tasmania, New South Wales and New Zealand). Permutational MANOVA (Adonis) showed significant fungal community dissimilarity for ‘type’ of material (F = 25.4; R 2 = 0.486; P = 0.001), but not for ‘region’ (F = 0.925; R 2 = 0.018; P = 0.427). These results suggest a distinctive and specific association pattern of the fungal communities for mycoheterotrophic plants, green plants and soil, regardless of the region in which they occur.
Figure 2.
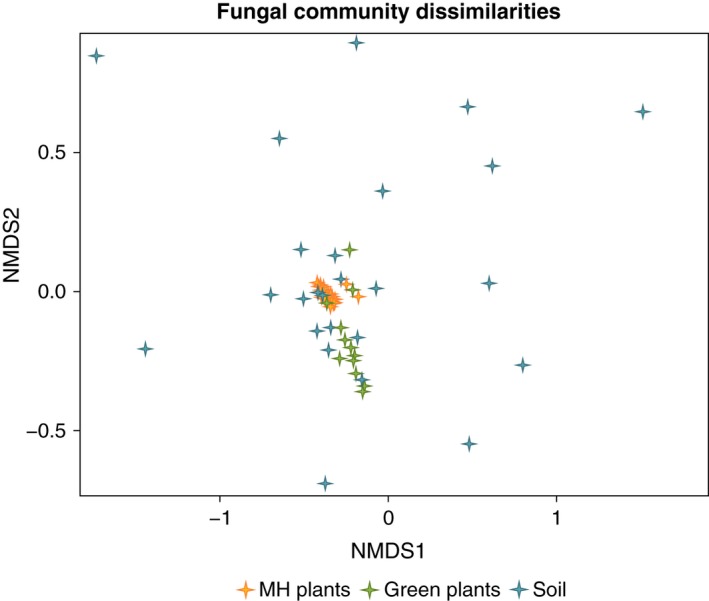
Nonmetric multidimensional scaling plot (metaMDS) showing an ordination of the fungal community dissimilarities (Comdist) among all the samples. The fungal community dissimilarities are calculated based on the average phylogenetic distance between each fungal operational taxonomic unit (OUT) in one sample and the total OTUs in the other sample. Each symbol represents the Comdist of the fungal communities including all the OTUs found in each species per site. Permutational MANOVA (Adonis) showed significant fungal community dissimilarity between mycoheterotrophic (MH) Thismia plants, green plants, and soil (F = 25.4; R 2 = 0.486; P = 0.001).
Fungal phylogenetic community structure
We observed that all the mycoheterotrophic plants exhibited positive and significant NRI and NTI values (Table 1), which indicates a significant phylogenetic structure of the fungal communities. The two indices were correlated (Fig. S3). By contrast, most of the green plants and soil communities were phylogenetically randomly structured for both indices (Table 1). The roots of mycoheterotrophic plants tended to be colonized by AM fungi that were more closely related than expected by chance. The green plants tended to show no clear pattern in general, except for five species that presented phylogenetic structure. The soil also seemed to be mostly randomly phylogenetically structured. Overall, the two indices were concordant.
Table 1.
Net relatedness index (NRI) and nearest taxa index (NTI) results for the fungal communities of mycoheterotrophic (MH) plants (Thismia), green plants and soil
| Type | Samples | n | NRI | RGR | NTI | RGR |
|---|---|---|---|---|---|---|
| MH plants | T. rodwayi 1 TAS | 12 | 4.14b | 999 | 2.38b | 999 |
| T. rodwayi 2 TAS | 4 | 2.16b | 996 | 1.77b | 996 | |
| T. rodwayi 3 TAS | 9 | 3.42b | 999 | 2.13b | 999 | |
| T. rodwayi 4 TAS | 14 | 4.49b | 999 | 2.44b | 999 | |
| T. rodwayi 5 TAS | 12 | 4.13b | 999 | 2.34b | 999 | |
| T. rodwayi 6 TAS | 3 | 1.79b | 999 | 1.65b | 998 | |
| T. rodwayi 7 TAS | 8 | 3.23b | 999 | 2.12b | 999 | |
| T. rodwayi 8 TAS | 9 | 3.41b | 999 | 2.14b | 999 | |
| T. rodwayi 9 TAS | 12 | 4.20b | 999 | 2.41b | 999 | |
| T. rodwayi 10 TAS | 8 | 3.24b | 999 | 2.09b | 999 | |
| T. clavarioides NSW | 5 | 2.53b | 999 | 1.72b | 995 | |
| Thismia sp. NSW | 3 | 1.80b | 997 | 1.55b | 998 | |
| Thismia sp. NSW | 4 | 1.74b | 979 | 1.44b | 957 | |
| T. hillii NSW | 7 | 3.00b | 999 | 2.08b | 999 | |
| T. megalongensis NSW | 6 | 2.67b | 999 | 2.08b | 999 | |
| T. hillii 1 NZ | 9 | 3.29b | 999 | 2.17b | 999 | |
| T. hillii 2 NZ | 4 | 1.95b | 991 | 1.65b | 994 | |
| T. hillii 3 NZ | 6 | 2.68b | 998 | 2.04b | 999 | |
| T. hillii 4 NZ | 6 | 2.61b | 999 | 1.96b | 999 | |
| Green plants | Acacia sp. TAS | 2 | 0.92 | 818 | 0.92 | 808 |
| Beyeria viscosa TAS | 2 | 0.53 | 567 | 0.54 | 545 | |
| Pomaderris apetala TAS | 4 | 1.13 | 788 | 1.11 | 840 | |
| Nematolepis sp. TAS | 2 | 1.24a | 919 | 1.21a | 935 | |
| Acacia sp. NSW | 2 | 1.20 | 892 | 1.19 | 868 | |
| Bignoniaceae sp. NSW | 3 | 1.66b | 986 | 1.52b | 975 | |
| Ceratopetalum apetallum NSW | 3 | 1.02 | 774 | 0.97 | 788 | |
| Doryphora sassafras NSW | 10 | 2.97b | 999 | 1.70b | 975 | |
| Vitaceae sp. NSW | 7 | 2.15b | 988 | 1.44a | 921 | |
| Apocynaceae sp. NSW | 6 | 1.30 | 887 | 0.84 | 739 | |
| Beilschmiedia tawa NZ | 3 | 0.75 | 656 | 0.55 | 624 | |
| Laurelia novae‐zelandiae NZ | 13 | 2.28b | 983 | 1.93b | 993 | |
| Soil | Soil 1 TAS | 9 | 0.06 | 523 | −0.91 | 181 |
| Soil 2 TAS | 2 | 1.19 | 890 | 1.19 | 892 | |
| Soil 3 TAS | 2 | −1.13 | 153 | −1.14 | 157 | |
| Soil 4 TAS | 6 | 2.65b | 999 | 2.07b | 999 | |
| Soil 5 TAS | 11 | −1.26 | 105 | −1.85 | 38 | |
| Soil 6 TAS | 5 | 0.59 | 735 | 0.46 | 669 | |
| Soil 7 TAS | 2 | −1.43 | 69 | −1.46 | 67 | |
| Soil 8 TAS | 3 | 0.74 | 679 | 0.84 | 777 | |
| Soil 9 TAS | 6 | 1.16 | 829 | 0.67 | 722 | |
| Soil 10 TAS | 9 | −1.86 | 30 | 2.02b | 994 | |
| Soil 11 TAS | 2 | 1.32b | 993 | 1.39b | 995 | |
| Soil 12 TAS | 13 | −0.26 | 385 | 1.86b | 982 | |
| Soil 13 TAS | 14 | −0.92 | 184 | 1.04 | 855 | |
| Soil 14 TAS | 2 | −1.49 | 70 | −1.52 | 71 | |
| Soil 15 TAS | 7 | 0.65 | 717 | 0.61 | 709 | |
| Soil 16 TAS | 4 | 2.20b | 996 | 1.77b | 997 | |
| Soil 17 TAS | 5 | 0.79 | 757 | 0.57 | 717 | |
| Soil 18 TAS | 3 | 0.04 | 561 | 0.46 | 648 | |
| Soil 1 NSW | 4 | −0.67 | 273 | −0.44 | 312 | |
| Soil 2 NSW | 16 | −0.38 | 376 | 2.36b | 998 | |
| Soil 3 NSW | 3 | 1.34a | 933 | 1.36a | 945 | |
| Soil 4 NSW | 3 | 1.65b | 971 | 1.50b | 993 | |
| Soil 5 NSW | 2 | 0.33 | 496 | 0.30 | 474 | |
| Soil 6 NSW | 3 | 0.80 | 667 | 0.95 | 812 | |
| Soil NZ | 6 | 1.30 | 864 | 1.29 | 893 |
Samples, species per site; n, number of OTUs in a community; RGR, number of times the observed NRI or NTI was greater than the value obtained for the random permuted communities.
Communities significantly structured at the P = 0.10 level.
Communities significantly structured at the P = 0.05 level.
The NRI of the most recent common ancestor of the Thismia clade was reconstructed to be 4.00 (95% confidence interval (CI) 3.26–4.74; see Fig. S4).
General patterns of fungal community structure
The mixed‐effects model results showed that the fungal community structure was significantly explained by the ‘type’ of material. The fungal communities associated with the mycoheterotrophic plants were significantly more closely related to each other than in the case of the green plants and the soil. Likewise, for the green plants, the fungal communities were also significantly more closely related to each other than in the soil (see Fig. 3; Table S2).
Figure 3.

Fungal community structure based on the net relatedness index (NRI) for each species per site. The graph represents the fungal communities’ phylogenetic dispersion patterns as explained by the ‘type’ of material (mycoheterotrophic (MH) plants, green plants and soil). Negative NRI values indicate that the fungal communities are overdispersed in the phylogenetic tree, while positive NRI values indicate phylogenetic clustering. The NRI was significantly different in MH plants compared with green plants and soil. MH plants harbor more phylogenetically clustered AM fungal communities in their roots than green plants and the soil. Green plants also have significantly more clustered fungal communities than the soil. The mixed‐effects model estimates with 95% confidence intervals are shown. See Supporting Information Table S2 for statistical details.
Discussion
The plant sampling was designed to investigate the fungal community structure of closely related mycoheterotrophic plant species over their entire geographic range and, at the same time, compare their fungal community structure with that of the surrounding autotrophic plants, as a proxy for mycoheterotrophic and autotrophic types of nutrition, respectively. The soil data were used as a proxy for the diversity of local AM fungi. As expected, the soil presented a higher fungal diversity compared with individual plants, as it harbors the fungal reservoir from which the plant species obtain their fungal partners (Table S1).
Our results indicate that, in general, mycoheterotrophic and green plants have distinct fungal community compositions with no geographic pattern (Fig. 2; Adonis test). In addition, the five closely related Thismia species tended to associate with more closely related AM fungi more often than expected by chance. Observations of other cases of mycoheterotrophic species growing on narrow phylogenetic lineages of AM fungi have been reported previously, for example Arachnitis (Bidartondo et al., 2002), Afrothismia (Merckx & Bidartondo, 2008), Burmannia (Ogura‐Tsujita et al., 2013) and Petrosavia (Yamato et al., 2011). Moreover, we observed that the phylogenetic structure of the fungal communities can vary according to the type of nutrition of a plant (i.e. mycoheterotrophic vs autotrophic; see Fig. 3).
For the mycoheterotrophic plants, we detected significant NRI and NTI values (Table 1). These two indices provide information about community structure that is different from that provided by richness or taxonomic composition. In view of the unequal number of specimens of mycoheterotrophic and green plants and differences in sequencing success, we calculated the improved richness estimator Chao2 of Chiu et al. (2014), incorporating a small‐sample correction. This estimator reduces the bias when the heterogeneity of species detection probabilities is relatively high (Chiu et al., 2014). While the estimated richness was higher for the green plants than for the mycoheterotrophic plants, the observed richness was higher for the mycoheterotrophic plants. Considering phylogenetic relatedness among the taxa, we found that, within the Glomeraceae family, the fungi associated with mycoheterotrophic plants belonged to one subclade, while green plants had fungal partners in two subclades (Fig. 1). Thus, the higher estimated richness for the green plants corresponded to a higher phylogenetic diversity compared with the mycoheterotrophic plants.
The phylogenetic clustering pattern observed in the mycoheterotrophic plants’ fungal communities reflected ecological rather than biogeographic patterns, as there was no geographical structure of the fungal communities. Moreover, the tendency of Thismia species to target the same narrow clades of AM fungi (Fig. S5), and their similar levels of mycorrhizal specificity (Table 1), also reconstructed to have been present in the most recent common ancestor of the clade (Fig. S4), strongly suggest that the high level of mycorrhizal specificity is prone to phylogenetic niche conservatism (Harvey & Pagel, 1991; Lord et al., 1995), that is, the tendency of these Thismia species to retain similar ecological traits (i.e. similar fungal communities) over time (Wiens & Graham, 2005; Wiens et al., 2010). The phylogenetic niche conservatism observed in Thismia may be attributable to a reduction in the potential range of ecological character evolution caused by fixation of ancestral traits, enabling the descendants within this plant lineage to be more successfully adapted in particular and similar habitat types (Lord et al., 1995). The reason for the preference for targeting certain lineages of AM fungi in this mycoheterotrophic interaction is still not well understood. It is certainly not caused by a limited local availability of AM fungi, because we detected a much larger and phylogenetically broader pool of available fungi in the soil. Similar to the explanation for the high host specificity of many parasites, the mycoheterotrophs may fine‐tune their physiology on particular lineages of fungi to maximize their carbon uptake (Leake & Cameron, 2010). Alternatively, the mycoheterotrophic plants may be rejected by most fungal lineages in the pool of available fungi, and therefore the pattern would result from an evolutionary arms race (Bidartondo, 2005). Therefore, it is our interpretation that the fungal communities associated with these mycoheterotrophic plants might have been shaped not only by habitat filtering (occurrence of the fungal partners in space), but also by an effect of the ancestry of the plant species, which allow this local third‐party cheater (Thismia) to participate in the globally mutualistic AM interaction with autotrophic plants.
For the green plants, some species showed significantly phylogenetically clustered AM fungal communities (Table 1). Specific patterns in the fungal associations of green plants have been previously reported in other studies (e.g. Öpik et al., 2009; Davison et al., 2011; Peay et al., 2013). Nonetheless, other green plants in our study presented a randomly assembled fungal community. This may reflect a different community structure according to plant species, but it may also be an effect caused by an underrepresentation of the fungal communities, which was more likely to occur in the green plants than in the mycoheterotrophic plants because of sampling method limitations. For the green plants we could only collect a few centimeters of the extensive root system, so, because of the scattered pattern of AM fungal colonization along the roots, we may have assessed a limited fraction of the whole diversity, while for the mycoheterotrophic plants, we collected the entire small root system. Nevertheless, we do not think that this underrepresentation of green plants’ fungal communities introduced bias to our results, because although it could be assumed that we were observing partial diversity, we obtained less phylogenetic clustering in green plants than in mycoheterotrophic plants. The phylogenetic clustering of these communities would become even more diluted with the introduction of more phylogenetically different taxa in the analysis, and therefore the specificity would decrease (Webb, 2000).
Generally, the comparison of fungal communities associated with mycoheterotrophic and autotrophic plants showed that this particular lineage of mycoheterotrophic Thismia species have significantly more specialized interactions than the green plants living in the same regions (Fig. 3). Mycoheterotrophic plants had significantly more specialized fungal interactions than green plants, because the mycoheterotrophs showed higher NRI values almost exclusively. Similarly, mycoheterotrophic plants also had generally higher ranks of NTI values (Table 1). This suggests that, within the Glomerales subclade targeted by mycoheterotrophic plants, these plants also tend to target specific lineages at a lower taxonomic level. These results support the view that mycoheterotrophic mycorrhizal interactions are highly specialized. By contrast, green plants did not always show significantly clustered patterns. If we excluded the green plants for which we detected fewer than three OTUs (minimum number of OTUs found in the Thismia species), we found that half of the autotrophic plants (Doryphora sassafras, Bignoniaceae sp., Laurelia novae‐zelandiae and Vitaceae sp.) tended to associate with more closely related main lineages of AM fungi than expected by chance, but generally with lower ranks of positive NRI and NTI values compared with Thismia. We also found that the other half (Apocynaceae sp., Ceratopetalum apetalum, Beilschmiedia tawa and Pomaderris apetala) did not present a significantly clustered pattern. In conclusion, even though some green plants may also tend to target more closely related AM fungal taxa than expected by chance, in general these green plants have less specialized interactions compared with Thismia.
In this study, we tested the association between these two ecological traits (type of plant nutrition (mycoheterotrophic vs autotrophic) and phylogenetic fungal community structure) for these Thismia species and surrounding green plants. The study of fungal community structure needs to be extended to other distantly related lineages of mycoheterotrophic plants before we make generalizations about the processes shaping the fungal interactions involved in mycoheterotrophy. Moreover, understanding how the fungal communities associated with plants in general are assembled can provide us with knowledge of how belowground ecological processes influence the global distribution of plants in ecosystems.
Author contributions
S.I.F.G. and V.S.F.T.M. planned and designed the research, V.S.F.T.M. collected the samples, S.I.F.G. generated the data and performed the analysis, J.A‐G. participated in the data analysis, M.I.B. contributed to the interpretation of the results, and S.I.F.G. wrote the manuscript. All the authors commented on the final version of the paper.
Supporting information
Please note: Wiley Blackwell are not responsible for the content or functionality of any Supporting Information supplied by the authors. Any queries (other than missing material) should be directed to the New Phytologist Central Office.
Fig. S1 Map of sampling localities.
Fig. S2 Plot of the total number of OTUs against the total number of reads.
Fig. S3 Relationship between the net relatedness index and nearest taxa index.
Fig. S4 Ancestral state reconstruction of the NRI on the species‐level Thismia phylogeny.
Fig. S5 Tanglegram of the interactions between mycoheterotrophic species of Thismia and AM fungal OTUs.
Table S1 Summary of the samples used in the analysis
Table S2 Statistical results of the mixed‐effects model and multiple comparison analysis explaining the fungal communities’ phylogenetic dispersion patterns by the ‘type’ of material (mycoheterotrophic plants, green plants, and soil), using ‘region’ as a random factor
Methods S1 Plant identification.
Methods S2 Thismia phylogenetic relationships.
Acknowledgements
The authors thank Wendy Potts and Micah Visoiu (Tasmanian Department of Primary Industries, Parks, Water & Environment), Tim Wardlaw and Daniel Hodge (Forestry Tasmania), Neill Klaer, the National Parks and Wildlife Service NSW, the Blue Mountains City Council for permission to sample Thismia in Australia. We thank Cheri Van Schravendijk and Terina Rakena (Waikato Tainui), Hannah Rainforth (Ngati Rangi) and Don Robinson (Uenuku Tribal Authority) for their time and consideration in consulting with us about Thismia collection on their respective lands, and the New Zealand Department of Conservation for authorization to collect under concession number CA‐31615‐OTH. Brian French, David Mabberley, James Wood, Peter de Lange, Mark Wapstra, Colin Hunt, Greg Steenbeeke, Rob Smissen, the staff at the National Herbarium of New South Wales, and the staff of the Royal Tasmanian Botanical Gardens are thanked for their assistance. This research was supported by a Veni grant from NWO to V.S.F.T.M. (863.11.018) and by travel grants from the Alberta Mennega Foundation.
References
- Bidartondo MI. 2005. The evolutionary ecology of myco‐heterotrophy. New Phytologist 167: 335–352. [DOI] [PubMed] [Google Scholar]
- Bidartondo MI, Redecker D, Hijrl I, Wiemken A, Bruns TD, Dominguez L, Sersic A, Leake AR, Read DJ. 2002. Epiparasitic plants specialized on arbuscular mycorrhizal fungi. Nature 419: 389–392. [DOI] [PubMed] [Google Scholar]
- Blaalid R, Kumar S, Nilsson RH, Abarenkov K, Kirk PM, Kauserud H. 2013. ITS1 versus ITS2 as DNA metabarcodes for fungi. Molecular Ecology Resources 13: 218–224. [DOI] [PubMed] [Google Scholar]
- Brundrett MC. 2008. Mycorrhizal associations of Australian plants. Mycorrhizal Associations: The Web Resource. Version 2.0. [WWW document] URL http://mycorrhizas.info [accessed 22 August 2016].
- Bruns TD, Taylor JW. 2016. Comment on “Global assessment of arbuscular mycorrhizal fungus diversity reveals very low endemism”. Science 351: 826. [DOI] [PubMed] [Google Scholar]
- Chiu C‐H, Wang Y‐T, Walther BA, Chao A. 2014. An improved nonparametric lower bound of species richness via a modified good‐turing frequency formula. Biometrics 70: 671–682. [DOI] [PubMed] [Google Scholar]
- Cullings KW, Szaro TM, Bruns TD. 1996. Evolution of extreme specialization within a lineage of ectomycorrhizal epiparasites. Nature 379: 63–66. [Google Scholar]
- Darriba D, Taboada GL, Doallo R, Posada D. 2012. jModelTest 2: more models, new heuristics and parallel computing. Nature Methods 9: 772. [DOI] [PMC free article] [PubMed] [Google Scholar]
- Davison J, Öpik M, Daniell TJ, Moora M, Zobel M. 2011. Arbuscular mycorrhizal fungal communities in plant roots are not random assemblages. FEMS Microbiology Ecology 78: 103–115. [DOI] [PubMed] [Google Scholar]
- Edgar RC. 2013. UPARSE: highly accurate OTU sequences from microbial amplicon reads. Nature Methods 10: 996–998. [DOI] [PubMed] [Google Scholar]
- Felsenstein J. 1985. Phylogenies and the comparative method. American Naturalist 125: 1–15. [DOI] [PubMed] [Google Scholar]
- Gebauer G, Meyer M. 2003. 15N and 13C natural abundance of autotrophic and myco‐heterotrophic orchids provides insight into nitrogen and carbon gain from fungal association. New Phytologist 160: 209–223. [DOI] [PubMed] [Google Scholar]
- Gebauer G, Preiss K, Gebauer AC. 2016. Partial mycoheterotrophy is more widespread among orchids than previously assumed. New Phytologist 211: 11–15. [DOI] [PubMed] [Google Scholar]
- Harvey PH, Pagel MD. 1991. The comparative method in evolutionary biology. Oxford, UK: Oxford University Press. [Google Scholar]
- van der Heijden MGA, Klironomos JN, Ursic M, Moutoglis P, Streitwolf‐Engel R, Boller T, Wiemken A, Sanders IR. 1998. Mycorrhizal fungal diversity determines plant biodiversity, ecosystem variability and productivity. Nature 396: 69–72. [Google Scholar]
- van der Heijden MGA, Martin FM, Selosse M‐A, Sanders IR. 2015. Mycorrhizal ecology and evolution: the past, the present and the future. New Phytologist 205: 1406–1423. [DOI] [PubMed] [Google Scholar]
- Ihrmark K, Bödeker IT, Cruz‐Martinez K, Friberg H, Kubartova A, Schenk J, Strid Y, Stenlid J, Brandstörm‐Durling M, Clemmensen KE et al 2012. New primers to amplify the fungal ITS2 region – evaluation by 454‐sequencing of artificial and natural communities. FEMS Microbiology Ecology 82: 666–677. [DOI] [PubMed] [Google Scholar]
- Karandashov V, Bucher M. 2005. Symbiotic phosphate transport in arbuscular mycorrhizas. Trends in Plant Science 10: 22–29. [DOI] [PubMed] [Google Scholar]
- Katoh S. 2013. MAFFT multiple sequence alignment software version 7: improvements in performance and usability. Molecular Biology and Evolution 30: 772–780. [DOI] [PMC free article] [PubMed] [Google Scholar]
- Kembel SW, Cowan PD, Helmus MR, Cornwell WK, Morlon H, Ackerly DD, Blomberg SP, Webb CO. 2010. Picante: R tools for integrating phylogenies and ecology. Bioinformatics 26: 1463–1464. [DOI] [PubMed] [Google Scholar]
- Kembel SW, Hubbell SP. 2006. The phylogenetic structure of a neotropical forest tree community. Ecology 87: S86–S99. [DOI] [PubMed] [Google Scholar]
- Krüger M, Krüger C, Walker C, Stockinger H, Schüßler A. 2011. Phylogenetic reference data for systematics and phylotaxonomy of arbuscular mycorrhizal fungi from phylum to species level. New Phytologist 193: 970–984. [DOI] [PubMed] [Google Scholar]
- Leake JR. 1994. The biology of myco‐heterotrophic (‘saprophytic’) plants. New Phytologist 127: 171–216. [DOI] [PubMed] [Google Scholar]
- Leake JR, Cameron DD. 2010. Physiological ecology of mycoheterotrophy. New Phytologist 185: 601–605. [DOI] [PubMed] [Google Scholar]
- Lord J, Westoby M, Leishman M. 1995. Seed size and phylogeny in six temperate floras: constraints, niche conservatism, and adaptation. American Naturalist 146: 349–364. [Google Scholar]
- Maherali H, Klironomos JN. 2012. Phylogenetic and trait‐based assembly of arbuscular mycorrhizal fungal communities. PLoS ONE 7: e36695. [DOI] [PMC free article] [PubMed] [Google Scholar]
- McLennan EI. 1958. Thismia rodwayi F. Muell. and its endophyte. Australian Journal of Botany 6: 25–37. [Google Scholar]
- Merckx VSFT. 2013. Mycoheterotrophy. The biology of plants living on fungi. New York, NY, USA: Springer. [Google Scholar]
- Merckx V, Bidartondo MI. 2008. Breakdown and delayed cospeciation in the arbuscular mycorrhizal mutualism. Proceedings of the Royal Society of London. Series B, Biological Sciences 275: 1029–1035. [DOI] [PMC free article] [PubMed] [Google Scholar]
- Merckx VS, Janssens SB, Hynson NA, Specht CD, Bruns TD, Smets EF. 2012. Mycoheterotrophic interactions are not limited to a narrow phylogenetic range of arbuscular mycorrhizal fungi. Molecular Ecology 6: 1524–1532. [DOI] [PubMed] [Google Scholar]
- Merckx VSFT, Wapstra M. 2013. Further notes on the occurrence of fairy lanterns Thismia rodwayi F. Muell. (Thismiaceae) in Tasmania: vegetation associations. Tasmanian Naturalist 135: 71–78. [Google Scholar]
- Ogura‐Tsujita Y, Umata H, Yukawa T. 2013. High mycorrhizal specificity in the mycoheterotrophic Burmannia nepalensis and B. itoana (Burmanniaceae). Mycoscience 54: 444–448. [Google Scholar]
- Oksanen J, Blanchet FG, Kindt R, Legendre P, Minchin PR, O'Hara RB, Simpson GL, Solymos P, Stevens MHH, Wagner H. 2015. vegan: Community Ecology Package. R package v.2.3‐1. [WWW document] URL http://CRAN.R-project.org/package=vegan [accessed 20 June 2016].
- Öpik M, Metsis M, Daniell T, Zobel M, Moora M. 2009. Large‐scale parallel 454 sequencing reveals host ecological group specificity of arbuscular mycorrhizal fungi in a boreonemoral forest. New Phytologist 184: 424–437. [DOI] [PubMed] [Google Scholar]
- Paradis E, Claude J, Strimmer K. 2004. APE: analyses of phylogenetics and evolution in R language. Bioinformatics 20: 289–290. [DOI] [PubMed] [Google Scholar]
- Peay K, Baraloto C, Fine PVA. 2013. Strong coupling of plant and fungal community structure across western Amazonian rainforests. ISME Journal 7: 1852–1861. [DOI] [PMC free article] [PubMed] [Google Scholar]
- Peay K, Kennedy PG, Davies SJ, Tan S, Bruns TD. 2010. Potential link between plant and fungal distributions in a dipterocarp rainforest: community and phylogenetic structure of tropical ectomycorrhizal fungi across a plant and soil ecotone. New Phytologist 185: 529–542. [DOI] [PubMed] [Google Scholar]
- R Development Core Team . 2008. R: a language and environment for statistical computing, v.3.3.1. Vienna, Austria: R Foundation for Statistical Computing; [WWW document] URL http://www.R-project.org. [Google Scholar]
- Ramsbottom J. 1929. Orchid mycorrhiza. Proceedings of the International Congress of Plant Science 2: 1676–1687. [Google Scholar]
- Sachs JL, Simms EL. 2006. Pathways to mutualism breakdown. Trends in Ecology and Evolution 10: 585–592. [DOI] [PubMed] [Google Scholar]
- Smith SE, Read DJ. 2008. Mycorrhizal symbiosis. Amsterdam, the Netherlands, Boston, MA, USA: Academic Press. [Google Scholar]
- Stamatakis A. 2014. RAxML version 8: a tool for phylogenetic analysis and post‐analysis of large phylogenies. Bioinformatics 30: 1312–1313. [DOI] [PMC free article] [PubMed] [Google Scholar]
- Thompson JN. 2005. The geographic mosaic of coevolution. Chicago, IL, USA: University of Chicago Press. [Google Scholar]
- Toju H, Guimarães PR, Olesen JM, Thompson JN. 2014. Assembly of complex plant–fungus networks. Nature Communications 5: 5273. [DOI] [PMC free article] [PubMed] [Google Scholar]
- Vogelsang KM, Reynolds HL, Bever JD. 2006. Mycorrhizal fungal identity and richness determine the diversity and productivity of a tallgrass prairie system. New Phytologist 172: 554–562. [DOI] [PubMed] [Google Scholar]
- Webb CO. 2000. Exploring the phylogenetic structure of ecological communities: an example for rain forest trees. American Naturalist 156: 145–155. [DOI] [PubMed] [Google Scholar]
- Webb CO, Ackerly DD, McPeek MA, Donoghue MJ. 2002. Phylogenies and community ecology. Annual Review of Ecology and Systematics 33: 475–505. [Google Scholar]
- White TJ, Bruns T, Taylor JSL. 1990. Amplification and direct sequencing of fungal ribosomal RNA genes for phylogenetics In: Innis M, Gelfand D, Sininsky J, White T, eds. PCR protocols: a guide to methods and applications. San Diego, CA, USA: Academic Press, 315–332. [Google Scholar]
- Wiens JJ, Ackerly DD, Allen AP, Anacker BL, Buckley LB, Cornell HV, Damschen EI, Davies TJ, Grythnes JA, Harrison SP et al 2010. Niche conservatism as an emerging principle in ecology and conservation biology. Ecology Letters 13: 1310–1324. [DOI] [PubMed] [Google Scholar]
- Wiens JJ, Graham CH. 2005. Niche conservatism: integrating evolution, ecology, and conservation biology. Annual Review of Ecology, Evolution, and Systematics 36: 519–539. [Google Scholar]
- Yamato M, Yagame T, Shimonura N, Iwase K, Takahashi H, Ogura‐Tsujita Y, Yukawa T. 2011. Specific arbuscular mycorrhizal fungi associated with non‐photosynthetic Petrosavia sakuraii (Petrosaviaceae). Mycorrhiza 21: 631–639. [DOI] [PubMed] [Google Scholar]
Associated Data
This section collects any data citations, data availability statements, or supplementary materials included in this article.
Supplementary Materials
Please note: Wiley Blackwell are not responsible for the content or functionality of any Supporting Information supplied by the authors. Any queries (other than missing material) should be directed to the New Phytologist Central Office.
Fig. S1 Map of sampling localities.
Fig. S2 Plot of the total number of OTUs against the total number of reads.
Fig. S3 Relationship between the net relatedness index and nearest taxa index.
Fig. S4 Ancestral state reconstruction of the NRI on the species‐level Thismia phylogeny.
Fig. S5 Tanglegram of the interactions between mycoheterotrophic species of Thismia and AM fungal OTUs.
Table S1 Summary of the samples used in the analysis
Table S2 Statistical results of the mixed‐effects model and multiple comparison analysis explaining the fungal communities’ phylogenetic dispersion patterns by the ‘type’ of material (mycoheterotrophic plants, green plants, and soil), using ‘region’ as a random factor
Methods S1 Plant identification.
Methods S2 Thismia phylogenetic relationships.