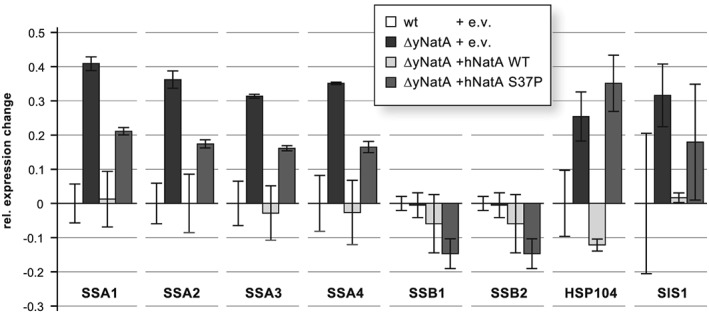
Figure 5.

Mass spectrometric analyses of the overexpressing strains. Cells growing at exponential phase were harvested and lysed and the clarified lysates were subjected to quantitative mass spectrometry. The geometric mean of the measured abundances (relative expression) and the geometric standard deviation for each protein was calculated from two independent experiments and normalized. Shown is the difference of the expression compared with the WT strain for the HSP70 chaperones Ssa1‐4, Ssb1‐2 as well as HSP104 and Sis1
