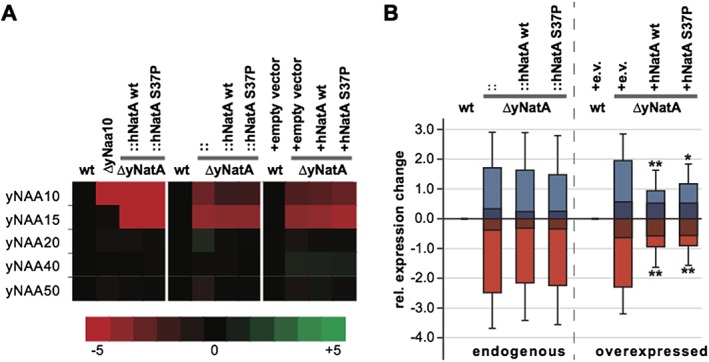
Figure 6.

Overexpression of hNatA complements the changes induced by disruption of yNatA. (A) Heat map representation of the microarray results for the Nα‐terminal acetyltransferases (NATs). (B) Shown is the average expression change (and standard deviation) of up‐ (blue) and downregulated (red) genes for the endogenous rescue strains (left) and the overexpression strains (right). The darker shades show the results for when all genes were plotted, whereas the lighter shades show only those genes whose expression was changed by at least ±1 in all knockout strains. Wilcoxon rank sum test was used to analyse whether the expression change was significantly reduced in the rescue strain when compared with the corresponding knockout. ** p < 0.001; * p < 0.05
