Abstract
The control of virulence gene expression in the human pathogen Staphylococcus aureus is under the partial control of the two-component quorum-sensing system encoded by genes of the agr locus. The product of the agrA gene has been shown by amino acid sequence similarity to be the putative response regulator; however, binding of AgrA to promoters under its control has not yet been demonstrated. In this study, we isolated and purified soluble AgrA by expression under osmotic shock conditions and ion-exchange chromatography. Purified AgrA showed high-affinity binding to the RNAIII-agr intergenic region by electrophoretic mobility shift assays. Binding was localized by DNase I protection assays to a pair of direct repeats in the P2 and P3 promoter regions of the agr locus. We found that this binding was enhanced by the addition of the small phosphoryl donor, acetyl phosphate. The difference in binding affinity between these two promoters was found to result from a 2-bp difference between the downstream direct repeats of the P2 and P3 sites. Mutation of these base pairs in the P3 site to match those found in the P2 site increased the affinity of AgrA for the P3 site relative to that for the P2 site. These results are consistent with the function of AgrA as a response regulator with recognition sites in the promoter regions of RNAIII and the agr locus.
Staphylococcus aureus is an opportunistic human pathogen responsible for a wide array of human diseases of various severities, depending on the location of the infection and the immune status of the host (16, 24). Virulence in S. aureus is largely under the regulation of two loci, sarA and agr (4, 7, 8, 9). The importance of the agr locus in virulence has been underscored in experiments that demonstrate significantly attenuated infectivity in agr-defective S. aureus. This reduction in virulence was seen in several disease models, including endophthalmitis and septic arthritis in mouse (1, 6), endocarditis in rabbit (8), and osteomyelitis in both mouse (5) and rabbit (12) models. Whereas agr mutant S. aureus can still cause pneumonia in the mouse, it was deficient in the establishment of invasive infection of the lung (14).
The agr locus was first described by Peng et al. in 1988 (23) and encodes the components of an autoregulatory quorum-sensing system that controls expression of the regulatory RNA molecule RNAIII. Components of this system include AgrD, the signaling peptide; AgrB, the secretory protein responsible for the export and processing of AgrD to its active form; and AgrC/AgrA, a two-component histidine kinase and response regulator system that detects AgrD at critical levels and initiates the expression of those virulence determinants under agr control. AgrA is a member of a family of conserved response regulators with CheY-like receiver domains. These response regulators undergo conformational changes upon the phosphorylation of an aspartate residue by the cognate sensory histidine kinase, allowing them to bind to promoter elements and upregulate transcription (reviewed in references 11 and 28). AgrA is a member of the LytR family of response regulators that recognize a novel element consisting of a pair of direct repeats (occasionally imperfect) with the consensus sequence [TA][AC][CA]GTTN[AG][TG] and separated by a 12- to 13-bp spacer region (19). Two such elements are found in the P2-P3 intergenic region of RNAIII and the agr operon (17, 18).
Whereas the agr two-component system has been assumed to follow the canonical quorum-sensing model (22), the inability to demonstrate binding of AgrA to the RNAIII-agr intergenic region led other researchers to question the identification of AgrA as a DNA-binding response regulator (18). Using purified recombinant AgrA in electrophoretic mobility shift assays (EMSAs), we demonstrated that AgrA does bind to the P2-P3 region of the agr locus with high affinity. The strongest binding was found by DNase I protection assays to be localized to the pair of direct repeats in the P2 promoter region. Surprisingly, binding to the corresponding pair of repeats in the P3 promoter region was weaker, and phosphorylation of AgrA by small phosphodonors had differential effects on binding affinity at the two sites.
MATERIALS AND METHODS
All chemicals were from Sigma Chemical, Inc., St. Louis, Mo., unless otherwise noted.
Expression and purification of AgrA.
The agrA coding region was amplified from S. aureus strain DB using primers incorporating an NdeI restriction site 5′ to the coding region and a BamHI site 3′ to the coding region. The primer sequences were CATAAGGATGTGAACATATGAAAATTTTCATTTGCGAA and CAACAAGATTTACAATTGGATCCGTCGTTAACTGACT (restriction sites are underlined). The resulting PCR product was cut with the appropriate restriction enzymes and ligated into the pET9a expression vector (Novagen Inc., Madison, Wisc.), yielding pJR1.
Recombinant AgrA expression was induced in the Escherichia coli strain BL21(DE3)pLysS. In order to overcome protein solubility problems, the host strain was grown under osmotic shock conditions (500 ml of Terrific broth containing 1 M sorbitol and 10 mM betaine in 2-liter baffled polycarbonate culture flasks) at 25°C and 120 rpm, as modified from the method of Blackwell and Horgan (3). Expression of AgrA was induced at a culture optical density at 600 nm of 0.4 to 0.6 using a final concentration of 0.4 mM IPTG (isopropyl-β-d-thiogalactopyranoside). Due to slow culture growth under these conditions, cells were collected by centrifugation (10 min at 5,000 × g and 4°C) 24 h postinduction. Cells were frozen overnight at −20°C and lysed in 10 volumes of 10 mM Tris-Cl (pH 6.8), 1 mM EDTA, 10 mM MgCl2, 5 mM dithiothreitol, 50 mM NaCl, 10% glycerol, and 1 mM phenylmethylsulfonyl fluoride on ice. Chromosomal DNA was sheared by sonication, and the insoluble debris was removed by centrifugation. The cleared lysate was applied to a Macro-Prep High Q Exchange Support column with a 10-ml bed volume (Bio-Rad, Inc., Hercules, Calif.). The flowthrough was collected and applied to a Macro-Prep High S Support column (Bio-Rad, Inc.). The column was rinsed with 2 column volumes of the buffer described above plus 250 mM NaCl and eluted with 1 column volume of buffer plus 1 M NaCl. A typical yield of soluble AgrA was approximately 0.5 to 1 mg liter of culture−1. Purified protein was stable at 4°C for at least 2 months as determined by a comparison of binding assays. The protein concentration was determined via BCA protein assay (Pierce Scientific Inc., Rockford, Ill.) against bovine serum albumin standards. The identity of the protein was confirmed by automated Edman degradation of the NH2-terminal seven amino acids (University of Louisiana Health Sciences Core Labs, New Orleans, La.).
Antibody production and Western blots.
The cells from a 500-ml Luria-Bertani culture of pJR1 in BL21(DE3)pLysS were grown at 37°C to an optical density at 600 nm of 0.4 and then subjected to induction with 1 mM IPTG for 3 h. The cells were harvested by centrifugation, frozen overnight, and then resuspended in the lysis buffer described above. The DNA was sheared by sonication, and the solution was cleared by centrifugation at 15,000 × g for 20 min at 4°C. The insoluble debris was resuspended in lysis buffer containing 7 M urea and incubated at 4°C for 2 h. An equal volume of Laemmli sample buffer was added and heated to 100°C for 10 min. The entire sample was resolved by 15% sodium dodecyl sulfate-polyacrylamide gel electrophoresis (SDS-PAGE). A small strip of the gel was stained with Gel-Code Blue (Pierce Scientific, Inc.) to reveal the location of the AgrA, which was excised, minced, and homogenized. One-sixth of the homogenate was injected into each of two New Zealand White rabbits at 2-week intervals, and a booster injection was given at 5 days prior to the final bleed-out. Conversion was tested by Western blot analysis of wild-type RN6390 versus an otherwise isogenic agrA mutant strain of S. aureus.
Ion-exchange purified soluble AgrA was resolved by 12% SDS-PAGE. In-gel visualization was made using Gel-Code Blue staining. The protein was blotted onto a polyvinylidene difluoride membrane (Bio-Rad, Inc.) and maintained overnight at 20 V in a transfer buffer containing 25 mM Tris (pH 8.2), 192 mM glycine, and 20% methanol. The membrane was incubated in a 1:5,000 solution of polyclonal rabbit anti-AgrA that had been raised against SDS-PAGE-purified AgrA inclusion bodies as described above and was developed using a Bio-Rad, Inc., immunoblot alkaline phosphatase assay kit according to the manufacturer's instructions.
DNase I protection assays.
The 180-bp DNA fragment between the −10 regions of the P2 and P3 promoters was isolated, and each strand was separately end labeled with 32P as described previously by Rechtin et al. (25). A 50 pM solution of this fragment was incubated with AgrA for 30 min at room temperature in a reaction buffer containing 10 mM HEPES (pH 7.6), 5 mM MgCl2, 1 mM CaCl2, 1 mM dithiothreitol, and 100 mM KCl, with and without 25 mM acetyl phosphate. Enough DNase I to produce approximately 50% nonnicked DNA was added, and the reaction was allowed to incubate for two additional minutes before quenching by the addition of a stop solution (0.3 M NH4OAc, 1 μg of tRNA ml−1 in 80% ethyl alcohol [EtOH]). The reaction was then precipitated in dry ice and EtOH for 20 min and centrifuged at 18,000 × g for 10 min to pellet the DNA fragments. The pellet was washed with 70% EtOH, dried, resuspended in 200 μl TE buffer (10 mM Tris-Cl [pH 8.0], 1 mM EDTA), and reprecipitated with 0.3 M NaOAc in EtOH. The resulting pellet was washed again with 70% EtOH and dried. The fragments were subjected to 6% acrylamide denaturing electrophoresis and were visualized by storage phosphorimaging using an Amersham Biosciences Storm 840 scanner. Purine sequencing (by standard chemical methods) was included in the analysis to identify regions of protection.
EMSA.
EMSAs were modified from the method of Rechtin et al. (25). The DNA fragments used included the entire agr 180-bp intergenic region described by Morfeldt et al. (18) as well as the P3 region including the heptad of direct repeats that followed the LytTR family consensus binding sequence described by Nikolskaya and Galperin (19); the sequences of the P2 and P3 isolated regions and mutations tested can be seen in Table 1. The top- and bottom-strand oligomers were synthesized and purified by denaturing polyacrylamide gel electrophoresis (IDT, Inc., Coralville, Iowa). They were end labeled with 32P, and the complementary oligomer was annealed. The resulting probe was purified by native polyacrylamide electrophoresis. Quantitative EMSA was performed to determine the dissociation constant (Kd) of binding using limiting concentrations of DNA (<25 pM). The band shifts, visualized by phosphorimaging as described in the previous paragraph, and band intensities were quantified using the ImageQuant software package from Molecular Dynamics, Inc. (Sunnyvale, Calif.). Binding models and apparent Kd values were determined using the DynaFit software for the analysis of biochemical kinetics and equilibria (BioKin, Inc., Pullman, Wash.) (15). The models tested included the following: AgrA ⇄ AgrA2 ⇄ AgrA2-DNA, AgrA2_⇄ AgrA2-DNA, and AgrA ⇄ AgrA-DNA + AgrA ⇄ AgrA2-DNA. Binding curves were plotted using Origin 6.1, Microcal Inc., Northampton, Mass.
TABLE 1.
Promoter sequences used in electrophoretic mobility shift assays
| Name | Sequence |
|---|---|
| NegCtrl | CCTGGTTGTCCTCGTCACTATGAAGAGCCTCACACACAAGGTCGTCGA |
| P2 | TACATTTAACAGTTAAGTATTTATTTCCTACAGTTAGGCAATATAATG |
| P3 | AATTTTTCTTAACTAGTCGTTTTTTATTCTTAACTGTAAATTTTT |
| P3toP2 | AATTTTTCCTAACTGTTCGTTTTTTATTCTTAACTGTAAATTTTT |
| P3AtoG | AATTTTTCCTAACTGTTCGTTTTTTATTCTTAACTGTAAATTTTT |
| P3CTtoAC | AATTTTTCTTAACTGTTCGTTTTTTATTCTTAACTGTAAATTTTT |
| P2toP3 | TTACATTTAACAGTTAAGTATTTATTTCCTCTAGTTAAGCAATATAATG |
RESULTS
Purification of soluble AgrA.
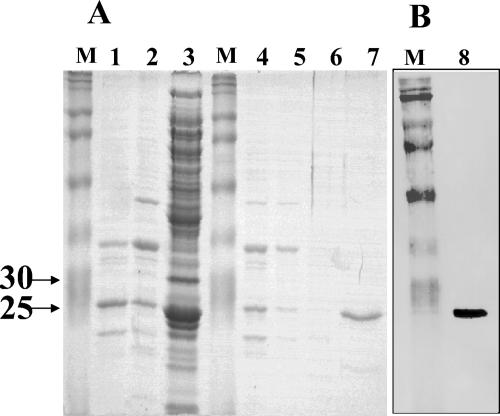
Expression of the agrA coding region from the plasmid pET9a (Novagen Inc.) under typical growth conditions yielded completely insoluble protein (2). To overcome this problem, we expressed the protein in E. coli BL21(DE3)pLysS under osmotic stress conditions (1 M sorbitol) in the presence of betaine (3). Approximately 50% of the AgrA expressed under these conditions remained in the soluble fraction (R. Koenig, unpublished data). The resultant AgrA was purified by sequential ion-exchange chromatography according to the procedure outlined in Materials and Methods. The purification sequence resulted in a single protein band at approximately 27 kDa as seen by SDS-PAGE (Fig. 1A, lane 7). The identity of purified AgrA was confirmed by comparison of the NH2-terminal seven amino acids of the purified protein with the sequence of AgrA, determined by automated Edman degradation. The identity was further confirmed by Western blot analysis of the purified protein using rabbit anti-AgrA polyclonal antibodies (Fig. 1B, lane 8).
FIG. 1.
SDS-PAGE. (A) Lane 1, Q-column flowthrough; lane 2, 50 mM NaCl wash of Q column; lane 3, 1 M NaCl elution of Q column; lane 4, S-column flowthrough; lane 5, 50 mM NaCl wash of S column; lane 6, 250 mM wash of S column; lane 7, 1 M NaCl elution of S column. (B) Lane 8, purified AgrA probed with polyclonal anti-AgrA antiserum. Lanes M contain molecular weight markers.
DNase I protection assays indicate AgrA binding to P2 and P3 direct repeats.
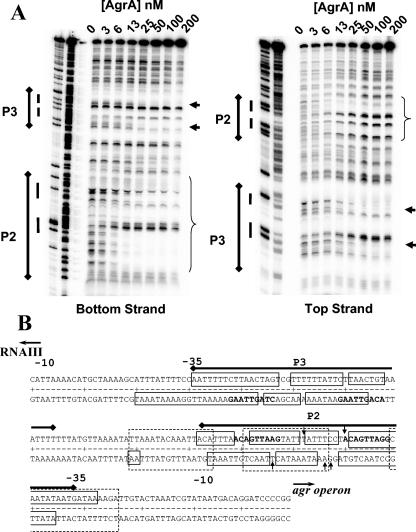
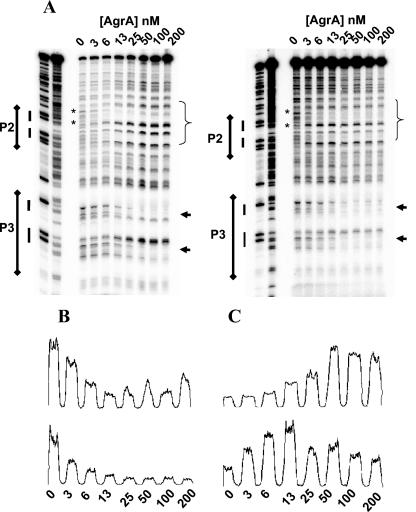
DNase protection assays of AgrA bound to the P2-P3 intergenic region showed areas of protection occurring asymmetrically over the P2 direct repeats and extending approximately to the −35 region of the P2 promoter beginning at concentrations of 6 nM AgrA (Fig. 2A). Within this region, there are 3 bp on each strand that demonstrate increased DNase I susceptibility. A footprint was also seen at the P3 region encompassing the direct repeats starting at AgrA concentrations of 25 nM (Fig. 2A). The sequences of the protected areas are shown in Fig. 2B. Addition of 25 mM acetyl phosphate increased the affinity of AgrA for the P2 region, as evidenced by the appearance of the footprint and hypersensitive bases at lower concentrations of AgrA, but it did not change the location of the protected area (Fig. 3A). The change was further illustrated by an examination of the density profiles of representative protected and hypersensitive bands (Fig. 3B and C).
FIG. 2.
(A) DNase I protection assay of increasing concentrations of AgrA against the RNAIII-agr intergenic region (50 pM) without acetyl phosphate. Areas of DNase I protection are indicated by the brackets (P2) and arrows (P3) to the right of the assay lanes. Paired direct repeats in the P2 and P3 promoter regions are indicated by the side bars to the left of the assay lanes. (B) Sequence of the RNAIII-agr intergenic region. The locations of the P2 and P3 promoter regions are indicated by the solid bars above the sequence. SarA-protected areas determined by Rechtin et al. (25) are shown by the dotted-line boxes. The direct repeats conforming to the consensus LytTR recognition sites are indicated in bold type. Protected areas of the P2-P3 promoter region are represented by solid boxes. The approximate locations of residues showing increased sensitivity to DNase I cleavage upon AgrA binding are indicated by vertical arrows.
FIG. 3.
(A) DNase I protection assay of increasing concentrations of AgrA against the RNAIII-agr intergenic region (50 pM) with (right) and without (left) 25 mM acetyl phosphate. Areas of DNase I protection are indicated as in Fig. 2. (B) Density profiles of the selected protected bands indicated by asterisks in panel A (top, without acetyl phosphate; bottom, with 25 mM acetyl phosphate). (C) Density profiles of the hypersensitive bands indicated by arrows in panel A (top, without acetyl phosphate; bottom, with 25 mM acetyl phosphate). For panels B and C, counts (y axis) are plotted against [Agr] nM (x axis).
AgrA binds to the P2 promoter region with a higher affinity than the P3 region.
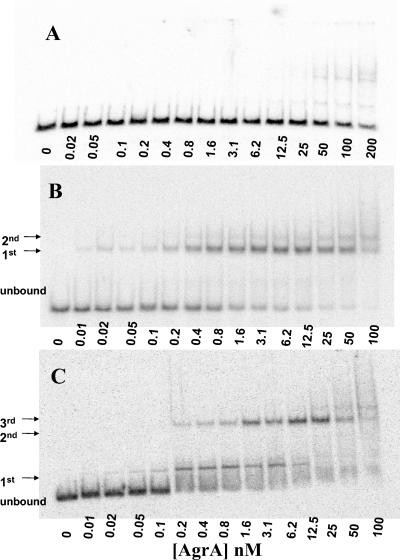
EMSAs were conducted with each of the two candidate regions from the P2-P3 fragment identified by DNase I footprint analysis containing the paired heptad of repeats shown at the top of Fig. 2 (18). The radioactivity present was quantified by phosphorimaging, and the resulting data were fit to various binding models of AgrA-DNA interaction. In the presence of the small phosphodonor, acetyl phosphate (50 mM), the EMSA against the isolated P2 region at low concentrations of DNA (10 pM) demonstrated two protein-DNA complexes (Fig. 4B), a major binding event, followed by a minor shift, likely too small to represent a second binding event. These shifts were not seen in a 48-base-pair negative control fragment (Fig. 4A). The best-fit binding model was determined to be AgrA2 ⇄ AgrA2-DNA, representing the major shift only, with a Kd of 0.16 ± 0.03 nM.
FIG. 4.
(A) EMSA demonstrating binding of AgrA to a negative control fragment (described in Table 2). (B and C) EMSA demonstrating binding of AgrA to an isolated pair of direct repeats located at P2 in the agr intergenic region in the presence (B) and absence (C) of 50 mM acetyl phosphate. A 10 pM probe was used in each experiment with concentrations of AgrA increasing as shown.
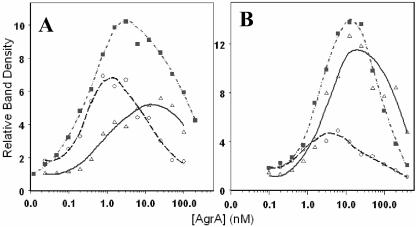
When the EMSA was performed using the P2 fragment without acetyl phosphate, three protein-DNA complexes were seen (Fig. 4C). The complexes seen on the previous shifts were present, along with another, more rapidly migrating complex. The best-fit binding model was AgrA ⇄ AgrA-DNA + AgrA ⇄ AgrA2-DNA (representing the two major band shifts) and the apparent Kds of the first and second complexes were 0.23 ± 0.04 and 3.8 ± 1.6 nM, respectively. Binding curves for the P2 EMSA binding experiments, with and without acetyl phosphate, can be seen in Fig. 5A.
FIG. 5.
Curves showing binding of AgrA to isolated P2 (A) and P3 (B) repeats in the presence and absence of 50 mM acetyl phosphate. The relative band densities from the EMSA assays are plotted versus the concentration of protein (calculated as a monomer). The squares indicate the first complex formed in the presence of 50 mM acetyl phosphate. Circles and triangles indicate the first and second binding events in the absence of 50 mM acetyl phosphate. Each curve shown represents the average of results from two assays.
Similar band shift patterns were seen when the isolated P3 repeats were used as target DNA; however, the affinity of AgrA for the P3 site was significantly lower, particularly when the affinities of phosphorylated AgrA (in the presence of acetyl phosphate) for the P2 and P3 sites were compared (Table 2). In the presence of acetyl phosphate, AgrA showed a 10-fold increased affinity for the P2 site over the P3 site. Binding curves for the P3 experiments with and without acetyl phosphate are shown in Fig. 5B.
TABLE 2.
Kd values for AgrA binding to the P2 and P3 promoter constructs of the RNAIII-agr intergenic regiona
| Parameter | Values (nM) for AgrA binding to:
|
|||
|---|---|---|---|---|
| P2 without acetyl phosphate | P2 with acetyl phosphate | P3 without acetyl phosphate | P3 with acetyl phosphate | |
| Kd1 | 0.23 ± 0.04 | NA | 0.75 ± 0.05 | NA |
| Kd2 | 3.8 ± 1.6 | 0.16 ± 0.03 | 2.2 ± 0.8 | 1.7 ± 0.3 |
Kds are listed in order of increasing size of the protein/DNA complex. Data shown are averages of two determinations. NA, not applicable.
In all EMSA binding experiments, a significant overall loss of probe was observed at AgrA concentrations above 12.5 nM, as seen in the parabolic profiles of the binding curves in Fig. 5. The simplest explanation for this loss is nonspecific aggregation of protein and DNA probe above this concentration, resulting in aggregates too large to enter the gel matrix. Also apparent from the EMSA of the negative control (Fig. 4A) is the presence of nonspecific binding at AgrA concentrations of 50 nM and above. The presence of nonspecific binding at these concentrations of AgrA may affect the binding curves above 50 nM.
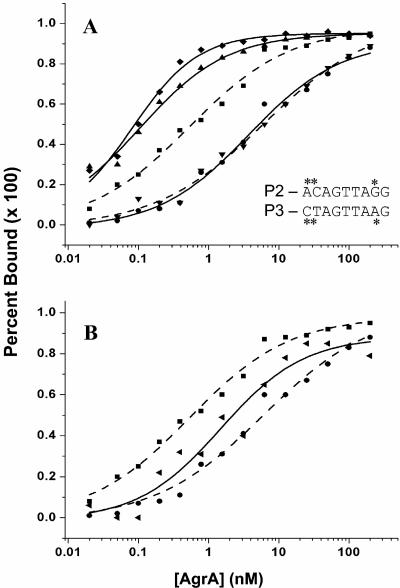
Since the P2 and P3 regions were similar but not identical, mutational analyses were performed using EMSAs to discern the contributing base pairs. The differences in affinity between the P2 and P3 promoter regions were found to be largely due to an AC-to-CT difference between P2 and P3 at positions 1 and 2 in the downstream repeat (Fig. 6). When the CT of the P3 site is converted to an AC either alone or with the concomitant A-to-G substitution at position 8, the affinity of AgrA for the P3 site exceeds that for the P2 site (Fig. 6A). This does not occur with the A-to-G substitution alone (Fig. 6A). The corresponding change in the P2 site (from AC to CT at positions 1 and 2) significantly reduces the affinity of AgrA for the P2 site, although not completely to P3 levels (Fig. 6B).
FIG. 6.
(A) Curves showing binding of AgrA to isolated P2 and P3 repeats and to P3 mutant fragments. To simplify the presentation of many variables, these binding curves represent total AgrA-DNA complex formation by measuring the disappearance of free DNA in the EMSA experiments. Binding to P2 is represented by squares and a dashed line. P3 is indicated by circles and a dashed line. The solid lines indicate binding to the P3 mutant fragments. Triangles indicate P3 with AC substituted for CT at positions 1 and 2 in the downstream repeat as shown by the asterisks. Diamonds indicate the CT-to-AT substitution, plus an A-to-G substitution at position 8. Inverted triangles indicate the A-to-G substitution at position 8 alone. (B) Curves showing binding of AgrA to isolated P2 and P3 repeats and to a P2 mutant fragment. P2 and P3 binding curves are as described above for panel A. Triangles and a solid line indicate a P2 fragment with an AC-to-CT substitution in the 1 and 2 positions and a G-to-A substitution at position 8 as indicated by the asterisks. All assays were done with 10 pM DNA concentrations in the presence of 50 mM acetyl phosphate. Each curve shown represents the average of results from two assays.
DISCUSSION
Whereas descriptions of the agr quorum-sensing system (2, 19) designate AgrA as the response regulator in a bacterial two-component sensing system, no evidence has shown binding of AgrA to promoter regions of loci suspected of being under agr control. We were able to express and purify soluble recombinant AgrA to apparent homogeneity by a two-step ion-exchange chromatography protocol, yielding enough pure protein for the purpose of conducting binding studies.
DNase I protection assays of purified AgrA to the RNAIII-agr intergenic region containing both promoters indicated that AgrA binds specifically to and protects an approximately 44-bp region of the P2 promoter region. The area of protection is centered over a pair of direct repeats that conforms to a consensus binding sequence for members of the LytTR response regulator family (19). The areas of increased sensitivity to DNase I activity noted in the footprint data occur on the same side of the DNA helix, indicating that AgrA binding occurs predominately on a single face of the DNA molecule. The presence of the hypersensitive residues may also be an indication of a distortion in the DNA helix causing curvature of the DNA toward the bound regulator. This pattern of protection and hypersensitive bases is very similar to that seen in the pln regulatory system of Lactobacillus plantarum (26), also a member of the LytTR family of response regulators. Consistent also with the putative role of AgrA as a response regulator is the proximity of the footprint with the areas of RNA polymerase contact on the noncoding strand at the −35 position. This proximity opens the possibility of close contact between AgrA and the RNAP molecule.
There is a second set of similar repeats, 1 bp different from the LytTR consensus sequence, in the P3 promoter region upstream of the regulatory RNAIII with somewhat lower affinity for AgrA. The difference in binding affinities between the P2 and P3 paired repeats was confirmed by determination of the Kds of binding at each isolated repeat through the use of EMSAs. These assays indicated that, in the presence of acetyl phosphate, binding occurred at the P2 site with an approximately 10-fold greater affinity than at the P3 site. The P2 promoter has previously been thought to be primarily under sarA regulatory control, activation of which in turn initiates agr-mediated RNAIII transcription (13), so the high-affinity binding of AgrA at the P2 site, but not at the P3 site, was somewhat surprising. A pattern search of the S. aureus N315 genome using the consensus binding site and allowing one mismatch revealed no other promoter sites that could be predicted to be under AgrA control, although previously published transcription profiling indicated widespread agr-dependent regulation (10). This finding lends support to the model of Novick et al. (20), in which RNAIII is the primary effector of virulence responses under agr control.
The stoichiometry of binding between AgrA and the P2-P3 region is uncertain because the data from the EMSAs used to evaluate binding do not differentiate between the binding of two monomers and two oligomers (in the case of the majority of response regulators, these are dimers). Data from experiments using dynamic light scattering, stoichiometric EMSA, and cross-linking to determine the primary form of AgrA present were ambiguous (Koenig, unpublished). Risøen et al. (26) encountered similar difficulties in the determination of stoichiometry in the pln system of Lactobacillus. They found that increasing the phosphorylation state through the use of small phosphodonors (i.e., acetyl phosphate) increased binding affinity but did not appear to change the oligomeric state (or the specificity) in EMSAs. Thus far, our data seem to support a change in oligomeric state and a subsequent shift in binding affinity. Observed shifts in EMSAs performed without small phosphodonors demonstrate a smaller protein-DNA complex with a low Kd that could represent binding of an AgrA monomer, a shift which disappears with the addition of acetyl phosphate. We hypothesize that this represents a monomer-dimer equilibrium because this is consistent with the majority of response regulators in this class. In the absence of small phosphodonors, the binding curve of the putative dimer is significantly shallower than that in the presence of acetyl phosphate, and the affinity of binding is also lower, indicating possible negative cooperation between the binding of two separate monomers or inhibition of dimer binding by the bound monomer.
The change in binding affinities between the phosphorylated and dephosphorylated states is less profound at the P3 site. In this case, the dimer binding curves with and without acetyl phosphate are similar, and the Kds are not significantly changed by the addition of acetyl phosphate. However, the affinity of the monomer is significantly lower at the P3 site than at the P2 site, and there is no evidence at the P3 site for the negative cooperation that was indicated by the P2 binding curves. A possible explanation for this is the two-base deviation in one of the P3 heptads from the LytTR family consensus sequence, which may adversely affect monomer binding to one of the two heptads and decrease overall affinities of both monomer and dimer to the P3 site. Mutation of these two bases from the nonconsensus CT to consensus AC (as seen in P2) results in a significantly increased affinity of AgrA for the P3 site, and the converse change in P2 lowers the affinity.
Taken together, our results are consistent with AgrA being a functional member of the LytR family of response regulators. Considering the similarities of the DNase I footprint data to those of the pln system, the weak activity at the P3 site relative to that at P2 allows some speculation regarding the differential regulation between the P2 and P3 promoters. In the pln model of control, two similar response regulators, PlnC and PlnD, bind with differential affinities to a single set of direct repeats. However, agr regulation at the RNAIII-agr intergenic region appears to involve a single response regulator, AgrA, with differential affinity for two spatially close and similar, but not identical, promoter regions. A likely model for the regulation involves binding first to the P2 promoter, resulting in autoinduction of the agr operon, including transcription and translation of AgrA. The increase in concentration of AgrA leads to transcription of RNAIII and subsequent upregulation of RNAIII-mediated virulence responses. This model is consistent with promoter-reporter fusion experiments that demonstrate a lag between activation at the P2 and P3 promoters (21).
The proximity of the AgrA binding site to known sites of SarA binding is intriguing. The areas of AgrA protection completely overlap the B2 SarA binding site and partially overlap both the B1 and C1 SarA binding sites located in the P2 promoter region (Fig. 3) (19). SarA has been shown to regulate the expression of both the agr and RNAIII operons (18) and to alter the helical conformation of the DNA in the −35 to −10 spacer region (27). How SarA and AgrA interact at the P2 site to mediate agr expression is unknown; however, the overlap of the footprints indicates that either physical displacement or physical interaction is necessary for regulation by both of these regulators at the promoter site.
Acknowledgments
This work was supported by grant AI45041 from the U.S. Public Health Service.
REFERENCES
- 1.Abdelnour, A., S. Arvidson, T. Bremell, C. Rydén, and A. Tarkowski. 1993. The accessory gene regulator (agr) controls Staphylococcus aureus virulence in a murine arthritis model. Infect. Immun. 61:3879-3885. [DOI] [PMC free article] [PubMed] [Google Scholar]
- 2.Arvidson, S., and K. Tegmark. 2001. Regulation of virulence determinants in Staphylococcus aureus. Int. J. Med. Microbiol. 291:159-170. [DOI] [PubMed] [Google Scholar]
- 3.Blackwell, J. R., and R. Horgan. 1991. A novel strategy for the production of a highly expressed recombinant protein in an active form. FEBS Lett. 295:10-12. [DOI] [PubMed] [Google Scholar]
- 4.Blevins, J., A. F. Gillaspy, T. M. Rechtin, B. K. Hurlburt, and M. S. Smeltzer. 1999. The staphylococcal accessory regulator (sar) represses transcription of the Staphylococcus aureus collagen adhesin gene (cna) in an agr-independent manner. Mol. Microbiol. 33:317-326. [DOI] [PubMed] [Google Scholar]
- 5.Blevins, J. S., M. O. Elasri, S. D. Allmendinger, K. E. Beenken, R. A. Skinner, J. R. Thomas, M. S. Smeltzer. 2003. Role of sarA in the pathogenesis of Staphylococcus aureus musculoskeletal infection. Infect. Immun. 71:516-523. [DOI] [PMC free article] [PubMed] [Google Scholar]
- 6.Booth, M. C., R. V. Atkuri, S. K. Nanda, J. J. Iandolo, and M. S. Gilmore. 1995. Accessory gene regulator controls Staphylococcus aureus virulence in endophthalmitis. Investig. Ophthalmol. Vis. Sci. 36:1828-1836. [PubMed] [Google Scholar]
- 7.Booth, M. C., A. L. Cheung, K. L. Hatter, B. D. Jett, M. C. Callegan, and M. S. Gilmore. 1997. Staphylococcal accessory regulator (sar) in conjuction with agr contributes to Staphylococcus aureus virulence in endophthalmitis. Infect. Immun. 65:1550-1556. [DOI] [PMC free article] [PubMed] [Google Scholar]
- 8.Cheung, A. L., K. J. Eberhardt, M. R. Chung, M. R. Yeaman, P. M. Sullam, and M. Ramos. 1994. Diminished virulence of sar−/agr− mutant of Staphylococcus aureus in the rabbit model of endocarditis. J. Clin. Investig. 94:1815-1822. [DOI] [PMC free article] [PubMed] [Google Scholar]
- 9.Chien, Y.-T, and A. L. Cheung. 1998. Molecular interactions between two global regulators, sar and agr, in Staphylococcus aureus. J. Biol. Chem. 273:2645-2652. [DOI] [PubMed] [Google Scholar]
- 10.Dunman, P. M., E. Murphy, S. Haney, D. Palacios, G. Tucker-Kellogg, S. Wu, E. L. Brown, R. J. Zagursky, D. Shlaes, and S. J. Projan. 2001. Transcription profiling-based identification of Staphylococcus aureus genes regulated by the agr and/or sarA loci. J. Bacteriol. 183:7341-7353. [DOI] [PMC free article] [PubMed] [Google Scholar]
- 11.Foussard, M., S. Cabantous, J.-D. Pédelacq, V. Guillet, S. Tranier, L. Mourey, C. Birck, and J.-P. Samama. 2001. The molecular puzzle of two-component signalling cascades. Microbes Infect. 3:417-424. [DOI] [PubMed] [Google Scholar]
- 12.Gillaspy, A. F., S. G. Hickmon, R. A. Skinner, J. R. Thomas, C. L. Nelson, and M. S. Smeltzer. 1995. Role of the accessory gene regulator (agr) in pathogenesis of staphylococcal osteomyelitis. Infect. Immun. 63:3373-3380. [DOI] [PMC free article] [PubMed] [Google Scholar]
- 13.Heinrichs, J. H., M. G. Bayer, and A. L. Cheung. 1996. Characterization of the sar locus and its interaction with agr in Staphylococcus aureus. J. Bacteriol. 178:418-423. [DOI] [PMC free article] [PubMed] [Google Scholar]
- 14.Heyer, G., S. Saba, R. Adamo, W. Rush, G. Soong, A. Cheung, and A. Prince. 2002. Staphylococcus aureus agr and sarA functions are required for invasive infection but not inflammatory responses in the lung. Infect. Immun. 70:127-133. [DOI] [PMC free article] [PubMed] [Google Scholar]
- 15.Kuzmic, P. 1996. Program DYNAFIT for the analysis of enzyme kinetic data: application to HIV proteinase. Anal. Biochem. 237:260-273. [DOI] [PubMed] [Google Scholar]
- 16.Lowy, F. D. 1998. Staphylococcus aureus infections. N. Engl. J. Med. 339:520-532. [DOI] [PubMed] [Google Scholar]
- 17.Morfeldt, E., I. Panova-Sapundjieva, B. Gustafsson, and S. Arvidson. 1996. Detection of the response regulator AgrA in the cytosolic fraction of Staphylococcus aureus by monoclonal antibodies. FEMS Microbiol. Lett. 143:195-201. [DOI] [PubMed] [Google Scholar]
- 18.Morfeldt, E., K. Tegmark, and S. Arvidson. 1996. Transcriptional control of the agr-dependent virulence gene regulator, RNAIII, in Staphylococcus aureus. Mol. Microbiol. 21:1227-1237. [DOI] [PubMed] [Google Scholar]
- 19.Nikolskaya, A. N., and M. Y. Galperin. 2002. A novel type of conserved DNA-binding domain in the transcriptional regulators of the AlgR/AgrA/LytR family. Nucleic Acids Res. 30:2453-2459. [DOI] [PMC free article] [PubMed] [Google Scholar]
- 20.Novick, R. P., H. F. Ross, S. J. Projan, J. Kornblum, B. Kreiswirth, and S. Moghazeh. 1993. Synthesis of staphylococcal virulence factors is controlled by a regulatory RNA molecule. EMBO J. 12:3967-3975. [DOI] [PMC free article] [PubMed] [Google Scholar]
- 21.Novick, R. P., S. J. Projan, J. Kornblum, H. F. Ross, G. Ji, B. Kreiswirth, S. Vandenesch, and S. Moghazeh. 1995. The agr P2 operon: an autocatalytic sensory transduction system in Staphylococcus aureus. Mol. Gen. Genet. 248:446. [DOI] [PubMed] [Google Scholar]
- 22.Novick, R. P. 2003. Autoinduction and signal transduction in the regulation of staphylococcal virulence. Mol. Microbiol. 48:1429-1449. [DOI] [PubMed] [Google Scholar]
- 23.Peng, H. L., R. P. Novick, B. Kreiswirth, J. Kornblum, and P. Schlievert. 1988. Cloning, characterization, and sequencing of an accessory gene regulator (agr) in Staphylococcus aureus. J. Bacteriol. 170:4365-4372. [DOI] [PMC free article] [PubMed] [Google Scholar]
- 24.Projan, S. J., and R. P. Novick. 1997. The molecular basis of pathogenicity, p. 55-81. In K. B. Crossley and G. L. Archer (ed.), The staphylococci in human disease. Churchill Livingstone, New York, N.Y.
- 25.Rechtin, T. M., A. F. Gillaspy, M. A. Schumacher, R. G. Brennan, M. S. Smeltzer, and B. K. Hurlburt. 1999. Characterization of the SarA virulence gene regulator of Staphylococcus aureus. Mol. Microbiol. 33:307-316. [DOI] [PubMed] [Google Scholar]
- 26.Risøen, P. A., O. Johnsborg, D. B. Diep, L. Hamoen, G. Venema, and I. F. Nes. 2001. Regulation of bacteriocin production in Lactobacillus plantarum depends on a conserved promoter arrangement with consensus binding sequence. Mol. Gen. Genet. 265:198-206. [DOI] [PubMed] [Google Scholar]
- 27.Schumacher, M. A., B. K. Hurlburt, and R. G. Brennan. 2001. Crystal structures of SarA, a pleiotropic regulator of virulence genes in S. aureus. Nature 409:215-219. [DOI] [PubMed] [Google Scholar]
- 28.West, A. H., and A. M. Stock. 2001. Histidine kinases and response regulator proteins in two-component signalling systems. Trends Biochem. Sci. 26:369-376. [DOI] [PubMed] [Google Scholar]


