Publisher's Note: There is an Inside Blood Commentary on this article in this issue.
Key Points
Temporal profiles of >4000 phosphopeptides after stimulating human platelets (a) with ADP and (b) consecutively with ADP and Iloprost.
Reciprocal phosphorylation profiles of ADP and Iloprost point to central players of platelet homeostasis.
Abstract
Adenosine diphosphate (ADP) enhances platelet activation by virtually any other stimulant to complete aggregation. It binds specifically to the G-protein–coupled membrane receptors P2Y1 and P2Y12, stimulating intracellular signaling cascades, leading to integrin αIIbβ3 activation, a process antagonized by endothelial prostacyclin. P2Y12 inhibitors are among the most successful antiplatelet drugs, however, show remarkable variability in efficacy. We reasoned whether a more detailed molecular understanding of ADP-induced protein phosphorylation could identify (1) critical hubs in platelet signaling toward aggregation and (2) novel molecular targets for antiplatelet treatment strategies. We applied quantitative temporal phosphoproteomics to study ADP-mediated signaling at unprecedented molecular resolution. Furthermore, to mimic the antagonistic efficacy of endothelial-derived prostacyclin, we determined how Iloprost reverses ADP-mediated signaling events. We provide temporal profiles of 4797 phosphopeptides, 608 of which showed significant regulation. Regulated proteins are implicated in well-known activating functions such as degranulation and cytoskeletal reorganization, but also in less well-understood pathways, involving ubiquitin ligases and GTPase exchange factors/GTPase-activating proteins (GEF/GAP). Our data demonstrate that ADP-triggered phosphorylation occurs predominantly within the first 10 seconds, with many short rather than sustained changes. For a set of phosphorylation sites (eg, PDE3ASer312, CALDAG-GEFISer587, ENSASer109), we demonstrate an inverse regulation by ADP and Iloprost, suggesting that these are central modulators of platelet homeostasis. This study demonstrates an extensive spectrum of human platelet protein phosphorylation in response to ADP and Iloprost, which inversely overlap and represent major activating and inhibitory pathways.
Introduction
In circulating platelets, the equilibrium between activation and inhibition pathways is well balanced to prevent uncontrolled platelet aggregation in the absence of vascular damage or injury. Upon vascular lesion, defined partly platelet-derived stimuli can shift this equilibrium toward activation within seconds.
Adenosine diphosphate (ADP), rapidly released by activated platelets1 and also present in plasma in low amounts1 derived from cellular adenosine triphosphate (ATP) (erythrocytes, endothelial cells), enhances platelet activation by virtually any other stimulant to complete platelet aggregation and thrombus formation.2 It binds specifically to the G-protein–coupled receptors P2Y1 and P2Y12,3 stimulating intracellular phosphorylation-based pathways via the G-proteins Gqα and Giα, respectively. Whereas Gqα activates phospholipase Cβ (PLCβ) and calcium-dependent Rac signaling,4 Giα inhibits cAMP production, leading to impaired protein kinase A (PKA) activity. Moreover, Giβγ also stimulates phosphoinositide 3-kinases and subsequent phosphorylation pathways required for integrin activation.5 PLC isoforms hydrolyze the second messenger 1-phosphatidylinositol 4,5-bisphosphate (PIP2) to inositol 1,4,5-trisphosphate (IP3) and diacylglycerol (DAG),3 which activate downstream signaling, mainly through protein kinase C (PKC/PRKC) and calcium sequestration from intracellular stores. Inhibitors of the ADP receptor P2Y12 (eg, clopidogrel and prasugrel metabolites) are among the most successful antiplatelet drugs.6,7 They are considered the best available medication for preventing severe incidents during angiography, but also as secondary prophylaxis after cardiovascular events. However, these drugs show remarkable variability regarding efficacy, ranging from deficient metabolism of the prodrug, to incomplete receptor or signaling inhibition.8-10
We reasoned that a more detailed molecular understanding of ADP-induced protein phosphorylation can help to identify critical hubs and sensitive components of the signaling networks governing aggregation, secretion, and other responses, as well as novel molecular targets for antiplatelet treatment strategies. Quantitative phosphoproteomics has a great potential to elucidate cellular signaling cascades,11 even when applied to study primary tissues.9,12,13 Here, we used quantitative mass spectrometry (MS) to study temporal phosphorylation patterns in human platelets (1) after stimulation with ADP; and, to mimic the antagonistic efficacy of endothelial-derived prostacyclin, (2) after consecutive stimulation with ADP and Iloprost. We provide temporal profiles for 4797 phosphorylated peptides, 608 of which (from 393 proteins) showed significant regulation. Among those, some participate in well-established activating functions such as degranulation and cytoskeletal reorganization, whereas others contribute to less well-understood pathways.
Methods
Platelet isolation and stimulation
Fresh blood was obtained from healthy volunteers who had not received any medication for 2 weeks, according to the declaration of Helsinki and approval by the ethics committee of the University of Würzburg (study numbers 67/92 and 114/04). Whole-blood collection and platelet isolation were performed as described previously.14 Platelet preparations were 99.999% pure, contamination with erythrocytes and leukocytes were <1/104 platelets and 1/106 platelets. Each platelet preparation (biological triplicates) was split into 4 aliquots. For temporal ADP profiles, aliquots were stimulated with 20 µM of ADP for 10, 30, or 60 seconds, or remained unstimulated. Additionally, to study changes reversed by Iloprost, platelet preparations (biological triplicates) were split as follows: (1) unstimulated control; (2) 20 µM ADP for 30 seconds; (3) 20 µM ADP for 30 seconds followed by 2 nM Iloprost for 30 seconds; and (4) 20 µM ADP for 30 seconds followed by 2 nM Iloprost for 60 seconds. Owing to the lower sensitivity of methods other than LaSca, the ADP concentration had to be increased for improved reproducibility. In all cases, signaling events were stopped by addition of lysis buffer (50 mM tris[hydroxymethyl] aminomethane, 1% sodium dodecyl sulfate [SDS], 150 mM NaCl, 1 tablet PhosStop/10 mL, pH 7.8). Lysed samples were immediately shock-frozen in liquid nitrogen and stored at −80°C until further usage.
Quantitative (phospho)proteomics
Sample preparation, including proteolytic digestion15,16 and quality control,17 are detailed in the supplemental Methods, available on the Blood Web site. Per donor and experiment, 100 µg of platelet digest were iTRAQ 4plex–labeled, 4 time points were pooled, and phosphopeptides were enriched using TiO2 followed by fractionation using hydrophilic interaction liquid chromatography18 and nano-LC-MS/MS analysis on Q Exactive (Thermo Scientific). Further details are given in the supplemental Methods. Raw data and Proteome Discoverer results can be accessed via ProteomeXchange19 (PXD001189).
Aggregation measurements
Platelet shape change and aggregation were analyzed by quantification of angle-dependent changes in scattered light intensity.20 Briefly, platelet-rich plasma was diluted in 6 mL of modified N-2-hydroxyethylpiperazine-N′-2-ethanesulfonic acid (HEPES) buffer (pH 7.4, osmolarity 302 mOsm, containing 140 mM NaCl, 10 mM HEPES, 10 mM NaHCO3, 2 mM KCl, 1 mM MgCl2, 2 mM CaCl2, 5.5 mM d-glucose) at a count of 1 × 10⁷ platelets/mL. After 2 minutes of constant basal signal, platelets were stimulated by ADP and Iloprost at indicated concentrations, and data were recorded for another 10 minutes. Platelet aggregation was monitored at a scatter angle of 1° to the laser beam and platelet shape change at an angle of 12°.
Western blot analysis
Washed platelets were stimulated with 20 µM of ADP (1 minute), 2 nM Iloprost (1 minute), or a combination thereof. SDS loading buffer was immediately added and proteins separated by SDS–polyacrylamide gel electrophoresis. Separated proteins were transferred to a nitrocellulose membrane, blocked with 3% milk in Tris-buffered saline/0.1% Tween and incubated with primary antibodies against phospho-GRP2Ser587 (CalDAG-GEFI; ImmunoGlobe, Himmelstadt, Germany), phospho-VASPSer157, phospho-VASPSer239 (both Nanotools, Teningen, Germany), phospho-PKBS473, phospho-GSK3αSer21, phospho-GSK3βSer9, phospho-MARKSSer159/Ser162, phospho-p38Thr180/Tyr182, phospho-ERKThr202/Tyr204, phospho-MLC2Thr18/Ser19 (all Cell Signaling, Frankfurt am Main, Germany) overnight at 4°C. For visualization, goat anti-rabbit or anti-mouse IgG conjugated with horseradish peroxidase were used as secondary antibodies followed by ECL detection (Amersham, Pharmacia Biotech).
Rap1-GTP pull-down
Human platelets (3 × 10⁸/mL) were stimulated with ADP (10 µM, 1 minute), Iloprost (2 nM, 1 minute), or with Iloprost after ADP stimulation (2 nM, 1 minute). After stimulation, platelets were lysed and Rap1-GTP was precipitated using GST-RalGDS-RBD–coupled Sepharose beads. Before pull-down, 50 µL of the lysate was removed for analysis of the total proteins. The pull-down and total lysate were analyzed by western blot with Rap1-specific antibody (Cell Signaling).
Results
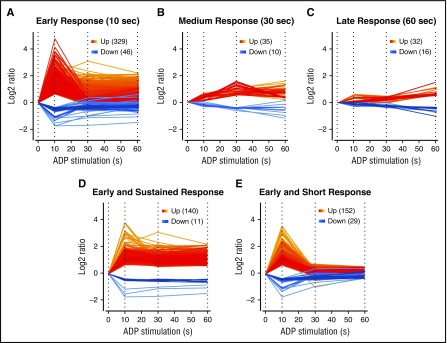
After ADP stimulation, we quantified 3952 phosphopeptides from 1600 unique proteins, representing one third of the platelet proteome.21 Of these, 436 phosphopeptides (302 proteins) were regulated upon stimulation with ADP (99% confidence in ≥2 biological replicates or ≥twofold regulation in one). Remarkably, most regulated phosphorylation sites showed an early response already after 10 seconds of stimulation (375 sites/253 proteins), whereas only 45 additional sites were regulated after 30 seconds, and 48 sites after 60 seconds (Figure 1). Almost half of the early responding proteins showed a sustained upregulation/downregulation throughout the analyzed time course, whereas others reached basal levels of the control samples after 30 seconds (Figure 1).
Figure 1.
Phosphorylation response to ADP stimulation. Phospho-peptides classified in (A) early, (B) medium, and (C) late signals after ADP treatment of 10 seconds, 30 seconds, and 60 seconds. Early responders were further classified into (D) sustained and (E) short signals.
Different response of regulated biological pathways to ADP stimulation
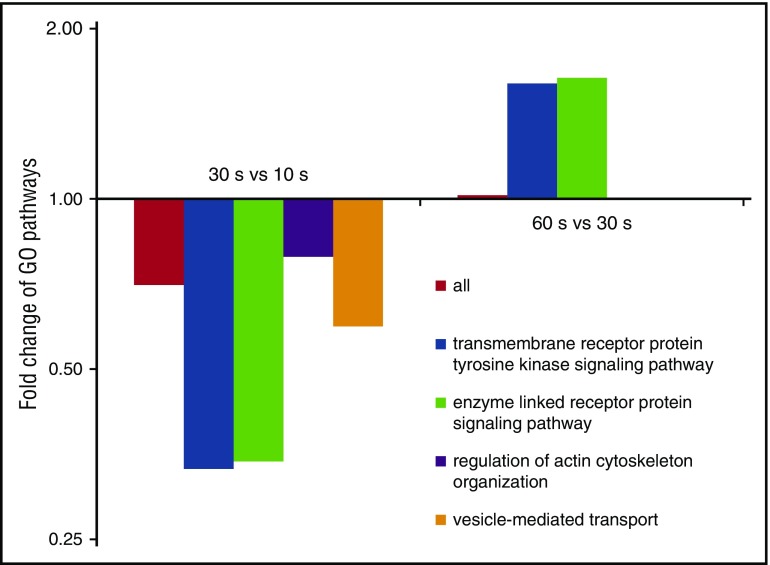
To identify biological pathways involved in the dynamic phosphorylation changes, we looked for GO-terms22 enriched at specific time points using STRING.23 In accordance with current knowledge, terms related to actin and the cytoskeleton were predominant. For most pathways, regulation peaked after 10 seconds and decreased over time (Figure 2), whereas “transmembrane receptor protein tyrosine kinase signaling” and “enzyme-linked receptor protein signaling” clearly deviated from this trend. Again, regulation peaked at 10 seconds, however, followed by a strong decrease after 30 seconds and, strikingly, another increase after 60 seconds of ADP stimulation (Figure 2). This might reflect two waves of protein kinase/phosphatase activity: an early phase of ADP-receptor–dependent stimulation (first 10 seconds) and a later phase depending on outside-in integrin signaling.
Figure 2.
Pathways show differential patterns of phospho-regulation. Per time point, regulated phosphoproteins were analyzed for enriched GO-terms, which mainly show a similar trend: (1) strong regulation after 10 s, (2) followed by a clearly reduced regulation over time. The pathways “transmembrane receptor protein tyrosine kinase signaling” and “enzyme linked receptor protein signaling” clearly deviated from this pattern, showing a second strong phase of regulation at 60 seconds.
Substantial regulation of protein kinases and phosphatases
Among 302 ADP-regulated phosphoproteins were 33 kinases (>60 kinases found phosphorylated in total), mainly members of the STE (10), CAMK (8), AGC (5), and TK (4) families. This reflects the involvement of the MAPK cascade (STE), calcium-based regulation (CAMK), intracellular signaling mediated by cyclic nucleotides, phospholipids and calcium (AGC), and tyrosine phosphorylation (TK). Moreover, we found changes in 6 Tyr-phosphatases and 3 regulatory subunits. We grouped differential kinase and phosphatase phosphorylation sites as early (10 seconds ADP), medium (30 seconds), and late (60 seconds) responses (Table 1). Seven protein kinases were regulated on multiple sites; PKC δ (PRKCD) at 4 sites, three of those (Ser130, Thr218, Ser304) after 10 seconds and an additional one (Thr43) after 30 seconds of ADP stimulation. Interestingly, PKC δ has recently been identified as a negative regulator of platelet aggregation and thrombus formation.24 PAK2 and STK4/MST1 showed regulation after 10 seconds and at additional phosphorylation sites after 30 seconds. Four Tyr-kinases, namely SYK (↑30ADP), JAK3 (↑10ADP), TNK2/ACK (↑10ADP), and BTK (↑10ADP), were regulated.
Table 1.
ADP-regulated kinases and Tyr-phosphatases
| Early kinases (10 s) | ||||
|---|---|---|---|---|
| Family | Uniprot | Gene (alternative) | Site | Regulation |
| AGC | Q05655 | PRKCD (PKDCδ) | Ser130 | ↑10ADP |
| Thr218 | ↑10ADP | |||
| Ser304 | ↑10ADP | |||
| AGC | Q04759 | PRKCQ (PKCθ) | Thr219 | ↑10ADP |
| Ser685 | ↑10ADP | |||
| AGC | Q13464 | ROCK1 | Ser1341 | ↑10ADP |
| AGC | O75116 | ROCK2 | Ser1374 | ↑10ADP |
| AGC | P23443 | RPS6KB1 (p70S6K) | Ser427 | ↑10ADP |
| CAMK | O60229 | KALRN (TRAD) | Ser1896 | ↑10ADP |
| Ser2261 | ↓10ADP | |||
| Ser1756+1757 | ↑10ADP | |||
| CAMK | P49137 | MAPKAPK2 | Thr334 | ↑10ADP |
| CAMK | Q9BUB5 | MKNK1 (MNK1) | Thr385 | ↑10ADP |
| CAMK | Q7KZI7 | MARK2 | Thr596 | ↑10ADP |
| CAMK | Q15746 | MYLK (smMLCK) | Ser1760 | ↑10ADP |
| Ser1776/Ser1779 | ↑10ADP | |||
| CAMK | Q13555 | CAMK2G | Thr287 | ↑10ADP |
| Thr306 | ↑10ADP | |||
| Ser311 | ↑10ADP | |||
| CK1 | P0C1S8 | WEE2 (WEE1B) | Ser139 | ↑10ADP |
| CMGC | O94921 | CDK14 (PFTAIRE1) | Ser24 | ↑10ADP |
| STE | O94804 | STK10 (LOK) | Ser454 | ↑10ADP |
| STE | Q13043 | STK4 (MST1) | Ser414 | ↑10ADP |
| Ser438 | ↑10ADP | |||
| STE | Q99683 | MAP3K5 (ASK) | Ser1033 | ↑10ADP |
| Ser1240 | ↑10ADP | |||
| Ser1029+Ser1033 | ↑10ADP | |||
| STE | Q13177 | PAK2 | Ser19/Ser20 | ↑10ADP |
| TK | P52333 | JAK3 | Ser15/17/20/Thr21 | ↑10ADP |
| TK | Q06187 | BTK | Thr184 | ↑10ADP |
| TK | Q07912 | TNK2 (ACK) | Thr517/Tyr518 | ↑10ADP |
| TKL | Q8IVT5 | KSR1 | Thr268+Thr272 | ↓10ADP |
| Q8TD19 | NEK9 | Thr333 | ↑10ADP | |
| Q9H4A3 | WNK1 | Ser1261 | ↓10ADP | |
| Medium (30 s) and late kinases (60 s) | ||||
|---|---|---|---|---|
| Family | Uniprot | Gene (alternative) | Site | Regulation |
| AGC | Q05655 | PRKCD (PKCδ) | Thr43 | ↑30ADP |
| CAMK | Q9Y2K2 | SIK3 (QSK) | Ser568 | ↓30ADP |
| CAMK | Q9UEW8 | STK39 (PASK) | Ser385 | ↓30ADP |
| STE | Q13043 | STK4 (MST1) | Thr340 | ↑60ADP |
| STE | Q7L7X3 | TAOK1 (TAO1) | Thr440 | ↑30ADP |
| STE | Q9UKE5 | TNIK (ZC2) | Thr903 | ↑60ADP |
| STE | Q13233 | MAP3K1 (MEKK1) | Thr20 | ↓60ADP |
| STE | Q8N4C8 | MINK1 (MINK/ZC3) | Ser701 | ↓60ADP |
| STE | Q9Y4K4 | MAP4K5 (KHS1) | Thr168 | ↑60ADP |
| STE | O95747 | OXSR1 (OSR1) | Ser359 | ↓60ADP |
| STE | Q13177 | PAK2 | Ser197 | ↑30ADP |
| TK | P43405 | SYK | Ser297 | ↑30ADP |
| TKL | P15056 | BRAF | Ser151 | ↓60ADP |
| Tyrosine phosphatases | |||
|---|---|---|---|
| Uniprot | Gene | Site | Regulation |
| Q05209 | PTPN12 | Thr454 | ↓10ADP |
| Q99952 | PTPN18 | Ser341 | ↑10ADP |
| Q8WYL5 | SSH1 | Ser897 | ↑10ADP |
| Q8TE77 | SSH3 | Ser37 | ↑10ADP |
| Q8TF42 | UBASH3B | Thr106 | ↑10ADP |
| Regulatory subunits of phosphatases | |||
|---|---|---|---|
| Uniprot | Gene | Site | Regulation |
| O14974 | PPP1R12A | Ser478/Ser479 | ↑10ADP |
| Ser903 | ↑60ADP | ||
| O95685 | PPP1R3D | Ser25 | ↑10ADP |
| Q96SB3 | PPP1R9B | Ser99/Ser100 | ↑10ADP |
Kinase phosphorylation sites were grouped into early (10 seconds), medium (30 seconds), and late (60 seconds) responders. ↑10ADP corresponds to upregulation after 10 seconds of ADP stimulation. Involvement of Tyr-phosphatases and regulatory subunits are summarized. If no specific phosphorylation Ser/Thr/Tyr residue could be assigned (eg, JAK3), all possible phospho-residues are listed.
Analyzing upregulated sites for the enriched occurrence of consensus motifs did not indicate particular protein kinases, probably owing to both a broad spectrum of involved kinases and inconclusive/overlapping kinase motifs.
Modulation of ADP-induced phosphorylation by Iloprost
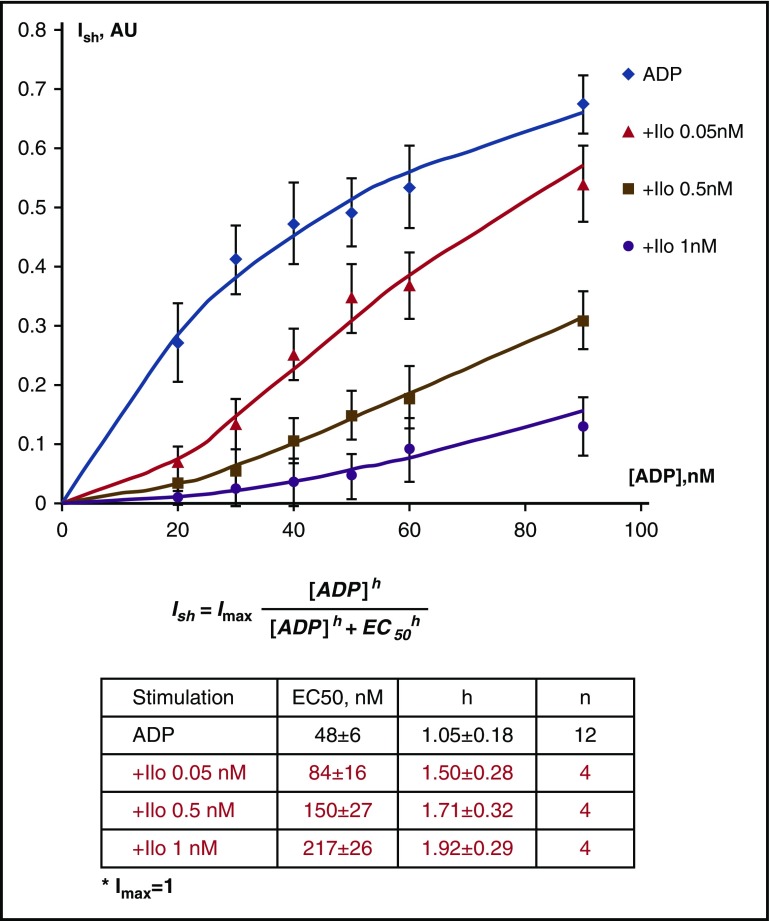
We wondered which phosphorylation changes induced by ADP can be reversed by prostacyclin. Initial functional experiments evaluating the ability of Iloprost to reverse ADP-induced platelet shape change and aggregation were performed using the recently established LaSca method,20 which allows independent and simultaneous detection of shape change and aggregation (supplemental Figure 1). This indicated that shape change peaked at 90 nM ADP, which was completely inhibited by 1 nM Iloprost (SF 1A). Nonlinear regression analysis revealed a Ki value of 0.035 ± 0.005 nM (SF 1C). Maximal platelet aggregation was achieved with 800 nM ADP, again completely inhibited by 1 nM Iloprost (SF 1D). The Ki value for inhibition by Iloprost was 0.053 ± 0.008 nM and calculated as described.20 These data indicate 2 effects of Iloprost on ADP-stimulated shape change: (1) a dose-dependent right shift of the dose-response curve for ADP stimulation, and (2) a dose-dependent increase of the hill-slope indicating effects on signal transduction pathways (Figure 3).
Figure 3.
Dose-dependent aggregometry data for ADP-induced platelet shape change at different Iloprost concentrations. The half-maximal ADP concentration for platelet shape change increased from 48 nM to 217 nM in the presence of 1 nM Iloprost, whereas the Hill-slope of the dose-response curve increased from 1.05 to 1.92 (means of 4 independent experiments ± standard deviation). Hill coefficients were calculated by nonlinear regression analysis of the raw data.
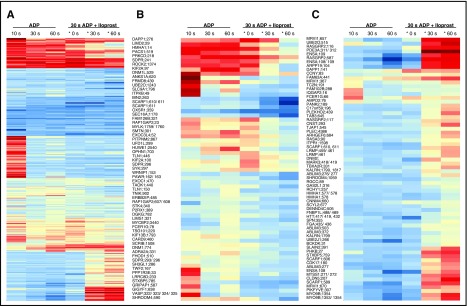
Next, in an additional quantitative phosphoproteomics experiment we compared (1) platelets in resting state, (2) platelets stimulated with 20 µM of ADP for 30 seconds, and (3) subsequently treated with 2 nM Iloprost for 30 seconds or (iv) 60 seconds. Here, we quantified a total of 3101 phosphopeptides, corresponding to 3568 phosphorylation sites from 1441 unique proteins, 224 of which were differentially phosphorylated. We compared all regulated phosphorylation sites consistently quantified in both datasets (ie, the sole ADP time series and the ADP+Iloprost time series [368 proteins]) and classified them into 3 categories: (1) sites on which Iloprost treatment had no effect; and sites where Iloprost led to (2) reduced or (3) increased phosphorylation, the latter containing putative PKA targets (Figure 4). We focused on sites that showed a particularly strong and/or immediate Iloprost-dependent deviation from the ADP temporal profile because these might comprise critical processes that are reversed upon platelet deactivation, indicating potential candidates for assessing the overall platelet activation status (eg, from patients receiving antipurinergic receptor medication). As expected, primarily sites within PKA consensus motifs were upregulated upon Iloprost treatment, among those CLDN5Thr207, ENSASer109, MYO9BSer1354, SLAIN2Ser391, UBE20Ser515, MRVI1/IRAG657, ARPP19Ser104, PDE3AThr311/Ser312, STXBP5Ser759, and CALDAG-GEFISer587. In contrast, ROCK2Ser1374, SCARFSer610/611, DAPP1Ser274, FLNASer1976, SSFASer1055, TC2NSer83/Tyr84, TMSB4XThr34, CAMK2DSer315/Ser319, MYCTSer114, MYCTSer117, and ASAP1Ser910 showed a strong downregulation. This indicates that particularly the following critical events are triggered: (1) cytoskeletal rearrangement is reversed (MYO9B, SLAIN2, ROCK2, FLNA, SSFA2, TMSB4X); (2) the further release of granules may be altered (ENSA and ARPP19 both interact with SNCA and phosphorylation of ENSASer109 seems to disrupt ENSA/SNCA interaction; STXBP5); (3) Ca2+ homeostasis/signaling (IRAG, TC2N, CAMK2D) is affected, as well as (4) cAMP/cGMP levels (PDE3A). Furthermore, Rap1b is inactivated by CALDAG-GEFI, and SCARF1-mediated binding of Ac-LDL seems to be affected.
Figure 4.
Iloprost induces a diverse pattern of responses. (A) Heatmap of 368 phosphorylation sites that were regulated in the ADP and/or ADP+Iloprost (*) data sets and were consistently quantified in both. (B) Sixty-three sites showing a significant decrease in phosphorylation upon Iloprost treatment (*)compared with their corresponding ADP temporal profiles. (C) Sixty-eight sites showing a significant increase in phosphorylation upon Iloprost treatment (*)compared with their corresponding ADP temporal profiles.
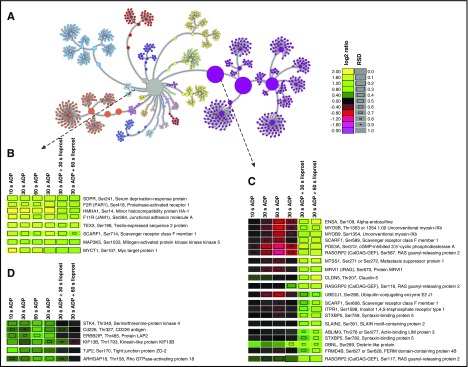
We used pyGCluster25 to reveal functional nodes with a similar temporal behavior upon ADP and ADP+Iloprost stimulation (Figure 5).26 One representative community (Figure 5B) contains 5 membrane proteins (PAR1, HMHA1, F11R, SCARF1, and TEX2) as well as SDPR, MAP3K5, and MYCT1, all showing an early and sustained ADP-dependent upregulation unaffected by Iloprost treatment. According to GPS 2.1 kinase motif prediction,27 SDPRSer241, HMHA1Ser14, F11RSer284, SCARF1Ser714, and MYCT1Ser107/108 are potential PKC targets. In contrast, another community (Figure 5C) comprises sites that are mainly unaffected/downregulated by ADP, but substantially upregulated by Iloprost and are potential/known substrates of PKA, such as RASGRP2.28
Figure 5.
Unsupervised hierarchical clustering of combined ADP and ADP+Iloprost temporal profiles. Color codes reflect log2 ratios compared with unstimulated controls, square sizes indicate relative standard deviations (RSD, see supplemental Methods). Entries are given as: Gene name, phosphorylation site, protein description. (A) Complete node map. All temporal phosphorylation profiles (central gray node) were clustered into different communities according to their similarities, out of which certain examples were selected that indicate functional nodes. (B) Node representing phosphopeptides with early and sustained upregulation, 5 of which are potential PKC targets.26 (C) Node with phosphopeptides not or only slightly affected by ADP but upregulated by Iloprost treatment, consequently potential PKA targets.26 (D) Node with phosphopeptides upregulated by ADP and downregulated by subsequent Iloprost treatment.
Interestingly, for 5 phosphorylation sites in ENSA, G6B, RASGRP2/CALDAG-GEFI, SHROOM4, and DNM2, we detected inverse regulation upon treatment with Iloprost. ENSASer109 is a known PKA site that is dephosphorylated upon ADP stimulation, such as CALDAG-GEFISer587, which is a key regulator of integrin activation.28 G6b is phosphorylated after platelet activation downstream of integrin αIIbβ3 at 2 Tyr residues (Tyr211 and Tyr237).26 This phosphorylation constitutes the inhibitory role of G6b, which is conveyed by interaction with the SH2-domains of SHP1 and SHP2.29 The G6B Ser/Thr phosphorylation sites found here are not associated with any particular function, yet, however are within AGC-kinase consensus motifs. The role of SHROOM4Thr590 is not fully understood, but it appears to act in the regulation of cell morphology,30 and the consensus motif 586ERFApTN591 is rather untypical.
To investigate the occurrence of additional phosphorylation sites that show a reciprocal behavior upon platelet activation/inhibition, we compared the 2 novel platelet phosphoproteomics data sets presented here with our previous study on sole Iloprost stimulation.14 Together they comprise 500 differential phosphoproteins; among those, 21 showed a potential reciprocal regulation. We therefore sought to validate these findings with an independent approach. Notably, the validation of often unknown phosphorylation sites is extremely challenging, because of the (complete) lack of specific antibodies. Owing to this severe absence of available tools, we used a “targeted” mass spectrometry approach, namely parallel reaction monitoring (PRM),31,32 to validate selected findings from our large-scale discovery iTRAQ study. iTRAQ quantification based on so-called data-dependent acquisition is a powerful approach to provide in-depth and relative fold changes of thousands of peptides across multiple samples and therefore to discover differential (phospho)peptides. However, as a trade-off to the in-depth analysis, the obtained fold changes can be underestimated.33 In contrast, PRM allows the specific quantification of only a limited number of selected candidates (eg, identified in discovery experiments), however, with considerably higher precision and accuracy, mainly because of reduced interference from background noise. Notably, PRM can be considered as an antibody-free but MS-based western blot, with the important advantage that it unambiguously and directly links quantitative measurements with confidently identified targets.
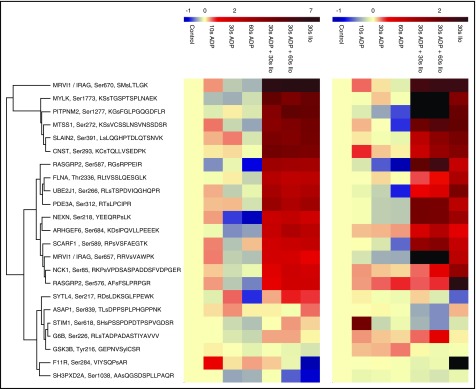
Using PRM, we quantified 23 phosphorylation sites among 7 different conditions (resting, 10 seconds ADP, 30 seconds ADP, 60 seconds ADP, 30 seconds ADP + 30 seconds Iloprost, 30 seconds ADP + 60 seconds Iloprost, 30 seconds Iloprost) and 5 additional donors. This corresponds to a total of 805 western blots. We compared the temporal profiles from these PRM assays with those from our iTRAQ data and on average found a good correlation (Figure 6). Nevertheless, some phosphorylation sites show a considerable inter-individual variation and rather poor correlation of iTRAQ and PRM data, such as STIM1Ser618, ASAP1Ser839, or SYTL4Ser217. Besides the aforementioned technical reasons, another factor that may contribute to incomplete correlation of iTRAQ and PRM data for specific phospho-sites is that these data sets were obtained from separate experiments and different donors. They represent early time points with rapidly changing phosphorylation levels, therefore phosphorylation patterns of individual proteins may differ at specific time points, also reflecting intersubject variations in the early ADP response. Given the challenge to reproducibly stimulate multiple platelet samples for exactly 10 seconds, the usage of more elaborate means of sample stimulation and preparation may further reduce such variations in the future.34
Figure 6.
Heatmap summarizing temporal profiles of 23 selected phosphopeptides. PRM (left) and iTRAQ-based (right) temporal phosphorylation profiles are depicted. Phosphopeptides were clustered according to their PRM profiles, the PRM color code represents log2-fold changes compared with controls. In 7 cases, the corresponding quantitative value was missing for the iTRAQ data (black). Notably, the lower precision of iTRAQ-based quantification leads to ratio compression. Therefore, the smaller scale of iTRAQ ratios was adjusted to the PRM measurements to facilitate the visual comparison (ie, iTRAQ log2-ratios ranged from −1.2 to 2.8). In most cases, the overall phosphorylation changes could be confirmed using an alternative quantification method, additional donors, and platelet preparations conducted by different coworkers.
Discussion
We characterized temporal phosphorylation changes in human platelets stimulated with ADP and ADP+Iloprost. Our rationale was that temporal profiles may reveal novel phosphorylation events with important functional roles. Because we aimed to provide an overall picture of the phosphorylation events caused by these major regulators of platelet aggregation, we have chosen to carry out the study under conditions in which the aggregation process is not abolished. Hence, the detected phosphorylation changes will not exclusively comprise initial P2Y1- and P2Y12-mediated events, but also subsequent synergistic effects as a result of integrin αIIbβ3 outside-in signaling and thromboxane dependent signaling. Although this was not directly studied, we can confidently assert that the early events with ADP (10 seconds) and Iloprost (30 seconds) are most directly linked to P2Y1, P2Y12, and IP receptor stimulation, respectively.
Protein phosphorylation is commonly studied for rather long incubation times and single time points. Thus, reversible events may be overlooked and the detection of early (primary) and late (secondary) events obscured. ADP stimulation induced phosphorylation changes on 302 proteins (ST 3), for 254 already regulated after 10 seconds. In accordance with Stalker et al,4 we grouped regulated proteins into 4 categories: (1) initial processes of activation, (2) aggregation, (3) degranulation, and (4) ubiquitin ligases (see also supplemental Results).
Initial processes of activation
Many proteins of this category were regulated upon ADP stimulation (detailed in supplemental Results), among those PLCB3, IRAG/MRVI1, Pleckstrin, SDPR, DGKgamma, PKC δ and θ, AVPR1A, IRS1, DAPP1, TWF2, SH3PXD2A, CALDAG-GEFI, PITPNM2, PIKFYVE, STIM1, 14 GEFs, 27 GAPs (Table 2), AMPD2, ROCK1, ROCK2, and MYLK.
Table 2.
Regulated GAP and GEF proteins belonging to the Rho/Rac pathway
| GDP exchange proteins (GEF) | GTPase-activating proteins (GAP) | ||||||
|---|---|---|---|---|---|---|---|
| Accession | Gene | Site | Regulation | Accession | Gene | Site | Regulation |
| Q12802 | AKAP13 | Ser1750 | ↑10ADP | P98171 | ARHGAP4 | Ser860 | ↑10ADP |
| Ser2709 | ↑10ADP | ||||||
| Q92974 | ARHGEF2 | Ser121/122 | ↑10ADP | O43182 | ARHGAP6 | Ser927 | ↑10ADP |
| Ser820/Thr821 | ↓60ADP | ||||||
| Q14155 | ARHGEF7 | Ser674/676 | ↑30ADP | Q53QZ3 | ARHGAP15 | Ser43 | ↑30ADP |
| O15013 | ARHGEF10 | Ser379 | ↑10ADP | A7KAX9 | ARHGAP32 | Ser587 | ↑60ADP |
| Q9NZN5 | ARHGEF12 | Ser22 | ↑10ADP | Q92619 | HMHA1 | Ser14 | ↑10ADP |
| Ser599 | ↑10ADP | Ser73 | ↑10ADP | ||||
| Thr96/Ser99 | ↑10ADP | ||||||
| Q9H7D0 | DOCK5 | Ser1742 | ↑10ADP | Q13576 | IQGAP2 | Ser16 | ↑10ADP |
| Ser1766 | ↑10ADP | ||||||
| Ser1781 | ↑10ADP | ||||||
| Q96N67 | DOCK7 | Ser182 | ↑10ADP | Q13459 | MYO9B | Thr1271 | ↑10ADP |
| Ser1354 | ↓60ADP | ||||||
| Thr1492 | ↑10ADP | ||||||
| Ser1972 | ↑10ADP | ||||||
| Q5JSL3 | DOCK11 | Ser31 | ↑10ADP | O60890 | OPHN1 | Ser703 | ↑30ADP |
| O60229 | KALRN | Ser1896 | ↑10ADP | ||||
| Ser2261 | ↑10ADP | ||||||
| Ser1756 + 1757 | ↑10ADP | ||||||
| Q07890 | SOS2 | Ser1315 | ↑10ADP | ||||
| P21731 | TBXA2 | Ser329 | ↑30ADP | ||||
| Q9UKW4 | VAV3 | Ser786 | ↑10ADP | ||||
↑10ADP corresponds to upregulation after 10 seconds of ADP stimulation. If the phosphorylated site could not be localized to a distinct Ser/Thr/Tyr residue with high confidence (eg, ARHGAP6), all possibly phosphorylated residues are listed, according to the phosphoRS algorithm.
Aggregation
Platelet integrins can rapidly, reversibly, and flexibly change between active and inactive conformations in ways that are not fully understood.35 Our data may provide insight into the involved mechanisms. We found several proteins that modify the activation of platelet integrin receptors, among those CALDAG-GEFI (RASGRP2), RAP1GAP2, TLN, FERMT3, and PPFIA1.
Degranulation
Degranulation is an irreversible process. A substantial number of proteins (42) regulated after ADP stimulation belong to the GO-term vesicle-mediated transport. Notably, the vesicle-associated proteins VAMP5 and VAMP8 were regulated upon ADP stimulation, but not upon Iloprost stimulation. Another class of proteins that was only found regulated upon ADP stimulation was syntaxin proteins (STX7). Notably, STXBP5 is a target of activatory (Ser785: ↑10ADP; Ser1131: ↑10ADP) and inhibitory, PKA-driven (Ser759: ↑30/30ADP/Ilo; Ser782: ↑30/30ADP/Ilo) signaling. STXB5 can inhibit membrane fusion between transport vesicles and the plasma membrane, and has been demonstrated to play an important role in platelet secretion. STXB5-deficient mice showed defective granule secretion and prolonged bleeding times.36,37 STXBP5Ser1131 is conserved between mouse and man and is within a v-SNARE coiled–coil homology domain, which may suggest a regulatory role in SNARE complex formation. SYTL4 (Ser217, Ser221: ↑10ADP) enhances platelets-dense granule release in concert with RAB8A. Additionally, we found several GAPs and GEFs involved in the degranulation process regulated upon ADP stimulation. These include RAB4B (Ser193: ↑10ADP), RAB6A (Ser179/Thr180/Ser184: ↓10ADP), and RAB13 (Thr72: ↑10ADP). According to Yamamoto et al, RAB4, RAB13, and RUFY1 (Ser618: ↑10ADP) are involved in endosomal vesicle regulation38 and might play a vital role in platelets, too.
Ubiquitin signaling pathways
As in our previous study,14 we found several ubiquitin ligases regulated upon ADP stimulation. The ubiquitin/proteasome pathway seems to be involved in platelet activation39; however, the exact mechanism is unclear. In total, four E3-ubiquitin ligases (HACE1, HUWE1, MYCBP2, ANKIB1) were differentially phosphorylated. HACE1 (Ser381: ↑10ADP) was reported to induce Rac degradation upon ubiquitination.40 Because Rac is a key player during activation,34 the phosphorylation of HACE1 could lead to an impaired activity. HUWE1 (Thr2540: ↑30ADP) interacts with ADP-ribosylation factor (Arf) in leukocytes.41 MYCBP2, though, is a regulatory switch for receptor internalization,42 which could be of similar importance in human platelets for internalizing and subsequent degradation of PAR receptors (PAR1Ser418 ↑10ADP; PAR4Ser381 ↑10ADP). A similar effect has been shown in HEK cells, where CBL (not found regulated in our data) ubiquitinated PAR2, leading to subsequent degradation.43 Finally, ANKIB1 is a potential E3-ubiquitin ligase (Ser898 ↑10ADP) with unknown substrates. UBE2J1 (Ser266 ↓30ADP) and UBE2O (Ser399 ↑10ADP, Ser1243 ↑10ADP) are ubiquitin-conjugating enzymes. Knockout mice demonstrated an important role for UBE2O in vesicle transport.44 Furthermore, the regulation of UBASH3B/TULA-2 (Thr34 ↑10ADP) might be interesting, because it binds ubiquitinated proteins45 and dephosphorylates them.46 In platelets, SYK is primarily dephosphorylated by UBASH3B/TULA-2, inducing a negative regulation of GPVI signaling.43,47 Notably, the regulated phosphorylation site is within the ubiquitin binding domain and thus could potentially modulate binding of ubiquitinated proteins.
Novel central nodes involved in reversible platelet activation.
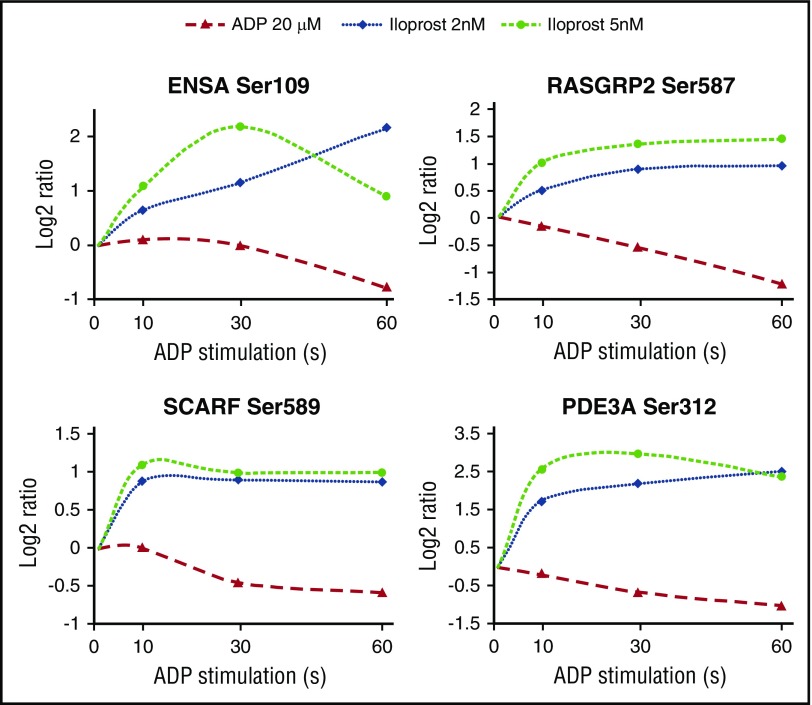
In the blood flow, the activation of platelets not contributing to thrombus formation can be reversed by prostacyclin exposed by the endothelium. We wondered whether we could use temporal phosphoproteomics to study this reversal activation and thus quantified changes between (1) unstimulated (control) platelets and platelets stimulated (2) for 30 seconds with ADP, (3) for 30 seconds with ADP followed by either 30 seconds or (4) 60 seconds with 2 nM Iloprost. We further merged all our temporal platelet phosphorylation data sets (ie, ADP and ADP+Iloprost time series from this study, and our previous Iloprost time series14) to identify phosphorylation sites showing an inverse response (Figure 7). We hypothesize that these might be central players governing platelet homeostasis and representing suitable candidates for monitoring platelet activation states, such as done in the VASP phosphorylation assay.48
Figure 7.
Reciprocal regulation of selected sites upon ADP and Iloprost treatment. Log2 ratio refers to the changes compared with resting platelets. Iloprost regulation data were taken from our previous study.14
For some of these proteins, their central roles in platelet activation/inhibition are well known: G6B, STIM1, PLCB3, PDE3A, RASGRP2, SYTL4, DAPP1, MRVI1/IRAG, and FHOD1. However, for others, their functions in platelets are elusive or only partly understood (eg, for SHROOM4, MTSS1, GSK3A, ENSA, PIKFYVE, PITPNM2, SCARF1, GAPVD1, MYO9B, UBE2O, and UBE2J1).
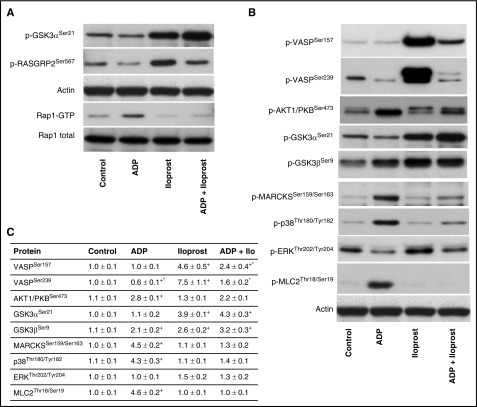
For PDE3A, our data (Figure 7) show a de-/phosphorylation at Ser312. On the one hand this phosphorylation could induce a negative feedback loop upon Iloprost-mediated signaling, leading to reduced cAMP levels. On the other hand, dephosphorylation upon ADP-mediated signaling could also induce a negative feedback loop by increasing cAMP levels. Our data confirm recent findings that RASGRP2/CALDAG-GEFISer587 is crucial for Rap1B signaling27; it is clearly downregulated by ADP (via P2Y12 and Rap1B on) and upregulated by Iloprost (Rap1B off). We verified these results by western blotting (Figure 8); however, Ser567 downregulation is not as apparent as in our MS data. Furthermore, we pinpointed the differential GSK3A phosphorylation site to Ser21 using phosphospecific antibodies (Figure 8), showing a downregulation by ADP and upregulation by Iloprost.
Figure 8.
Western blot validation of inverse GSK3ASer21, RASGRP2Ser567phosphorylation, and RAP1 pull-down after stimulation with ADP, Iloprost, and ADP+Iloprost. (A) Human platelets (3 × 10⁸/mL) were stimulated by ADP (10 μM, 1 minute), Iloprost (2 nM, 1 minute), or both; notably, slightly different than for the phosphoproteomics data. After stimulation, platelets were lysed and subjected to western blot GSK3ASer21, RASGRP2Ser567, and Rap1 pull-down assay. The representative blots of 3 independent experiments are shown. (B) Immunoblots using selected phosphospecific antibodies were done in triplicate and (C) quantified using the ImageJ program. The intensities of the phosphorylation signals were normalized to actin. Data are normalized against controls, results are given as means ± standard error of the mean (n = 3, + P < .05 compared with the control, *P < .05 compared with the Iloprost sample).
In conclusion, platelet phosphorylation profiles induced by the 2 fundamental counterparts ADP and prostacyclin produce a complex but consistent picture. A remarkable number of phosphorylation sites and changes have been observed in platelets for the first time; however, the function of many of those is still unknown. This renders this data set a valuable resource for functional studies on promising candidates. It will be important in the future to understand which of the observed initial and later phosphorylation events are mediated by first triggering the P2Y1 and P2Y12 receptors, and subsequent integrin αIIbβ3 outside-in signaling and thromboxane receptor–mediated pathways.
The identification of reciprocal protein phosphorylation may allow the identification of potential marker proteins representing a specific functional state of platelets. Thus, we present a toolbox of reversible phosphorylation sites that should be characterized more in detail, yet raise hope in developing novel assays to monitor platelet activation states for the clinic. By integrating biochemical and functional data/models and quantitative proteomic data,14,27,31 novel pharmacologic targets can be identified that might pave the way toward precision medicine.49
Acknowledgments
The authors thank all the blood donors for their valuable contributions.
This study was supported by the Ministerium für Innovation; Wissenschaft und Forschung des Landes Nordrhein-Westfalen; the Senatsverwaltung für Wirtschaft, Technologie und Forschung des Landes Berlin; and Bundesministerium für Bildung und Forschung grants 0315395A and 0315395D (F.B., R.P.Z., A.S., J.G., U.W.) and 01EO1003 and 01EO1503 (K.J., U.W.); and German Research Foundation DGF grants SFB688 TPA2 (S.G., A.S., U.W.), ZA 639/4-1 (R.P.Z.), and Ju 2735/2-1 (K.J.).
Footnotes
This article contains a data supplement.
The publication costs of this article were defrayed in part by page charge payment. Therefore, and solely to indicate this fact, this article is hereby marked “advertisement” in accordance with 18 USC section 1734.
Authorship
Contribution: F.B., J.G., and S.G. performed research, analyzed data, and wrote the paper; F.A.S. performed research, analyzed data, and contributed to writing the paper; M.D. performed research and analyzed data; S.L. and N.J.M. analyzed data; I.M. and O.P. contributed analytical tools; K.J. analyzed data and contributed to writing the paper; J.M.B. and C.F. analyzed data and contributed analytical tools; J.W.M.H. analyzed data and wrote the paper; U.W. analyzed data and designed the research; R.P.Z. analyzed data, designed the research, and wrote the paper; and A.S. designed the research.
Conflict-of-interest disclosure: The authors declare no competing financial interests.
Correspondence: René P. Zahedi, Leibniz-Institut für Analytische Wissenschaften–ISAS–e.V., Otto-Hahn-Str 6b, D-44227 Dortmund, Germany; e-mail: rene.zahedi@isas.de; and Albert Sickmann, Leibniz-Institut für Analytische Wissenschaften–ISAS–e.V., Otto-Hahn-Str 6b, D-44227 Dortmund, Germany; e-mail: albert.sickmann@isas.de.
References
- 1.von Papen M, Gambaryan S, Schütz C, Geiger J. Determination of ATP and ADP Secretion from Human and Mouse Platelets by an HPLC Assay. Transfus Med Hemother. 2013;40(2):109-116. [DOI] [PMC free article] [PubMed] [Google Scholar]
- 2.Gachet C. P2 receptors, platelet function and pharmacological implications. Thromb Haemost. 2008;99(3):466-472. [DOI] [PubMed] [Google Scholar]
- 3.Smolenski A. Novel roles of cAMP/cGMP-dependent signaling in platelets. J Thromb Haemost. 2012;10(2):167-176. [DOI] [PubMed] [Google Scholar]
- 4.Stalker TJ, Newman DK, Ma P, Wannemacher KM, Brass LF. Platelet signaling. Handb Exp Pharmacol. 2012; (210):59-85. [DOI] [PMC free article] [PubMed] [Google Scholar]
- 5.Versteeg HH, Heemskerk JW, Levi M, Reitsma PH. New fundamentals in hemostasis. Physiol Rev. 2013;93(1):327-358. [DOI] [PubMed] [Google Scholar]
- 6.Barn K, Steinhubl SR. A brief review of the past and future of platelet P2Y12 antagonist. Coron Artery Dis. 2012;23(6):368-374. [DOI] [PubMed] [Google Scholar]
- 7.Dogné JM, Hanson J, Pratico D. Thromboxane, prostacyclin and isoprostanes: therapeutic targets in atherogenesis. Trends Pharmacol Sci. 2005;26(12):639-644. [DOI] [PubMed] [Google Scholar]
- 8.Frere C, Cuisset T, Morange PE, et al. . Effect of cytochrome p450 polymorphisms on platelet reactivity after treatment with clopidogrel in acute coronary syndrome. Am J Cardiol. 2008;101(8):1088-1093. [DOI] [PubMed] [Google Scholar]
- 9.Marcone S, Dervin F, Fitzgerald DJ. Proteomic signatures of antiplatelet drugs: new approaches to exploring drug effects. J Thromb Haemost. 2015;13(Suppl 1):S323-S331. [DOI] [PubMed] [Google Scholar]
- 10.Matetzky S, Shenkman B, Guetta V, et al. . Clopidogrel resistance is associated with increased risk of recurrent atherothrombotic events in patients with acute myocardial infarction. Circulation. 2004;109(25):3171-3175. [DOI] [PubMed] [Google Scholar]
- 11.Burkhart JM, Gambaryan S, Watson SP, et al. . What can proteomics tell us about platelets? Circ Res. 2014;114(7):1204-1219. [DOI] [PubMed] [Google Scholar]
- 12.Pagel O, Loroch S, Sickmann A, Zahedi RP. Current strategies and findings in clinically relevant post-translational modification-specific proteomics. Expert Rev Proteomics. 2015;12(3):235-253. [DOI] [PMC free article] [PubMed] [Google Scholar]
- 13.Scholten A, Preisinger C, Corradini E, et al. . Phosphoproteomics study based on in vivo inhibition reveals sites of calmodulin-dependent protein kinase II regulation in the heart. J Am Heart Assoc. 2013;2(4):e000318. [DOI] [PMC free article] [PubMed] [Google Scholar]
- 14.Beck F, Geiger J, Gambaryan S, et al. . Time-resolved characterization of cAMP/PKA-dependent signaling reveals that platelet inhibition is a concerted process involving multiple signaling pathways. Blood. 2014;123(5):e1-e10. [DOI] [PubMed] [Google Scholar]
- 15.Manza LL, Stamer SL, Ham AJ, Codreanu SG, Liebler DC. Sample preparation and digestion for proteomic analyses using spin filters. Proteomics. 2005;5(7):1742-1745. [DOI] [PubMed] [Google Scholar]
- 16.Wiśniewski JR, Zougman A, Mann M. Combination of FASP and StageTip-based fractionation allows in-depth analysis of the hippocampal membrane proteome. J Proteome Res. 2009;8(12):5674-5678. [DOI] [PubMed] [Google Scholar]
- 17.Burkhart JM, Schumbrutzki C, Wortelkamp S, Sickmann A, Zahedi RP. Systematic and quantitative comparison of digest efficiency and specificity reveals the impact of trypsin quality on MS-based proteomics. J Proteomics. 2012;75(4):1454-1462. [DOI] [PubMed] [Google Scholar]
- 18.Engholm-Keller K, Birck P, Størling J, Pociot F, Mandrup-Poulsen T, Larsen MR. TiSH--a robust and sensitive global phosphoproteomics strategy employing a combination of TiO2, SIMAC, and HILIC. J Proteomics. 2012;75(18):5749-5761. [DOI] [PubMed] [Google Scholar]
- 19.Vizcaíno JA, Côté RG, Csordas A, et al. . The PRoteomics IDEntifications (PRIDE) database and associated tools: status in 2013. Nucleic Acids Res. 2013;41(Database issue):D1063-D1069. [DOI] [PMC free article] [PubMed] [Google Scholar]
- 20.Mindukshev I, Gambaryan S, Kehrer L, et al. . Low angle light scattering analysis: a novel quantitative method for functional characterization of human and murine platelet receptors. Clin Chem Lab Med. 2012;50(7):1253-1262. [DOI] [PubMed] [Google Scholar]
- 21.Burkhart JM, Vaudel M, Gambaryan S, et al. . The first comprehensive and quantitative analysis of human platelet protein composition allows the comparative analysis of structural and functional pathways. Blood. 2012;120(15):e73-e82. [DOI] [PubMed] [Google Scholar]
- 22.Ashburner M, Ball CA, Blake JA, et al. ; The Gene Ontology Consortium. Gene ontology: tool for the unification of biology. Nat Genet. 2000;25(1):25-29. [DOI] [PMC free article] [PubMed] [Google Scholar]
- 23.Snel B, Lehmann G, Bork P, Huynen MA. STRING: a web-server to retrieve and display the repeatedly occurring neighbourhood of a gene. Nucleic Acids Res. 2000;28(18):3442-3444. [DOI] [PMC free article] [PubMed] [Google Scholar]
- 24.Gilio K, Harper MT, Cosemans JM, et al. . Functional divergence of platelet protein kinase C (PKC) isoforms in thrombus formation on collagen. J Biol Chem. 2010;285(30):23410-23419. [DOI] [PMC free article] [PubMed] [Google Scholar]
- 25.Jaeger D, Barth J, Niehues A, Fufezan C. pyGCluster, a novel hierarchical clustering approach. Bioinformatics. 2014;30(6):896-898. [DOI] [PubMed] [Google Scholar]
- 26.Senis YA, Antrobus R, Severin S, et al. . Proteomic analysis of integrin alphaIIbbeta3 outside-in signaling reveals Src-kinase-independent phosphorylation of Dok-1 and Dok-3 leading to SHIP-1 interactions. J Thromb Haemost. 2009;7(10):1718-1726. [DOI] [PubMed] [Google Scholar]
- 27.Xue Y, Ren J, Gao X, Jin C, Wen L, Yao X. GPS 2.0, a tool to predict kinase-specific phosphorylation sites in hierarchy. Mol Cell Proteomics. 2008;7(9):1598-1608. [DOI] [PMC free article] [PubMed] [Google Scholar]
- 28.Subramanian H, Zahedi RP, Sickmann A, Walter U, Gambaryan S. Phosphorylation of CalDAG-GEFI by protein kinase A prevents Rap1b activation. J Thromb Haemost. 2013;11(8):1574-1582. [DOI] [PubMed] [Google Scholar]
- 29.Coxon CH, Sadler AJ, Huo J, Campbell RD. An investigation of hierachical protein recruitment to the inhibitory platelet receptor, G6B-b. PLoS One. 2012;7(11):e49543. [DOI] [PMC free article] [PubMed] [Google Scholar]
- 30.Dietz ML, Bernaciak TM, Vendetti F, Kielec JM, Hildebrand JD. Differential actin-dependent localization modulates the evolutionarily conserved activity of Shroom family proteins. J Biol Chem. 2006;281(29):20542-20554. [DOI] [PubMed] [Google Scholar]
- 31.Solari FA, Mattheij NJ, Burkhart JM, et al. . Combined Quantification of the Global Proteome, Phosphoproteome, and Proteolytic Cleavage to Characterize Altered Platelet Functions in the Human Scott Syndrome. Mol Cell Proteomics. 2016;15(10):3154-3169. [DOI] [PMC free article] [PubMed] [Google Scholar]
- 32.Bourmaud A, Gallien S, Domon B. Parallel reaction monitoring using quadrupole-Orbitrap mass spectrometer: Principle and applications. Proteomics. 2016;16(15-16):2146-2159. [DOI] [PubMed] [Google Scholar]
- 33.Karp NA, Huber W, Sadowski PG, Charles PD, Hester SV, Lilley KS. Addressing accuracy and precision issues in iTRAQ quantitation. Mol Cell Proteomics. 2010;9(9):1885-1897. [DOI] [PMC free article] [PubMed] [Google Scholar]
- 34.Novo P, Dell’Aica M, Janasek D, Zahedi RP. High spatial and temporal resolution cell manipulation techniques in microchannels. Analyst (Lond). 2016;141(6):1888-1905. [DOI] [PubMed] [Google Scholar]
- 35.Cosemans JM, Iserbyt BF, Deckmyn H, Heemskerk JW. Multiple ways to switch platelet integrins on and off. J Thromb Haemost. 2008;6(8):1253-1261. [DOI] [PubMed] [Google Scholar]
- 36.Ye S, Huang Y, Joshi S, et al. . Platelet secretion and hemostasis require syntaxin-binding protein STXBP5. J Clin Invest. 2014;124(10):4517-4528. [DOI] [PMC free article] [PubMed] [Google Scholar]
- 37.Zhu Q, Yamakuchi M, Ture S, et al. . Syntaxin-binding protein STXBP5 inhibits endothelial exocytosis and promotes platelet secretion. J Clin Invest. 2014;124(10):4503-4516. [DOI] [PMC free article] [PubMed] [Google Scholar]
- 38.Yamamoto Y, Nishimura N, Morimoto S, et al. . Distinct roles of Rab3B and Rab13 in the polarized transport of apical, basolateral, and tight junctional membrane proteins to the plasma membrane. Biochem Biophys Res Commun. 2003;308(2):270-275. [DOI] [PubMed] [Google Scholar]
- 39.Gupta N, Li W, McIntyre TM. Deubiquitinases Modulate Platelet Proteome Ubiquitination, Aggregation, and Thrombosis. Arterioscler Thromb Vasc Biol. 2015;35(12):2657-2666. [DOI] [PMC free article] [PubMed] [Google Scholar]
- 40.Torrino S, Visvikis O, Doye A, et al. . The E3 ubiquitin-ligase HACE1 catalyzes the ubiquitylation of active Rac1. Dev Cell. 2011;21(5):959-965. [DOI] [PubMed] [Google Scholar]
- 41.Qi CF, Kim YS, Xiang S, et al. . Characterization of ARF-BP1/HUWE1 interactions with CTCF, MYC, ARF and p53 in MYC-driven B cell neoplasms. Int J Mol Sci. 2012;13(5):6204-6219. [DOI] [PMC free article] [PubMed] [Google Scholar]
- 42.Holland S, Coste O, Zhang DD, Pierre SC, Geisslinger G, Scholich K. The ubiquitin ligase MYCBP2 regulates transient receptor potential vanilloid receptor 1 (TRPV1) internalization through inhibition of p38 MAPK signaling. J Biol Chem. 2011;286(5):3671-3680. [DOI] [PMC free article] [PubMed] [Google Scholar]
- 43.Jacob C, Cottrell GS, Gehringer D, Schmidlin F, Grady EF, Bunnett NW. c-Cbl mediates ubiquitination, degradation, and down-regulation of human protease-activated receptor 2. J Biol Chem. 2005;280(16):16076-16087. [DOI] [PubMed] [Google Scholar]
- 44.Hao YH, Doyle JM, Ramanathan S, et al. . Regulation of WASH-dependent actin polymerization and protein trafficking by ubiquitination. Cell. 2013;152(5):1051-1064. [DOI] [PMC free article] [PubMed] [Google Scholar]
- 45.Kowanetz K, Crosetto N, Haglund K, Schmidt MH, Heldin CH, Dikic I. Suppressors of T-cell receptor signaling Sts-1 and Sts-2 bind to Cbl and inhibit endocytosis of receptor tyrosine kinases. J Biol Chem. 2004;279(31):32786-32795. [DOI] [PubMed] [Google Scholar]
- 46.Thomas DH, Getz TM, Newman TN, et al. . A novel histidine tyrosine phosphatase, TULA-2, associates with Syk and negatively regulates GPVI signaling in platelets. Blood. 2010;116(14):2570-2578. [DOI] [PMC free article] [PubMed] [Google Scholar]
- 47.Reppschläger K, Gosselin J, Dangelmaier CA, et al. . TULA-2 protein phosphatase suppresses activation of Syk through the GPVI platelet receptor for collagen by dephosphorylating Tyr(P)346, a Regulatory Site of Syk. J Biol Chem. 2016;291(43):22427-22441. [DOI] [PMC free article] [PubMed] [Google Scholar]
- 48.Geiger J, Brandmann T, Hubertus K, Tjahjadi B, Schinzel R, Walter U. A protein phosphorylation-based assay for screening and monitoring of drugs modulating cyclic nucleotide pathways. Anal Biochem. 2010;407(2):261-269. [DOI] [PubMed] [Google Scholar]
- 49.Nagalla S, Bray PF. Personalized medicine in thrombosis: back to the future. Blood. 2016;127(22):2665-2671. [DOI] [PMC free article] [PubMed] [Google Scholar]


