

Abstract
Computational approaches are useful tools to interpret and guide experiments to expedite the antibiotic drug design process. Structure based drug design (SBDD) and ligand based drug design (LBDD) are the two general types of computer-aided drug design (CADD) approaches in existence. SBDD methods analyze macromolecular target 3-dimensional structural information, typically of proteins or RNA, to identify key sites and interactions that are important for their respective biological functions. Such information can then be utilized to design antibiotic drugs that can compete with essential interactions involving the target and thus interrupt the biological pathways essential for survival of the microorganism(s). LBDD methods focus on known antibiotic ligands for a target to establish a relationship between their physiochemical properties and antibiotic activities, referred to as a structure-activity relationship (SAR), information that can be used for optimization of known drugs or guide the design of new drugs with improved activity. In this chapter, standard CADD protocols for both SBDD and LBDD will be presented with a special focus on methodologies and targets routinely studied in our laboratory for antibiotic drug discoveries.
Keywords: Computer-aided drug design, molecular dynamics, virtual screening, docking, Site Identification by Ligand Competitive Saturation, SILCS, structure-activity relationship, pharmacophore, force field
1. Introduction
Despite the fact that numerous antibiotic drugs are available and have been routinely used for a much longer time than most other drugs, the fight between humans and the surrounding bacteria responsible for infections are ongoing and will be so for the foreseeable future. Contributing to this is the steady rise of antibiotics drug resistance leading to the need for new antibiotics (1, 2). Toward the design of new antibiotics, computer-aided drug design (CADD) can be combined with wet-lab techniques to elucidate the mechanism of drug resistance, to search for new antibiotic targets and to design novel antibiotics for both known and new targets. Notably CADD methods can produce an atomic level structure-activity relationship (SAR) used to facilitate the drug design process thereby minimizing time and costs (3, 4).
Understanding the atomic-detailed mechanism behind the antibiotics resistance helps to reveal limitations in current antibiotics and shed light on the design of new drugs. For examples, Trylska et al. studied the effects of mutations at the bacterial ribosomal A-site using molecular dynamics (MD) simulations to reveal the origins of bacterial resistance to aminoglycosidic antibiotics (5). Our lab studied the impact of ribosomal modification on the binding of the antibiotic telithromycin using a combined Grand Canonical Monte Carlo (GCMC)/Molecular Dynamics (MD) simulation methodology (6, 7) and revealed atom-level details of how those modifications lead to resistance that will be of utility to improve the activity and spectrum of macrolide analogs thereby minimizing resistance (8).
An important alternative to solve the antibiotic resistance issue is the identification of new antibiotic targets that may represent novel mechanisms essential for bacterial survival. For example, researchers used bioinformatics approaches to screen various databases computationally and identified seven enzymes involved in bacterial metabolic pathways as well as 15 non-homologous proteins located on membranes in the gram positive bacterium Staphylococcus aureus (SA), thereby indicating them as potential targets (9). Such findings may help to overcome the resistance of this bacterium to common antibiotics such as methicillin, fluoroquinolones and oxazolidinones. An example of a recently identified novel antibiotic target is the protein heme oxygenase, involved in the metabolism of heme by bacteria as required to access iron (10–12). In collaborative studies with the Wilks lab, we have successfully applied CADD techniques to identify inhibitors of the bacterial heme oxygenases from Pseudomonas aeruginosa and Neisseria meningitides, thereby confirming the potential role of heme oxygenases as a novel antimicrobial targets (13, 14).
Researchers are also continuing to look for new antibiotics against existing targets and computational approaches have been successfully used in a number of studies. Using in silico database screening, Chang et al. found a new series of non-β-lactam antibiotics, the oxadiazoles, which can inhibit penicillin-binding protein 2a (PBP2a) of methicillin-resistant SA (MRSA), the cause of most infections in hospitals (15). Using ligand-based drug design (LBDD), our lab with Andrade and coworkers investigated analogs of the third-generation ketolide antibiotic telithromycin as a possible means to address the bacterial resistance problem associated with that class of antibiotics (16–18). In another study, based on the 3D structure of the complex of human defensin peptide HNP1 with Lipid II, which serves as precursor for bacterial cell wall biosynthesis and is a validated target for antibiotics, our lab designed a simple pharmacophore model and used it in a database screen to search for low weight defensin mimetics (19). From that effort, a lead compound was identified that targets Lipid II with high specificity and affinity. Notably, this is the first example of a small molecular weight compound that shows promising activity against Lipid II. Lead compound derivatives were subsequently identified again using CADD in combination with medicinal chemistry (20) and the accumulated SAR information will facilitate the development of next generation antibiotics targeting gram positive pathogenic bacteria.
Figure 1 illustrates the basic CADD workflow that can be interactively used with experimental techniques to identify novel lead compounds as well as direct iterative ligand optimization (3, 4, 21, 22). The process starts with the biological identification of a putative target to which ligand binding should lead to antimicrobial activity. In SDBB, the 3D structure of the target can be identified by X-ray crystallography or NMR or using homology modeling. This lays the foundation for CADD SBDD screening using the methods described below. LBDD is used in the absence of the target 3D structure with the central theme being the development of an SAR from which information on modification of the lead compound to improve activity can be obtained. Information from the CADD methods is then used to design compounds that are subjected to chemical synthesis and biological assay, with the information from those experiments used to further develop the SAR, yielding further improvements in the compounds with respect to activity as well as absorption, disposition, metabolism and excretion (ADME) considerations (23). Notably, CADD methods are evolving with researchers continually updating and implementing new CADD techniques with higher levels of accuracy and speed (24–26). In this chapter, we will present commonly used CADD approaches, including those used in our lab for the design of next-generation antibiotics.
Figure 1.
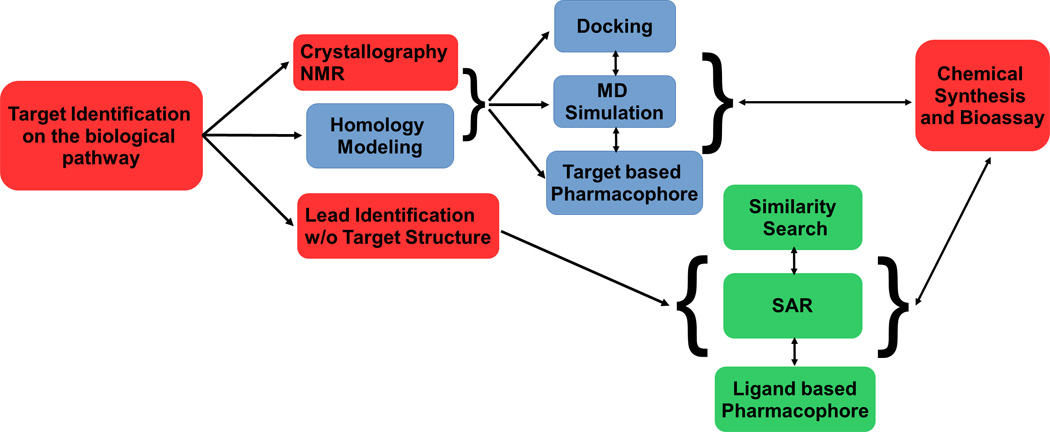
Basic CADD workflow in drug discovery. Wet-lab, SBDD and LBDD CADD techniques are outlined in solid lines, dashed lines or dotted lines, respectively. Double headed arrows indicate the two techniques can be used interactively in several iterative rounds of ligand design.
2. Materials
CADD methods are mathematical tools to manipulate and quantify the properties of potential drug candidates as implemented in a number of programs. These include a range of publicly and commercially available software packages; the subset described below represents examples of fundamental tools for CADD with emphasis on those commonly used in our laboratory.
Commonly used MD simulation codes include CHARMM (27), AMBER (28), NAMD, (29) GROMACS (30) and OpenMM (31). These programs run on a variety of computer architectures including running in parallel on multicore central processing units (CPU) and, more recently, optimized for graphics processing units (GPU), such as those commonly used in video games.
For SBDD, the 3D structure of the protein, RNA or other macromolecule may be obtained from the Protein Data Bank (PDB) (32) if it was solved by X-ray crystallography or nuclear magnetic resonance (NMR) experiments. Alternatively, a 3D structure may be constructed using homology modeling methods with a program such as MODELLER (33) or an on-line web server such as SWISS-MODEL (34).
In order to perform MD simulations, homology modeling, database screening or other CADD techniques empirical force fields for the molecules of interest are needed. These force fields are used by the respective programs to estimate the energy and forces associated with, for example, a drug-protein complex. Force fields such as those from the CHARMM (35–38) or AMBER (39, 40) families are used to describe the internal and external energetic properties of a molecular system during an energy minimization or a MD simulation. When parameters are missing in the existing force field, which is common for small drug-like molecules, automated parameter generation programs such as the CGenFF program (41, 42) or Antechamber (43) can be used to complete the force field. It is important to note that when using a force field the parameters for different parts of the system (e.g. the protein and the ligand) need to be compatible, such that CGenFF should be used with CHARMM or Antechamber with AMBER. In addition, when parameters are estimated it is suggested that the user check the parameters with respect to their accuracy in treating the energy as a function of conformation, as described for CGenFF (37, 44, 45). To facilitate this process when generating parameters using the CGenFF program (see https://cgenff.paramchem.org), penalties are assigned to parameters estimated based on analogy, guiding the user with respect to parameters that require checking.
When no information on the binding site of a target is available, putative binding sites can be identified by various CADD methods. An example, is the binding response program (46) developed in our lab. The program identifies potential binding sites by considering both the geometrical match and the binding energy of a set of diverse drug-like compounds to the sites being queried on the protein. Other programs for binding site identification include FINDSITE (47) and ConCavity (48).
Virtual database screening (VS) techniques are generally used to screen large in silico compound databases to identify potential binders for a query target. Examples of docking software commonly used for this purpose are DOCK (49) and AutoDock (50) as well as AutoDock Vina (51), all of which are well-known freeware programs. Another example is the program Pharmer (52), which uses 3D pharmacophores for database screening.
The in silico database of drug-like compounds is an essential component of CADD ligand identification based on VS. A publically accessible database of compounds for VS is ZINC (53) which currently has about 90 million compounds that can be purchased from various chemical vendors. In-house databases can also be constructed for particular VS needs and chemical vendors such as ChemBridge and ChemDiv (54) supply their chemical catalogs in SDF format for download. However, conversion of these to 3D structures can be challenging and all physiologically accessible protonation and tautomeric states of the ligands in the database should be included.
Commercially available CADD software packages include Discovery Studio (55), OpenEye (56), Schrödinger (57) and MOE (58). These programs, which can often be obtained at a discount for academic users, cover most of the capabilities required for CADD including both SBDD and LBDD methods.
3. Methods
CADD can be separated into ligand or hit identification and ligand or hit optimization, with both SBDD and LBDD methods useful in the appropriate context. Database screening methods are often used for hit identification (59) while a number of methods may be used for hit optimization (4, 24, 60). These include the Site-identification by ligand competitive saturation (SILCS) methodology. Below we present a collection of methods that may be used for both ligand identification and optimization.
3.1 MD simulations
MD simulations can be used to study target-ligand interactions at an atomic level of detail (61), to generate conformational ensembles for the target or for the ligand to take flexibility into account for both SBDD and LBDD studies (see Note 1) and, in combination with other methods, used to estimate relative free energies of binding. Following are the steps required to perform a standard MD simulation (see Note 2 for additional MD techniques). A convenient web-based tool to perform a number of the steps below is the CHARMM-GUI at www.charmm-gui.org (62).
Download the 3D structure of the bacterial target structure of interest from the PDB or use homology modelling to generate a structure.
Refine the target structure including adjusting the side chain orientations, add hydrogens, and determine the appropriate protonation states for titratable residues. Software such as Reduce (63) can be used for this purpose. Remove or retain cofactors, ions and crystal waters depending on the study needs.
Choose a force field, such as CHARMM36 (http://mackerell.umaryland.edu/charmm_ff.shtml) to describe the system and a MD code to carry out the simulation. Prepare the input files according to the program formats. If force field parameters are missing, develop parameters using an automated program such as the CGenFF program or following a standard parametrization protocol for the chosen force field (37, 38).
For explicit solvent MD, solvate the system in a water box with periodic boundary conditions (PBC) (61), a process that can be performed automatically using the CHARMM-GUI mentioned above. Minimize and equilibrate the whole system step by step to allow bad atomic contacts to relax and attain relaxed geometries. Usually harmonic restraints are first put on non-water components of the system and gradually reduced through the minimization and MD equilibration. This avoids large changes in the target structure due to bad atomic contacts in the initial model. NVT canonical ensemble MD is usually used for first step equilibration and followed by NPT ensemble MD to allow the PBC box size to adjust corresponding to the temperature and pressure, typically 298 K and 1 atm, respectively, of interest.
Run the MD simulation in the NPT ensemble for the time scale corresponding to the phenomena being studied. This usually involves nano- to microsecond timescales, although some phenomena can occur on shorter timescales. The user is advised to check that the event of interest (e.g. conformational change of the protein binding site) has occurred multiple times during the simulation or the phenomenon being monitored does not change significantly with increasing simulation time. However, no MD simulation is ever truly converged such that changes in the properties being monitored may occur after it appears that they are no longer changing.
Do a basic quality check on the MD trajectories such as analyzing the root-mean-square deviation (RMSD) of the target with respect to the starting conformation along the simulation time. Typically, there is an increase in the RMSD followed by a stable, fluctuating value. However, as stated in the preceding section, though a simulation appears stable, additional changes can occur upon additional simulation time.
When studying target-ligand interactions, different properties along the trajectory can be calculated for analyses such as interaction energy and hydrogen bonding profiles. In addition structural clustering algorithms can be used to extract representative conformations from MD trajectories (64) to understand different interaction patterns between the ligand and the protein that contribute to binding.
3.2 Site Identification by Ligand Competitive Saturation (SILCS)
SILCS is a novel CADD protocol developed in our lab to facilitate ligand design (65). It uses all-atom explicit-solvent MD simulations that include small organic solutes, such as propane, methanol and others, to identify 3D functional-group binding patterns on the target. These patterns can be used qualitatively to direct ligand design and, when converted to free energies, termed grid free energy (GFE) FragMaps (66, 67), used to quantitatively estimate the relative binding affinities of ligands. The detailed protocol based on full MD simulations was described previously in this same book series (68). Here we present an updated protocol based on the use of oscillating μex Grand Canonical Monte Carlo/MD (GCMC/MD) simulations for SILCS (69). The GCMC/MD approach allows for the application of the SILCS method to target systems with deep or occluded pockets such as nuclear receptors and GPCRs (70).
Prepare the system in a similar way as described in section 3.1 for MD simulations. In addition to water, add solute molecules such as benzene, propane, methanol, formamide, acetaldehyde, imidazole, methylammonium and acetate at a concentration of about 0.25 M.
Place weak restraints only on the backbone Cα carbon atoms with a force constant (k in 1/2 kδx2) of 0.12 kcal/mol/Å for all residues or only on core region residues in the target if additional flexibility of selected regions of the protein is desired. The use of Cα restraints prevents the rotation and translation of the protein in the simulation box and prevents potential denaturation due to the presence of small solutes in the aqueous solution surrounding the target (71).
This system is minimized for 5000 steps with the steepest descent (SD) algorithm (72) in the presence of PBC followed by a 250 picosecond (ps) MD equilibration during which temperature is adjusted by velocity rescaling.
During GCMC, solutes and water are exchanged between their gas-phase reservoirs and the simulation system. The excess chemical potential (μex) supplied to drive solute and water exchange is periodically oscillated over every 3 cycles for each solute or water, based on their target concentration (eg. 0.25 M for the solutes and 55 M for water). From these calculations, which are performed over 100 or more cycles, the average μex is close to the respective experimental hydration free energy values of the solutes and water. As described in detail elsewhere (69), there are four possible GCMC moves: insertion, deletion, translation and rotation, with the probabilities for acceptance of these moves governed by the Metropolis criteria.
The configuration at the end of each GCMC cycle is used as the starting configuration for a 0.5 to 1 nanosecond (ns) MD simulation during which the protein can undergo conformational changes as well as to obtain additional sampling of the water and solutes in and around the target molecule. Before the production MD, a 500 step SD minimization and a 100 ps equilibration is run. The last conformation from the production MD is used as the starting conformation of the next GCMC cycle.
Ten independent 100 cycle GCMC-MD runs are recommended. For each cycle, 200,000 steps of GCMC and 0.5 ns MD are conducted yielding a cumulative 200 million steps of GCMC and 500 ns of MD over all 10 independent simulations.
3D probability distributions of selected atoms from the solutes, called “FragMaps”, from the GCMC/MD simulations are constructed. These are converted to GFE FragMaps based on a Boltzmann transformation, which allow for quantitative evaluation of ligand affinities, including the contribution of individual atoms. The GFE FragMaps can be used to guide ligand docking using the MC-SILCS approach (67) or for the calculation of target pharmacophore models using SILCS-Pharm (73, 74).
3.3 Database Preparation
VS against a database containing commercially available compounds, is an efficient way to find potential low-molecular weight binders to the target protein (59). While the ZINC database is available, researchers may want to prepare an in-house database for specific use.
Download the commercial database(s) from chemical vendors such as Chembridge, Chemdiv, Maybridge, Specs, etc. These databases are most often in 2D SDF format and need further refinement.
Convert 2D SDF files into 3D structure files such as MOL2 format files using a chemical data tool such as Open Babel (75) or RDKit (76). During the conversion, preliminary geometry optimization can be conducted to refine the 3D geometry to avoid bad contacts that may be transferred from the 2D structure. Missing hydrogens are added and appropriate protonation states are determined usually for pH 7.2 (see Note 3). Various tautomers can also be generated and if subsequent screening studies will use rigid ligand docking, multiple rotamers, typically 100 to 200, can also be generated for consideration of the conformations accessible to each molecule.
All 3D structures can be further optimized using a force field based minimization to obtain more chemically-accurate structures and assign atomic charges for subsequent screening studies if required. Organic molecule force fields such as CGenFF (37, 38), GAFF (40) or MMFF94 (77) can be used for this purpose.
When a database is prepared based on compounds from various vendors, in-house consistent identifiers are often needed to tag all the compounds for easy data management. For each compound, various entries such as physical properties and vendor information can be added for convenient use in subsequent analyses. The database, if extremely large, can be divided into several pieces for more efficient use. Finally, the database needs to be saved in the format required by the software to be used in following studies, for example, MOE (58) uses the binary MDB format while Dock uses the readable MOL2 format.
3.4 Docking-based VS
Docking involves posing a compound in the putative binding site on the target in an optimal way defined by a scoring function in combination with a conformational sampling method (78). Various docking programs are available that differ based on the scoring function used to describe the interaction between small molecule and the target and the conformational sampling method used to generate the binding poses of the ligand on the protein. Here we present a docking protocol using the DOCK program (49) to illustrate the typical docking VS workflow.
Prepare the target structure in the required DOCK input format. Define the desired binding pocket on the protein surface either using experimental information or by using a binding pocket prediction program as described in the Materials section. As docking typically is based on a single conformation of the target, MD simulations of the target can be used to generate multiple conformations for individual docking runs. In this scenario, each compound in the database is docked to each target conformation and the most favorable score for that compound is used for ranking as described below.
Choose a sampling method and scoring scheme for docking. The DOCK program adopts an incremental ligand construction and conformational sampling scheme which divides ligands into fragments and reassembles these fragments in the binding site in a number of different conformational poses. Scoring the binding poses uses a physical force field based scoring function that includes both van der Waals (vdW) and electrostatic terms (see Note 4 also).
Dock the entire compound database using a single crystal structure of the target or multiple conformations from MD mentioned above. Compounds are then ranked based on their interactions energies and selected for further analyses. It is suggested that multiple step VS can be used to balance the efficiency and reliability of docking results (79, 80). This approach applies a more approximate, computationally faster approach for the full database of typically > 1 million compounds from which a subset of compounds are selected for a secondary, more accurate dock screen.
When using multiple step VS with DOCK in our laboratory, the first round of docking involves a coarse but fast optimization for each compound in the database targeting one or a few target structures. 50,000 compounds are selected from this round based on the vdW attractive energy normalized for the compound molecular weight (81). In this way, compounds with maximal steric complementarity with the target are selected rather than compounds with very favorable electrostatic interaction that do not complement the shape of the binding pocket. The molecular weight normalization accounts for the tendency of ranking based on interaction energies to favor larger compounds.
The 50,000 compounds selected from the first round of VS are subject to a second round of docking using a more rigorous optimization that includes more steps of minimization and multiple protein conformations (~10) are used to take target flexibility into account. The top 1000 hits based on MW normalized total interaction energies, including both vdW and electrostatic terms are selected for further consideration. We emphasize that each compound is docked against each target conformation with the most favorable score over all the target conformations assigned to each compounds, with that score used to select the top 1000 compounds.
The final selection step is to obtain ~100 compounds for biological assays that are diverse as well as having properties that will likely have favorable ADME properties (see Note 6). Diversity is important as it will maximize the potential of selecting biologically active compounds and having diverse lead compounds will improve the probability of ultimately identifying compounds that have a high probability of success in clinical trials. The top 1000 compounds can be clustered based on chemical structure and/or physiochemical properties to maximize the chemical diversity of the selected compounds (80). Other descriptors such as Lipinski’s rule of 5 (RO5) (82) or the 4D Bioavailability (4D-BA) ranking (83) can be used as metrics of ADME to filter the final list for testing, although using rigorous cutoffs based on these metric is not advised as there are many therapeutic agents on the market that “break the rules”.
3.5 SILCS-Pharm
An alternative to docking based VS is target-based pharmacophore VS (84). This approach can quickly filter a database for potential binders to a specific bacterial target. A pharmacophore model is defined as spatially distributed chemical features that are essential for specific ligand-target binding. It represents a simplification of the detailed energetic information used by docking methods and so its computational requirements are much lower. While multiple methods can be used to generate pharmacophores (84), we will present a method based on information from SILCS as described in section 3.2. The workflow for generation of a SILCS-based pharmacophore model (73, 74) is illustrated in Figure 2.
Similar to docking VS, the desired binding site needs to be defined.
GFE FragMaps from SILCS are used as input into the SILCS-Pharm code (73, 74) to generate pharmacophore models. GFE cutoffs for FragMaps are used to define the sizes of related pharmacophore features and can be determined by visualizing FragMaps in a program such as VMD (85) and adjusting the contour value, as defined by the energy, to get well separated, local FragMap regions. If the chosen GFE contour values are too high there will be many bulky features while contour values that are too low lead to few or no pharmacophore features for VS.
During generation of the pharmacophore by the SILCS-Pharm program FragMap voxels within the defined GFE cutoffs will be clustered into intermediate SILCS features and then converted into standard pharmacophore features. The final generated pharmacophore models or hypotheses are ranked by the sum of all the feature GFEs in the model for a given number of features. More favorable GFE scores typically indicate a more effective model for use in VS as the GFE defines the strength of functional group binding obtained from the SILCS simulation. It is suggested that the most GFE favorable SILCS-Pharm model with four features can be used for VS based on tests in our lab (74).
Pharmacophore VS software such as Pharmer (52) or MOE (56) is then used to filter compounds in a database based on the selected SILCS-Pharm model. RMSD score, which represent the accordance between features in the pharmacophore model with related functional groups in a query compound, can be used to rank the final compound list.
As mentioned above, multiple, low energy conformations for each compound in the database should be pre-generated before pharmacophore VS as ligand flexibility is not included in the posing algorithm. Programs such as Open Babel (58) can be used for this purpose. 100–200 conformations for each ligand should be enough according to our in-house tests.
Once ligands are selected based on RMSD, alternate methods may be used to rank the ligands in a method referred to as consensus scoring (86). For example, SILCS ligand grid free energy (LGFE) scores (67) can be used to re-rank the list to give a free energy based ranking. The final compound list for experimental testing can be obtained by consensus scoring considering both RMSD and LGFE scores to maximize the hit potential (68).
Figure 2.

SILCS-Pharm workflow for pharmacophore based VS. The protocol starts from the SILCS simulation on the target (i), then FragMaps are generated (ii) and pharmacophore models are derived based on FragMaps (iii). The pharmacophore is then used in VS against a compound database (iv) that contains multiple conformations of each compound from which hit compounds are identified (v) and further tested in bioassays (vi).
3.6 Similarity Search
Once lead compounds are identified from experiments, LBDD methods can be utilized to start to develop an SAR or find more hit compounds. Of these, the similarity search method is the most straightforward and rapid approach (87). It can search for compounds that are chemically or physiochemically similar to the input compound, as described below. This approach may also be used as lead validation, as a compound that has multiple analogs with biological activity from which SAR can be developed is appropriate for further studies (88).
Prepare the query compound in a format the program doing similarity search can recognize. The program MOE (58) has good similarity searching capabilities.
Choose the types of fingerprint used to define the compounds in the database. The fingerprint of a molecule refers to a collection of descriptors such as structural, physical, or chemical properties that are used to define the molecule (79). Structural fingerprints, for example BIT MACCS (89) encodes information such as the presence of specific types of atoms, bonds, or rings in the molecule and can be used to identify compounds that are structurally similar to the lead, facilitating SAR development, and may have improved binding affinity (88). Physiochemical fingerprints such as MPMFP (90) encodes properties such as the free energy of solvation, polarity and molecular weight and can be used to identify compounds with dissimilar structures but similar physiochemical properties. This approach may help to identify novel hits that have activity but with a different chemical scaffold as compared to the lead compound, a process referred to as “lead hopping.” Such compounds could represent novel intellectual property (IP).
Choose a similarity comparison method and do the similarity search against an in silico database. To quantify the extent of similarity between two molecules, various similarity metrics (91) are available such as the commonly used Tanimoto coefficient (92). Such metrics allow for giant databases to be rapidly screened. Compounds that are more similar to the query compound will have higher coefficients, such that the cutoff for the coefficient can be varied to select a desired number of similar compounds for testing. With the BIT MACCS fingerprints, a compound with a TC of 0.85 or higher (over a range of 0 to 1) is likely to have biological activity similar to that of the parent, query compound.
3.7 Lead Optimization using SAR
When multiple hits for a specific bacterial target with activity data are available, structure-activity relationship (SAR) models can be developed and used to predict new compounds with improved activity (93). LBDD SAR models use regression methods to relate a set of descriptors of the lead series of compounds to their activities. The developed regression model can then be used to quantitatively predict the activity of the modified compounds (93). The descriptors can be physical or chemical properties of compounds or even geometric parameters that are representative for the spatial distributions of important functional groups in the compounds, i.e. pharmacophore features. Knowledge of the relationship of these properties to activity (i.e. SAR) can be used by the medicinal chemist to qualitatively design new, synthetically-accessible compounds that can be quantitatively evaluated. When developing SAR using pharmacophore descriptors, the appropriate conformations of the compounds that are responsible for the biological activity must be used. Here we illustrate the development of SAR using our in-house developed conformationally sampled pharmacophore (CSP) protocol (94, 95).
Langevin dynamics based MD simulations are conducted for all known hit compounds. Aqueous solvation effects of the simulated compounds can be included using explicit solvent or are treated using an implicit solvation model such as the generalized Born continuum solvent model (96). Simulations should be performed for a minimum of 10 ns with the sampling of conformations of the ligand checked for convergence. If sampling is not adequate, the simulations should be extended or conducted using enhanced sampling methods, such as Temperature or Hamiltonian Replica Exchange methods (97). Snapshots are typically saved every 0.2 ps for analysis.
Pharmacophore points, which are representative of well-conserved functional groups common in the hit compounds, such as aromatic ring centroid and hydrogen bond donor/acceptor atoms, are identified. Distances and angles between these pharmacophore points are measured throughout the trajectories from which probability distributions are obtained.
Analysis can be performed on 1- (1D) or 2-dimensional (2D) probability distributions. 1D distributions involve, for example, a distance between two important functional groups or the angle between 3 groups. 2D distributions can be between all possible distance or angle pairs. The 1D or 2D distributions are recorded for each hit compound. One hit compound, usually the most active compound, is selected as reference. To quantify the extent of similarity of the distributions, the overlap coefficients (OC) between the probability distributions of the reference compound and other compounds are calculated (95).
OCs are then used as independent variables in multiple regression analyses to fit the experimental activities. Different combinations of OCs for the various 1D and 2D pharmacophore probability distribution are regressed to identify those that yield the best correlation with the experimental data. For large training sets of compounds, multiple SAR models can be developed (95). The active compounds are usually divided into training and test set compounds with only the training set used for the SAR development, with the test set used to filter out the best SAR model. In studies of the opioids for a given set of compounds, CSP SAR models have been developed for both mu and delta efficacies (95, 98), allowing for identification of a compound that is both a mu agonist and a delta antagonist that may be of lower tolerance than opioids currently used in the clinic (99).
The regression model can be extended by the inclusion of physiochemical properties such as polar solvent accessibility, MW among others (100, 101).
The best CSP-SAR model can then be used to calculate predicted activities of query compounds and suggest the most potential compounds for further experimental tests. Ideally, multiple models are available for different activities allowing for both desirable and undesirable characteristics to be designed into the compounds, as done above with the opioids. In an ongoing study as the number of compounds for which biological activity is available increases the CSP model should be reevaluated to improve its predictability.
3.8 Single-step Free Energy Perturbation (SSFEP)
Free energy perturbation (FEP) is a higher level, computationally demanding method with increased accuracy (see Note 5) that may be used to quantify the binding free energy change related to a modification in a compound (102). To save computational time, the single step FEP (SSFEP) may be applied (103). The approach uses a pre-computed MD simulation of the hit compound-target complex from which the free energy difference due to small, single non-hydrogen atom modifications (e.g. aromatic –H to –Cl or –OH) can be rapidly evaluated (103). This is in contrast to the need for many simulations in which the chemical modification is introduced in standard FEP methods (102). SSFEP has the ability to give rapid predictions of binding affinity changes related to modifications and, thus, is quite useful for lead optimization (104). The method may be applied using the following protocol with most simulations packages.
Run five 10 ns MD simulations of the hit compound-target complex and of the hit compound alone in solution.
For the chemical modification of the hit compound build in the modification onto the compounds with all other coordinates in the ligand and the remainder of the system identical to those from the original MD simulation.
Evaluate the interaction energy of the hit compound with the full environment for both the initial, unmodified and modified states for the simulations in the presence of the target and hit compound alone in solution.
Calculate the free energy difference, ΔG, in the presence of the protein and in aqueous solution based on the free energy perturbation formula (105) or the Bennett acceptance ratio (BAR) as described elsewhere (106). The difference in the free energy differences in the presence of the protein and in aqueous solution yields the overall free energy difference, ΔΔG, due to the chemical modification.
The utility of the SSFEP approach is that the ΔΔG values for many modifications may be rapidly evaluated as the same trajectories from the original MD simulations of the hit compound are used in each case. This approach may be of use during the fine tuning of ligand affinity or specificity for a target or as required to improve physiochemical and pharmacokinetic properties without significantly altering desirable properties such as affinity.
Acknowledgments
This work was supported by NIH grant CA107331, University of Maryland Center for Biomolecular Therapeutics, Samuel Waxman Cancer Research Foundation, and the Computer-Aided Drug Design (CADD) Center at the University of Maryland, Baltimore.
Conflict of interest: A.D.M. is Co-founder and CSO of SilcsBio LLC.
Footnotes
Conformational flexibility of molecules is a very important feature no matter if it is a small ligand or a large protein. Thus conformational sampling of a protein or ligand that produces an ensemble of biological meaningful conformations is necessary either for SBDD or for LBDD. The CADD methods presented in the chapter such as SILCS for SBDD or CSP for LBDD take this issue into account and thus have advantages over other CADD methods that only rely on single crystal structure or limited ligand conformations.
MD simulation is an efficient way to generate conformational ensembles. For larger system, more advanced MD techniques can be employed to enhance the sampling efficiency such as replica exchange methods. The protocols developed in our lab such as Hamiltonian replica exchange with biasing potentials (107) and replica exchange with concurrent solute scaling and Hamiltonian biasing in one dimension (108) are efficient replica exchange methods for use to enhance the MD efficiency. However, with all MD based methods the user must perform careful analysis to assure that the conformational ensemble is adequately converged for effective use in CADD.
Protonation states of titratable residues at the targeted binding site and in the ligand being studied are quite important when setting up the CADD calculations. For example, different protonation states of histidine residues can offer different hydrogen bonding types to potential ligands. Available experimental observations and known complex structures are useful to determine the correct protonation state of protein residue upon ligand binding. Software such as Reduce can assign the most appropriate protonation state based on environment. Constant pH MD simulation (109) where protonation state of titratable residue can change during the simulation may also be useful. With respect to ligands, many computational tools for prediction of ionization state are available, though common sense by the user is often adequate to deal with the most common ionizable groups such as carboxylates.
For VS, consensus scoring can be used instead of a single scoring scheme to rank hit compounds to allow more diversity of the identified compounds (86). For example, in our SILCS-Pharm protocol, LGFE and RMSD are used together to rank compounds that pass our pharmacophore model filtering. Additional scoring metrics can include the DOCK or AUTODOCK scores (49, 50), or the average interaction energies from MD simulations, with many other variations available.
In the ligand optimization stage of CADD, as only a few compounds are under consideration, accuracy rather than computational efficiency is usually pursued. This means more sophisticated binding affinity evaluation methods should be used. These include the free energy methods such as SSFEP or the SILCS based LGFE scoring discussed above.
When constructing the final list of compound for experimental assays from VS, in addition to the binding score, drug likeness can be another criterion to further filter the list. Potential bioavailability of a compound is often judged by the Lipinski’s rule of five (RO5) (82). The 4-dimensional bioavailability (4D-BA) descriptor (83) is a scalar term derived from the four criteria in RO5 and thus facilitates the selection of potential bioavailable compounds in an automatic fashion. Pan assay interference compounds (PAINS) filter (110) can also be used to remove compounds that are likely to interfere in experimental screening techniques mainly through potential reactivity leading to false positives.
References
- 1.Cohen ML. Changing patterns of infectious disease. Nature. 2000;406:762–767. doi: 10.1038/35021206. [DOI] [PubMed] [Google Scholar]
- 2.Walsh C. Where will new antibiotics come from? Nat Rev Micro. 2003;1:65–70. doi: 10.1038/nrmicro727. [DOI] [PubMed] [Google Scholar]
- 3.Schneider G, Fechner U. Computer-based de novo design of drug-like molecules. Nat Rev Drug Discov. 2005;4:649–663. doi: 10.1038/nrd1799. [DOI] [PubMed] [Google Scholar]
- 4.Yu W, Guvench O, MacKerell AD. Computational approaches for the design of protein–protein interaction inhibitors. In: Zinzalla G, editor. Understanding and exploiting protein–protein interactions as drug targets. London, UK: Future Science Ltd; 2013. pp. 99–102. [Google Scholar]
- 5.Panecka J, Mura C, Trylska J. Interplay of the Bacterial Ribosomal A-Site, S12 Protein Mutations and Paromomycin Binding: A Molecular Dynamics Study. PLoS ONE. 2014;9:e111811. doi: 10.1371/journal.pone.0111811. [DOI] [PMC free article] [PubMed] [Google Scholar]
- 6.Resat H, Mezei M. Grand Canonical Monte Carlo Simulation of Water Positions in Crystal Hydrates. J Am Chem Soc. 1994;116:7451–7452. [Google Scholar]
- 7.Deng Y, Roux B. Computation of binding free energy with molecular dynamics and grand canonical Monte Carlo simulations. J Chem Phys. 2008;128:115103. doi: 10.1063/1.2842080. [DOI] [PubMed] [Google Scholar]
- 8.Small MC, Lopes P, Andrade RB, MacKerell AD., Jr Impact of Ribosomal Modification on the Binding of the Antibiotic Telithromycin Using a Combined Grand Canonical Monte Carlo/Molecular Dynamics Simulation Approach. PLoS Comput Biol. 2013;9:e1003113. doi: 10.1371/journal.pcbi.1003113. [DOI] [PMC free article] [PubMed] [Google Scholar]
- 9.Hossain M, Chowdhury DUS, Farhana J, Akbar MT, Chakraborty A, Islam S, Mannan A. Identification of potential targets in Staphylococcus aureus N315 using computer aided protein data analysis. Bioinformation. 2013;9:187–192. doi: 10.6026/97320630009187. [DOI] [PMC free article] [PubMed] [Google Scholar]
- 10.O’Neill MJ, Wilks A. The P. aeruginosa Heme Binding Protein PhuS Is a Heme Oxygenase Titratable Regulator of Heme Uptake. ACS Chem Biol. 2013;8:1794–1802. doi: 10.1021/cb400165b. [DOI] [PMC free article] [PubMed] [Google Scholar]
- 11.Nguyen AT, O'Neill MJ, Watts AM, Robson CL, Lamont IL, Wilks A, Oglesby-Sherrouse AG. Adaptation of Iron Homeostasis Pathways by a Pseudomonas aeruginosa Pyoverdine Mutant in the Cystic Fibrosis Lung. J Bacteriol. 2014;196:2265–2276. doi: 10.1128/JB.01491-14. [DOI] [PMC free article] [PubMed] [Google Scholar]
- 12.Nguyen AT, Jones JW, Ruge MA, Kane MA, Oglesby-Sherrouse AG. Iron depletion enhances production of antimicrobials by Pseudomonas aeruginosa. J Bacteriol. 2015 doi: 10.1128/JB.00072-15. [DOI] [PMC free article] [PubMed] [Google Scholar]
- 13.Furci LM, Lopes P, Eakanunkul S, Zhong S, MacKerell AD, Wilks A. Inhibition of the Bacterial Heme Oxygenases from Pseudomonas aeruginosa and Neisseria meningitidis: Novel Antimicrobial Targets. J Med Chem. 2007;50:3804–3813. doi: 10.1021/jm0700969. [DOI] [PubMed] [Google Scholar]
- 14.Hom K, Heinzl GA, Eakanunkul S, Lopes PEM, Xue F, MacKerell AD, Wilks A. Small Molecule Antivirulents Targeting the Iron-Regulated Heme Oxygenase (HemO) of P. aeruginosa. J Med Chem. 2013;56:2097–2109. doi: 10.1021/jm301819k. [DOI] [PMC free article] [PubMed] [Google Scholar]
- 15.O’Daniel PI, Peng Z, Pi H, Testero SA, Ding D, Spink E, Leemans E, Boudreau MA, Yamaguchi T, Schroeder VA, Wolter WR, Llarrull LI, Song W, Lastochkin E, Kumarasiri M, Antunes NT, Espahbodi M, Lichtenwalter K, Suckow MA, Vakulenko S, Mobashery S, Chang M. Discovery of a New Class of Non-β-lactam Inhibitors of Penicillin-Binding Proteins with Gram-Positive Antibacterial Activity. J Am Chem Soc. 2014;136:3664–3672. doi: 10.1021/ja500053x. [DOI] [PMC free article] [PubMed] [Google Scholar]
- 16.Velvadapu V, Paul T, Wagh B, Klepacki D, Guvench O, MacKerell A, Andrade RB. Desmethyl Macrolides: Synthesis and Evaluation of 4,8,10-Tridesmethyl Telithromycin. ACS Med Chem Lett. 2011;2:68–72. doi: 10.1021/ml1002184. [DOI] [PMC free article] [PubMed] [Google Scholar]
- 17.Glassford I, Lee M, Wagh B, Velvadapu V, Paul T, Sandelin G, DeBrosse C, Klepacki D, Small MC, MacKerell AD, Andrade RB. Desmethyl Macrolides: Synthesis and Evaluation of 4-Desmethyl Telithromycin. ACS Med Chem Lett. 2014;5:1021–1026. doi: 10.1021/ml5002097. [DOI] [PMC free article] [PubMed] [Google Scholar]
- 18.Wagh B, Paul T, DeBrosse C, Klepacki D, Small MC, MacKerell AD, Andrade RB. Desmethyl Macrolides: Synthesis and Evaluation of 4,8,10-Tridesmethyl Cethromycin. ACS Med Chem Lett. 2013;4:1114–1118. doi: 10.1021/ml400337t. [DOI] [PMC free article] [PubMed] [Google Scholar]
- 19.Varney KM, Bonvin AMJJ, Pazgier M, Malin J, Yu W, Ateh E, Oashi T, Lu W, Huang J, Diepeveen-de Buin M, Bryant J, Breukink E, MacKerell AD, Jr, de Leeuw EPH. Turning Defense into Offense: Defensin Mimetics as Novel Antibiotics Targeting Lipid II. PLoS Pathog. 2013;9:e1003732. doi: 10.1371/journal.ppat.1003732. [DOI] [PMC free article] [PubMed] [Google Scholar]
- 20.Fletcher S, Yu W, Huang J, Kwasny SM, Chauhan J, Opperman TJ, M AD, Jr, Leeuw EPd. Structure-activity exploration of a small-molecule Lipid II inhibitor. Drug Des Dev Ther. 2015;9:2383–2394. doi: 10.2147/DDDT.S79504. [DOI] [PMC free article] [PubMed] [Google Scholar]
- 21.Shijun Z, Alba TM, Alexander DM. Computational Identification of Inhibitors of Protein-Protein Interactions. Curr Top Med Chem. 2007;7:63–82. doi: 10.2174/156802607779318334. [DOI] [PubMed] [Google Scholar]
- 22.Shim J, MacKerell JAD. Computational ligand-based rational design: role of conformational sampling and force fields in model development. MedChemComm. 2011;2:356–370. doi: 10.1039/C1MD00044F. [DOI] [PMC free article] [PubMed] [Google Scholar]
- 23.Ekins S, Boulanger B, Swaan P, Hupcey MZ. Towards a new age of virtual ADME/TOX and multidimensional drug discovery. J Comput Aided Mol Des. 2002;16:381–401. doi: 10.1023/a:1020816005910. [DOI] [PubMed] [Google Scholar]
- 24.Sliwoski G, Kothiwale S, Meiler J, Lowe EW. Computational Methods in Drug Discovery. Pharmacol Rev. 2014;66:334–395. doi: 10.1124/pr.112.007336. [DOI] [PMC free article] [PubMed] [Google Scholar]
- 25.Van Drie J. Computer-aided drug design: the next 20 years. J Comput Aided Mol Des. 2007;21:591–601. doi: 10.1007/s10822-007-9142-y. [DOI] [PubMed] [Google Scholar]
- 26.Cavasotto CN, editor. Silico Drug Discovery and Design: Theory, Methods, Challenges, and Applications. Boca Raton: CRC Press; 2015. [Google Scholar]
- 27.Brooks BR, Brooks CL, Mackerell AD, Nilsson L, Petrella RJ, Roux B, Won Y, Archontis G, Bartels C, Boresch S, Caflisch A, Caves L, Cui Q, Dinner AR, Feig M, Fischer S, Gao J, Hodoscek M, Im W, Kuczera K, Lazaridis T, Ma J, Ovchinnikov V, Paci E, Pastor RW, Post CB, Pu JZ, Schaefer M, Tidor B, Venable RM, Woodcock HL, Wu X, Yang W, York DM, Karplus M. CHARMM: The biomolecular simulation program. J Comput Chem. 2009;30:1545–1614. doi: 10.1002/jcc.21287. [DOI] [PMC free article] [PubMed] [Google Scholar]
- 28.Case DA, Cheatham TE, Darden T, Gohlke H, Luo R, Merz KM, Onufriev A, Simmerling C, Wang B, Woods RJ. The Amber biomolecular simulation programs. J Comput Chem. 2005;26:1668–1688. doi: 10.1002/jcc.20290. [DOI] [PMC free article] [PubMed] [Google Scholar]
- 29.Phillips JC, Braun R, Wang W, Gumbart J, Tajkhorshid E, Villa E, Chipot C, Skeel RD, Kalé L, Schulten K. Scalable molecular dynamics with NAMD. J Comput Chem. 2005;26:1781–1802. doi: 10.1002/jcc.20289. [DOI] [PMC free article] [PubMed] [Google Scholar]
- 30.Van Der Spoel D, Lindahl E, Hess B, Groenhof G, Mark AE, Berendsen HJC. GROMACS: Fast, flexible, and free. J Comput Chem. 2005;26:1701–1718. doi: 10.1002/jcc.20291. [DOI] [PubMed] [Google Scholar]
- 31.Eastman P, Friedrichs MS, Chodera JD, Radmer RJ, Bruns CM, Ku JP, Beauchamp KA, Lane TJ, Wang L-P, Shukla D, Tye T, Houston M, Stich T, Klein C, Shirts MR, Pande VS. OpenMM 4: A Reusable, Extensible, Hardware Independent Library for High Performance Molecular Simulation. J Chem Theory Comput. 2013;9:461–469. doi: 10.1021/ct300857j. [DOI] [PMC free article] [PubMed] [Google Scholar]
- 32.Bernstein FC, Koetzle TF, Williams GJB, Meyer EF, Jr, Brice MD, Rodgers JR, Kennard O, Shimanouchi T, Tasumi M. The protein data bank: A computer-based archival file for macromolecular structures. J Mol Biol. 1977;112:535–542. doi: 10.1016/s0022-2836(77)80200-3. [DOI] [PubMed] [Google Scholar]
- 33.Sali A, Blundell TL. Comparative protein modelling by satisfaction of spatial restraints. J Mol Biol. 1993;234:779–815. doi: 10.1006/jmbi.1993.1626. [DOI] [PubMed] [Google Scholar]
- 34.Biasini M, Bienert S, Waterhouse A, Arnold K, Studer G, Schmidt T, Kiefer F, Cassarino TG, Bertoni M, Bordoli L, Schwede T. SWISS-MODEL: modelling protein tertiary and quaternary structure using evolutionary information. Nucleic Acids Research. 2014;42:W252–W258. doi: 10.1093/nar/gku340. [DOI] [PMC free article] [PubMed] [Google Scholar]
- 35.MacKerell AD, Bashford D, Bellott M, Dunbrack RL, Evanseck JD, Field MJ, Fischer S, Gao J, Guo H, Ha S, Joseph-McCarthy D, Kuchnir L, Kuczera K, Lau FTK, Mattos C, Michnick S, Ngo T, Nguyen DT, Prodhom B, Reiher WE, Roux B, Schlenkrich M, Smith JC, Stote R, Straub J, Watanabe M, Wiórkiewicz-Kuczera J, Yin D, Karplus M. All-Atom Empirical Potential for Molecular Modeling and Dynamics Studies of Proteins. J Phys Chem B. 1998;102:3586–3616. doi: 10.1021/jp973084f. [DOI] [PubMed] [Google Scholar]
- 36.Best RB, Zhu X, Shim J, Lopes PEM, Mittal J, Feig M, MacKerell AD. Optimization of the Additive CHARMM All-Atom Protein Force Field Targeting Improved Sampling of the Backbone ϕ, ψ and Side-Chain χ1 and χ2 Dihedral Angles. J Chem Theory Comput. 2012;8:3257–3273. doi: 10.1021/ct300400x. [DOI] [PMC free article] [PubMed] [Google Scholar]
- 37.Vanommeslaeghe K, Hatcher E, Acharya C, Kundu S, Zhong S, Shim J, Darian E, Guvench O, Lopes P, Vorobyov I, Mackerell AD. CHARMM general force field: A force field for drug-like molecules compatible with the CHARMM all-atom additive biological force fields. J Comput Chem. 2010;31:671–690. doi: 10.1002/jcc.21367. [DOI] [PMC free article] [PubMed] [Google Scholar]
- 38.Yu W, He X, Vanommeslaeghe K, MacKerell AD. Extension of the CHARMM general force field to sulfonyl-containing compounds and its utility in biomolecular simulations. J Comput Chem. 2012;33:2451–2468. doi: 10.1002/jcc.23067. [DOI] [PMC free article] [PubMed] [Google Scholar]
- 39.Cornell WD, Cieplak P, Bayly CI, Gould IR, Merz KM, Ferguson DM, Spellmeyer DC, Fox T, Caldwell JW, Kollman PA. A Second Generation Force Field for the Simulation of Proteins, Nucleic Acids, and Organic Molecules. J Am Chem Soc. 1995;117:5179–5197. [Google Scholar]
- 40.Wang J, Wolf RM, Caldwell JW, Kollman PA, Case DA. Development and testing of a general amber force field. J Comput Chem. 2004;25:1157–1174. doi: 10.1002/jcc.20035. [DOI] [PubMed] [Google Scholar]
- 41.Vanommeslaeghe K, MacKerell AD. Automation of the CHARMM General Force Field (CGenFF) I: Bond Perception and Atom Typing. J Chem Inf Model. 2012;52:3144–3154. doi: 10.1021/ci300363c. [DOI] [PMC free article] [PubMed] [Google Scholar]
- 42.Vanommeslaeghe K, Raman EP, MacKerell AD. Automation of the CHARMM General Force Field (CGenFF) II: Assignment of Bonded Parameters and Partial Atomic Charges. J Chem Inf Model. 2012;52:3155–3168. doi: 10.1021/ci3003649. [DOI] [PMC free article] [PubMed] [Google Scholar]
- 43.Wang J, Wang W, Kollman PA, Case DA. Automatic atom type and bond type perception in molecular mechanical calculations. J Mol Graph Model. 2006;25:247–260. doi: 10.1016/j.jmgm.2005.12.005. [DOI] [PubMed] [Google Scholar]
- 44.Vanommeslaeghe K, Guvench O, MacKerell AD. Molecular Mechanics. Curr Pharm Des. 2014;20:3281–3292. doi: 10.2174/13816128113199990600. [DOI] [PMC free article] [PubMed] [Google Scholar]
- 45.Vanommeslaeghe K, MacKerell AD., Jr CHARMM additive and polarizable force fields for biophysics and computer-aided drug design. Biochimica et Biophysica Acta (BBA) - General Subjects. 2015;1850:861–871. doi: 10.1016/j.bbagen.2014.08.004. [DOI] [PMC free article] [PubMed] [Google Scholar]
- 46.Zhong S, MacKerell AD. Binding Response: A Descriptor for Selecting Ligand Binding Site on Protein Surfaces. J Chem Inf Model. 2007;47:2303–2315. doi: 10.1021/ci700149k. [DOI] [PubMed] [Google Scholar]
- 47.Brylinski M, Skolnick J. A threading-based method (FINDSITE) for ligand-binding site prediction and functional annotation. Proceedings of the National Academy of Sciences. 2008;105:129–134. doi: 10.1073/pnas.0707684105. [DOI] [PMC free article] [PubMed] [Google Scholar]
- 48.Capra JA, Laskowski RA, Thornton JM, Singh M, Funkhouser TA. Predicting Protein Ligand Binding Sites by Combining Evolutionary Sequence Conservation and 3D Structure. PLoS Comput Biol. 2009;5:e1000585. doi: 10.1371/journal.pcbi.1000585. [DOI] [PMC free article] [PubMed] [Google Scholar]
- 49.Ewing TA, Makino S, Skillman AG, Kuntz I. DOCK 4.0: Search strategies for automated molecular docking of flexible molecule databases. J Comput Aided Mol Des. 2001;15:411–428. doi: 10.1023/a:1011115820450. [DOI] [PubMed] [Google Scholar]
- 50.Morris GM, Huey R, Lindstrom W, Sanner MF, Belew RK, Goodsell DS, Olson AJ. AutoDock4 and AutoDockTools4: Automated docking with selective receptor flexibility. J Comput Chem. 2009;30:2785–2791. doi: 10.1002/jcc.21256. [DOI] [PMC free article] [PubMed] [Google Scholar]
- 51.Trott O, Olson AJ. AutoDock Vina: Improving the speed and accuracy of docking with a new scoring function, efficient optimization, and multithreading. J Comput Chem. 2010;31:455–461. doi: 10.1002/jcc.21334. [DOI] [PMC free article] [PubMed] [Google Scholar]
- 52.Koes DR, Camacho CJ. Pharmer: Efficient and Exact Pharmacophore Search. J Chem Inf Model. 2011;51:1307–1314. doi: 10.1021/ci200097m. [DOI] [PMC free article] [PubMed] [Google Scholar]
- 53.Irwin JJ, Sterling T, Mysinger MM, Bolstad ES, Coleman RG. ZINC: A Free Tool to Discover Chemistry for Biology. J Chem Inf Model. 2012;52:1757–1768. doi: 10.1021/ci3001277. [DOI] [PMC free article] [PubMed] [Google Scholar]
- 54. http://www.chembridge.com and http://www.chemdiv.com/ [Google Scholar]
- 55.Discovery Studio Modeling Environment. San Diego: Dassault Systèmes BIOVIA; 2015. http://accelrys.com/ [Google Scholar]
- 56.OEChem. Santa Fe: OpenEye Scientific Software, Inc; 2015. www.eyesopen.com. [Google Scholar]
- 57.Schrödinger Softwares. New York: Schrödinger, LLC; 2015. http://www.schrodinger.com. [Google Scholar]
- 58.Molecular Operating Environment (MOE) Montreal: Chemical Computing Group Inc; 2016. https://www.chemcomp.com. [Google Scholar]
- 59.Martin YC. 3D database searching in drug design. J Med Chem. 1992;35:2145–2154. doi: 10.1021/jm00090a001. [DOI] [PubMed] [Google Scholar]
- 60.Jorgensen WL. Efficient Drug Lead Discovery and Optimization. Acc Chem Res. 2009;42:724–733. doi: 10.1021/ar800236t. [DOI] [PMC free article] [PubMed] [Google Scholar]
- 61.Allen MP, Tildesley DJ. Computer Simulation of Liquids. Oxford: Oxford University Press; 1987. pp. 1–383. [Google Scholar]
- 62.Jo S, Kim T, Iyer VG, Im W. CHARMM-GUI: A web-based graphical user interface for CHARMM. J Comput Chem. 2008;29:1859–1865. doi: 10.1002/jcc.20945. [DOI] [PubMed] [Google Scholar]
- 63.Word JM, Lovell SC, Richardson JS, Richardson DC. Asparagine and glutamine: using hydrogen atom contacts in the choice of side-chain amide orientation. J Mol Biol. 1999;285:1735–1747. doi: 10.1006/jmbi.1998.2401. [DOI] [PubMed] [Google Scholar]
- 64.Karpen ME, Tobias DJ, Brooks CL. Statistical clustering techniques for the analysis of long molecular dynamics trajectories: analysis of 2.2-ns trajectories of YPGDV. Biochemistry. 1993;32:412–420. doi: 10.1021/bi00053a005. [DOI] [PubMed] [Google Scholar]
- 65.Guvench O, MacKerell AD., Jr Computational Fragment-Based Binding Site Identification by Ligand Competitive Saturation. PLoS Computational Biology. 2009;5:e1000435. doi: 10.1371/journal.pcbi.1000435. [DOI] [PMC free article] [PubMed] [Google Scholar]
- 66.Raman EP, Yu W, Guvench O, MacKerell AD. Reproducing Crystal Binding Modes of Ligand Functional Groups Using Site-Identification by Ligand Competitive Saturation (SILCS) Simulations. J Chem Inf Model. 2011;51:877–896. doi: 10.1021/ci100462t. [DOI] [PMC free article] [PubMed] [Google Scholar]
- 67.Raman EP, Yu W, Lakkaraju SK, MacKerell AD. Inclusion of Multiple Fragment Types in the Site Identification by Ligand Competitive Saturation (SILCS) Approach. J Chem Inf Model. 2013;53:3384–3398. doi: 10.1021/ci4005628. [DOI] [PMC free article] [PubMed] [Google Scholar]
- 68.Faller C, Raman EP, MacKerell A, Jr, Guvench O. Site Identification by Ligand Competitive Saturation (SILCS) Simulations for Fragment-Based Drug Design. In: Klon AE, editor. Fragment-Based Methods in Drug Discovery. New York: Springer; 2015. pp. 75–87. [DOI] [PMC free article] [PubMed] [Google Scholar]
- 69.Lakkaraju SK, Raman EP, Yu W, MacKerell AD. Sampling of Organic Solutes in Aqueous and Heterogeneous Environments Using Oscillating Excess Chemical Potentials in Grand Canonical-like Monte Carlo-Molecular Dynamics Simulations. J Chem Theory Comput. 2014;10:2281–2290. doi: 10.1021/ct500201y. [DOI] [PMC free article] [PubMed] [Google Scholar]
- 70.Lakkaraju SK, Yu W, Raman EP, Hershfeld AV, Fang L, Deshpande DA, MacKerell AD. Mapping Functional Group Free Energy Patterns at Protein Occluded Sites: Nuclear Receptors and G-Protein Coupled Receptors. J Chem Inf Model. 2015;55:700–708. doi: 10.1021/ci500729k. [DOI] [PMC free article] [PubMed] [Google Scholar]
- 71.Foster TJ, MacKerell AD, Guvench O. Balancing target flexibility and target denaturation in computational fragment-based inhibitor discovery. J Comput Chem. 2012;33:1880–1891. doi: 10.1002/jcc.23026. [DOI] [PMC free article] [PubMed] [Google Scholar]
- 72.Arfken G. Mathematical Methods for Physicists. 3rd. Orlando: Academic Press; 1985. The Method of Steepest Descents; pp. 428–436. [Google Scholar]
- 73.Yu W, Lakkaraju S, Raman EP, MacKerell A., Jr Site-Identification by Ligand Competitive Saturation (SILCS) assisted pharmacophore modeling. J Comput Aided Mol Des. 2014;28:491–507. doi: 10.1007/s10822-014-9728-0. [DOI] [PMC free article] [PubMed] [Google Scholar]
- 74.Yu W, Lakkaraju SK, Raman EP, Fang L, MacKerell AD. Pharmacophore Modeling Using Site-Identification by Ligand Competitive Saturation (SILCS) with Multiple Probe Molecules. J Chem Inf Model. 2015;55:407–420. doi: 10.1021/ci500691p. [DOI] [PMC free article] [PubMed] [Google Scholar]
- 75.O'Boyle N, Banck M, James C, Morley C, Vandermeersch T, Hutchison G. Open Babel: An open chemical toolbox. J Cheminf. 2011;3:33. doi: 10.1186/1758-2946-3-33. [DOI] [PMC free article] [PubMed] [Google Scholar]
- 76.RDKit: Cheminformatics and Machine Learning Software. 2015 http://rdkit.org/ [Google Scholar]
- 77.Halgren TA. Merck molecular force field. I. Basis, form, scope, parameterization, and performance of MMFF94. J Comput Chem. 1996;17:490–519. [Google Scholar]
- 78.Kitchen DB, Decornez H, Furr JR, Bajorath J. Docking and scoring in virtual screening for drug discovery: methods and applications. Nat Rev Drug Discov. 2004;3:935–949. doi: 10.1038/nrd1549. [DOI] [PubMed] [Google Scholar]
- 79.Zhong S, Oashi T, Yu W, Shapiro P, MacKerell AD., Jr . Protein-Ligand Interactions. Wiley-VCH Verlag GmbH & Co. GaA; 2012. Prospects of Modulating Protein–Protein Interactions; pp. 295–329. [Google Scholar]
- 80.Zhong S, Chen X, Zhu X, Dziegielewska B, Bachman KE, Ellenberger T, Ballin JD, Wilson GM, Tomkinson AE, MacKerell AD. Identification and Validation of Human DNA Ligase Inhibitors Using Computer-Aided Drug Design. J Med Chem. 2008;51:4553–4562. doi: 10.1021/jm8001668. [DOI] [PMC free article] [PubMed] [Google Scholar]
- 81.Pan Y, Huang N, Cho S, MacKerell AD. Consideration of Molecular Weight during Compound Selection in Virtual Target-Based Database Screening. J Chem Inf Comput Sci. 2003;43:267–272. doi: 10.1021/ci020055f. [DOI] [PubMed] [Google Scholar]
- 82.Lipinski CA, Lombardo F, Dominy BW, Feeney PJ. Experimental and computational approaches to estimate solubility and permeability in drug discovery and development settings1. Adv Drug Delivery Rev. 2001;46:3–26. doi: 10.1016/s0169-409x(00)00129-0. [DOI] [PubMed] [Google Scholar]
- 83.Oashi T, Ringer AL, Raman EP, MacKerell AD., Jr Automated Selection of Compounds with Physicochemical Properties To Maximize Bioavailability and Druglikeness. Journal of Chemical Information and Modeling. 2011;51:148–158. doi: 10.1021/ci100359a. [DOI] [PMC free article] [PubMed] [Google Scholar]
- 84.Koes D. Methods in Pharmacology and Toxicology. Humana Press; 2015. Pharmacophore Modeling: Methods and Applications; pp. 1–22. [Google Scholar]
- 85.Humphrey W, Dalke A, Schulten K. VMD: Visual molecular dynamics. J. Molec Graphics. 1996;14:33–38. doi: 10.1016/0263-7855(96)00018-5. [DOI] [PubMed] [Google Scholar]
- 86.Wang R, Wang S. How Does Consensus Scoring Work for Virtual Library Screening? An Idealized Computer Experiment. J Chem Inf Comput Sci. 2001;41:1422–1426. doi: 10.1021/ci010025x. [DOI] [PubMed] [Google Scholar]
- 87.Sheridan RP, Kearsley SK. Why do we need so many chemical similarity search methods? Drug Discov Today. 2002;7:903–911. doi: 10.1016/s1359-6446(02)02411-x. [DOI] [PubMed] [Google Scholar]
- 88.Macias AT, Mia MY, Xia G, Hayashi J, MacKerell AD. Lead Validation and SAR Development via Chemical Similarity Searching: Application to Compounds Targeting the pY+3 Site of the SH2 Domain of p56lck. J Chem Inf Model. 2005;45:1759–1766. doi: 10.1021/ci050225z. [DOI] [PubMed] [Google Scholar]
- 89.Durant JL, Leland BA, Henry DR, Nourse JG. Reoptimization of MDL Keys for Use in Drug Discovery. J Chem Inf Comput Sci. 2002;42:1273–1280. doi: 10.1021/ci010132r. [DOI] [PubMed] [Google Scholar]
- 90.Xue L, Godden JW, Stahura FL, Bajorath J. Design and Evaluation of a Molecular Fingerprint Involving the Transformation of Property Descriptor Values into a Binary Classification Scheme. J Chem Inf Comput Sci. 2003;43:1151–1157. doi: 10.1021/ci030285+. [DOI] [PubMed] [Google Scholar]
- 91.Todeschini R, Consonni V, Xiang H, Holliday J, Buscema M, Willett P. Similarity Coefficients for Binary Chemoinformatics Data: Overview and Extended Comparison Using Simulated and Real Data Sets. J Chem Inf Model. 2012;52:2884–2901. doi: 10.1021/ci300261r. [DOI] [PubMed] [Google Scholar]
- 92.Tanimoto T. An elementary mathematical theory of classification and prediction. IBM Internal Report. 1958 [Google Scholar]
- 93.Gedeck P, Kramer C, Ertl P. 4 - Computational Analysis of Structure-Activity Relationships. In: Lawton G, Witty DR, editors. Progress in Medicinal Chemistry. Elsevier; 2010. pp. 113–160. [DOI] [PubMed] [Google Scholar]
- 94.Bernard D, Coop A, MacKerell AD. 2D Conformationally Sampled Pharmacophore: A Ligand-Based Pharmacophore To Differentiate δ Opioid Agonists from Antagonists. J Am Chem Soc. 2003;125:3101–3107. doi: 10.1021/ja027644m. [DOI] [PubMed] [Google Scholar]
- 95.Bernard D, Coop A, MacKerell AD. Quantitative Conformationally Sampled Pharmacophore for δ Opioid Ligands: Reevaluation of Hydrophobic Moieties Essential for Biological Activity. J Med Chem. 2007;50:1799–1809. doi: 10.1021/jm0612463. [DOI] [PMC free article] [PubMed] [Google Scholar]
- 96.Qiu D, Shenkin PS, Hollinger FP, Still WC. The GB/SA Continuum Model for Solvation. A Fast Analytical Method for the Calculation of Approximate Born Radii. J Phys Chem A. 1997;101:3005–3014. [Google Scholar]
- 97.Sugita Y, Okamoto Y. Replica-exchange molecular dynamics method for protein folding. Chem Phys Lett. 1999;314:141–151. [Google Scholar]
- 98.Shim J, Coop A, MacKerell AD. Consensus 3D Model of μ-Opioid Receptor Ligand Efficacy Based on a Quantitative Conformationally Sampled Pharmacophore. J Phys Chem B. 2011;115:7487–7496. doi: 10.1021/jp202542g. [DOI] [PMC free article] [PubMed] [Google Scholar]
- 99.Healy JR, Bezawada P, Shim J, Jones JW, Kane MA, MacKerell AD, Coop A, Matsumoto RR. Synthesis, Modeling, and Pharmacological Evaluation of UMB 425, a Mixed μ Agonist/δ Antagonist Opioid Analgesic with Reduced Tolerance Liabilities. ACS Chem Neurosci. 2013;4:1256–1266. doi: 10.1021/cn4000428. [DOI] [PMC free article] [PubMed] [Google Scholar]
- 100.Rais R, Acharya C, Tririya G, MacKerell AD, Polli JE. Molecular Switch Controlling the Binding of Anionic Bile Acid Conjugates to Human Apical Sodium-Dependent Bile Acid Transporter. J Med Chem. 2010;53:4749–4760. doi: 10.1021/jm1003683. [DOI] [PMC free article] [PubMed] [Google Scholar]
- 101.Chayan A, Andrew C, James EP, Alexander DM. Recent Advances in Ligand-Based Drug Design: Relevance and Utility of the Conformationally Sampled Pharmacophore Approach. Curr Comput Aided Drug Des. 2011;7:10–22. doi: 10.2174/157340911793743547. [DOI] [PMC free article] [PubMed] [Google Scholar]
- 102.Chipot C, Pohorille A, editors. Free Energy Calculations: Theory and Applications in Chemistry and Biology. New York: Springer; 2007. [Google Scholar]
- 103.Liu H, Mark AE, van Gunsteren WF. Estimating the Relative Free Energy of Different Molecular States with Respect to a Single Reference State. J Phys Chem. 1996;100:9485–9494. [Google Scholar]
- 104.Raman EP, Vanommeslaeghe K, MacKerell AD. Site-Specific Fragment Identification Guided by Single-Step Free Energy Perturbation Calculations. J Chem Theory Comput. 2012;8:3513–3525. doi: 10.1021/ct300088r. [DOI] [PMC free article] [PubMed] [Google Scholar]
- 105.Zwanzig RW. High-Temperature Equation of State by a Perturbation Method. I. Nonpolar Gases. J Chem Phys. 1954;22:1420–1426. [Google Scholar]
- 106.Shirts MR, Chodera JD. Statistically optimal analysis of samples from multiple equilibrium states. J Chem Phys. 2008;129:124105. doi: 10.1063/1.2978177. [DOI] [PMC free article] [PubMed] [Google Scholar]
- 107.Yang M, MacKerell AD. Conformational Sampling of Oligosaccharides Using Hamiltonian Replica Exchange with Two-Dimensional Dihedral Biasing Potentials and the Weighted Histogram Analysis Method (WHAM) J Chem Theory Comput. 2015;11:788–799. doi: 10.1021/ct500993h. [DOI] [PMC free article] [PubMed] [Google Scholar]
- 108.Yang M, Huang J, MacKerell AD. Enhanced Conformational Sampling Using Replica Exchange with Concurrent Solute Scaling and Hamiltonian Biasing Realized in One Dimension. J Chem Theory Comput. 2015;11:2855–2867. doi: 10.1021/acs.jctc.5b00243. [DOI] [PMC free article] [PubMed] [Google Scholar]
- 109.Khandogin J, Brooks CL. Constant pH Molecular Dynamics with Proton Tautomerism. Biophys J. 2005;89:141–157. doi: 10.1529/biophysj.105.061341. [DOI] [PMC free article] [PubMed] [Google Scholar]
- 110.Baell JB, Holloway GA. New Substructure Filters for Removal of Pan Assay Interference Compounds (PAINS) from Screening Libraries and for Their Exclusion in Bioassays. J Med Chem. 2010;53:2719–2740. doi: 10.1021/jm901137j. [DOI] [PubMed] [Google Scholar]