Abstract
The segmented genome of influenza B virus allows exchange of gene segments between cocirculating strains. Through this process of reassortment, diversity is generated by the mixing of genes between viruses that differ in one or more gene segments. Phylogenetic and evolutionary analyses of all 11 genes of 31 influenza B viruses isolated from 1979 to 2003 were used to study the evolution of whole genomes. All 11 genes diverged into two new lineages prior to 1987. All genes except the NS1 gene were undergoing linear evolution, although the rate of evolution and the degree to which nucleotide changes translated into amino acid changes varied between lineages and by gene. Frequent reassortment generated 14 different genotypes distinct from the gene constellation of viruses circulating prior to 1979. Multiple genotypes cocirculated in some locations, and a sequence of reassortment events over time could not be established. The surprising diversity of the viruses, unrestricted mixing of lineages, and lack of evidence for coevolution of gene segments do not support the hypothesis that the reassortment process is driven by selection for functional differences.
Influenza B virus is a member of the family Orthomyxoviridae and contains a single-stranded, negative sense, segmented genome. The eight gene segments code for 11 proteins: segments 1, 2, and 3 code for the polymerase proteins, PB1, PB2, and PA; segment 4 codes for the attachment glycoprotein hemagglutinin, HA; segment 5 codes for the nucleoprotein, NP; segment 6 codes for the neuraminidase enzyme, NA, and an integral membrane protein, NB; segment 7 codes for the matrix protein, M1, and an ion channel, M2; and segment 8 codes for the nonstructural protein, NS1, and the nuclear export protein, NEP or NS2. Epidemics of influenza B virus occur regularly but are not as prominent on a yearly basis as are epidemics of influenza A virus (21). Although clinical disease from influenza B virus is indistinguishable from that from influenza A virus (6, 12), the overall clinical attack rate and the attack rate in adults are lower from influenza B (7, 8, 21). The antigenic stability of the influenza B virus HA (1) and similar clinical attack rates in children for influenza A and influenza B (8, 21) argue that this difference in epidemiology in adults and the sporadic nature of influenza B virus epidemics is due to population-based immunity.
Early reports describing influenza B virus evolution focused on the HA gene. Sequencing of the HA1 region of a number of viruses suggested that the HA gene had evolved into two separate lineages sometime before 1983, with both lineages distinct from the HA genes of viruses that circulated from 1940 to 1973 (24, 25). These viruses were found to cocirculate at times in the same location (14, 25), although in some years viruses with HAs from each lineage could be found only in isolated regions of the world (20). However, the segmented genome of influenza viruses allows genetic exchange to occur by a process called reassortment, where gene segments from different viruses infecting the same host can mix. It was soon recognized that reassortment was occurring between cocirculating influenza B viruses and that the division into lineages extended to the other seven gene segments as well (16, 18, 20). Studies have shown that reassortment contributes to the diversity of influenza B viruses, and a potential functional advantage of these nascent reassortant viruses was postulated as an explanation for the recurrence of epidemics despite the relative antigenic stability of HA (16, 20).
Prior evolutionary studies of influenza B viruses have focused on a limited number of genes or gene segments and their relationships to each other (16, 18, 20). The two lineages of these various genes, as well as the viruses that bear them, have been referred to as either Yamagata 88-like or Victoria 87-like, after two viruses with representative HAs from the original descriptions B/Yamagata/16/88 (Yam88) and B/Victoria/2/87 (Vic87) (25). However, the complexity generated from the reassortment of multiple gene segments has made identification of viruses by the HA lineage alone insufficient. For example, Yam88 has an NS segment from the same lineage as Vic87 (18) and is therefore a reassortant itself and not representative of later viruses from the same HA lineage. Differences in the gene constellation beyond the HA gene may be important in some circumstances, such as vaccine strain selection, when a change in NA by reassortment may alter the antigenicity of the vaccine if it is not changed to correspond (4, 20). In this report, we examined the evolution of entire influenza B virus genomes, comparing 31 viruses isolated from 1979 to 2003 from both Asia and the United States. We found great diversity from reassortment and described multiple genotypes based on the mixing of gene segments from both lineages. This approach has given us insight into the evolution of individual genes and of whole viruses.
MATERIALS AND METHODS
Viruses.
Sequencing and construction of phylogenetic trees were done for the coding regions of the HA and NA genes of the following 36 influenza B viruses isolated between 1989 and 2003 from various areas in China and the United States: B/Memphis/3/89, B/Nashville/6/89, B/Houston/1/91, B/Nashville/45/91, B/Guangzhou/86/92, B/Houston/1/92, B/Sichuan/8/92, B/Houston/2/93, B/Nanchang/26/93, B/Memphis/5/93, B/Nanchang/195/94, B/Nanchang/560/94, B/Nanchang/630/94, B/Memphis/18/95, B/Nanchang/3/95, B/Nanchang/15/95, B/Memphis/19/96, B/Memphis/21/96, B/Nanchang/6/96, B/Nanchang/20/96, B/Nashville/3/96, B/Nanchang/2/97, B/Nanchang/4/97, B/Nanchang/5/97, B/Nanchang/15/97, B/Nanchang/6/98, B/Nanchang/7/98, B/Nanchang/12/98, B/Memphis/8/99, B/Maryland/1/01, B/Memphis/1/01, B/Memphis/3/01, B/Nebraska/1/01, B/Nebraska/2/01, B/Los Angeles/1/02, and B/Memphis/13/03. Thirteen of these viruses were selected based on diversity in country of isolation, year of isolation, and lineages of HA and NA. The full coding regions of all genes of these selected viruses were sequenced and analyzed along with eighteen others for which the entire coding regions excepting the HA2 region of the HA gene were available in GenBank or the Influenza Sequence Database (ISD) (19). Viruses utilized in the study are listed in Table 1 along with abbreviations. Several of these viruses, i.e., Nor84, Iba85, Aic88, Gua93, Gua94, Har94, Hen97, and Shi98, required sequencing of the coding regions of gene segment 6 to complete the analysis. Rus69 was included as a representative of viruses from the period before the separation into the two HA lineages that currently circulate; other viruses isolated prior to 1979 were not analyzed. Viruses Mem93, Mem97, Mar01, Neb101, Neb201, LA02, and Mem03 were isolated in Madin-Darby canine kidney (MDCK) or Rhesus monkey kidney cells, passaged exclusively in MDCK cells, and utilized at the third or fourth passage. All other viruses have been passaged in both embryonated chicken eggs and MDCK cells and were used between the second and fifth passages.
TABLE 1.
Virus abbreviations and accession numbers of sequences used in this studya
All accession numbers are for GenBank except Rus69 sequences, which are found only in the ISD. Accession numbers in bold indicate a sequence that was determined for this study.
Nucleotide sequencing.
Nucleotide sequencing was done using standard methodologies as described previously (20). Briefly, RNA was transcribed to cDNA by using Uni12-primer (AGC AAA AGC AGG), and the cDNA was then amplified by using segment-specific primers. Reverse transcription-PCR products were purified with a QIAquick PCR purification kit (QIAGEN, Chatsford, Calif.), sequenced by Taq Dye Terminator chemistry according to manufacturer's instructions (Applied Biosystems, Inc.), and then analyzed on an ABI 373 DNA sequencer. The open reading frames of all 11 genes of the eight gene segments of the viruses were completely sequenced. Sequences were assembled using the Lasergene Seqman package II (version 5.05; DNASTAR, Madison, Wis.).
Phylogenetic and evolutionary analysis.
Phylogenetic trees were constructed by using the neighbor-joining method (26) and bootstrap analysis (n = 500) to determine the best-fitting tree for each gene. Nucleotide distances were estimated by using the method of Tajima and Nei (29) and evolutionary trees drawn using TREECON software (TREECON for Windows, version 1.3b) (30). Nucleotide and amino acid substitution rates for lineages of individual genes were estimated by determining the evolutionary distance (number of substitutions per site) of each virus from the putative node of divergence at the “root” and plotting against the year of isolation. The slope of the best-fitting line was determined by regression analysis and reported along with the coefficient of correlation for the slope of the plot. As a measure of the strength of the data, a slope was reported only if it was positive and the coefficient of correlation was greater than or equal to 0.75. The percentage of nucleotide differences from the putative node of divergence that code for amino acid changes was calculated for the lineages of individual genes and compared using two-way analysis of variance corrected for multiple tests. A P value of <0.01 was considered significant for this comparison.
Nucleotide sequence accession numbers.
Nucleotide sequence data accession numbers for sequences determined for this study are listed in Table 1, along with accession numbers for previously reported sequences utilized in this study (2, 3, 5, 9, 10, 13, 14, 16, 17, 22-25, 28, 31, 33) and unpublished sequence data for viruses Rus69 (D. Katinger, J. Romanova, and A. Egorov), Mie93 (R. Nerome, M. Ishida, M. Matsumoto, Y. Hiromoto, and N. Tanabe), and Mem97 (J. A. McCullers). Nucleotide sequence data accession numbers for sequences determined for this study but not included in Table 1 are as follows for the HA and NA genes, respectively: for B/Nashville/6/89, AF129895 and AF129907; for B/Nashville/45/91, AY581946 and AY581987; for B/Guangzhou/86/92, AY581947 and AY581988; for B/Houston/1/92 AF129899 and AF129912; for B/Sichuan/8/92, AF129898 and AF129911; for B/Houston/2/93, AF129900 and AF129914; for B/Nanchang/26/93, AF134911 and AF134906; for B/Nanchang/195/94, AY581948 and AY581992; for B/Memphis/18/95, AF129891 and AF129918; for B/Nanchang/3/95, AY581951 and AY581995; for B/Nanchang/15/95, AY581952 and AY581996; for B/Memphis/19/96, AF129905 and AF129920; for B/Memphis/21/96, AY581954 and AY581998; for B/Nanchang/20/96, AY581955 and AY581999; for B/Nashville/3/96, AF129906 and AF129922; for B/Nanchang/4/97, AY581957 and AY582004; for B/Nanchang/5/97, AF134915 and AF134910; for B/Nanchang/15/97, AY581958 and AY582005; for B/Nanchang/7/98, AY581960 and AY582007; for B/Nanchang/12/98, AY581961 and AY582008; for B/Memphis/8/99, AY581962 and AY582010; for B/Memphis/1/01, AY581964 and AY582013; and for B/Memphis/3/01, AY581965 and AY582014.
RESULTS
Phylogenetic analysis of influenza B virus genes.
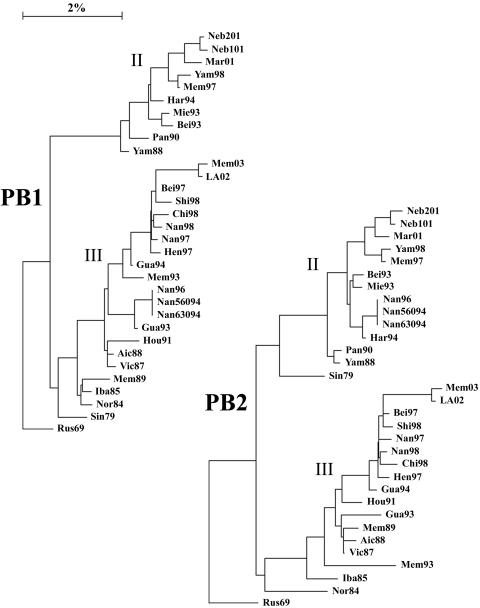
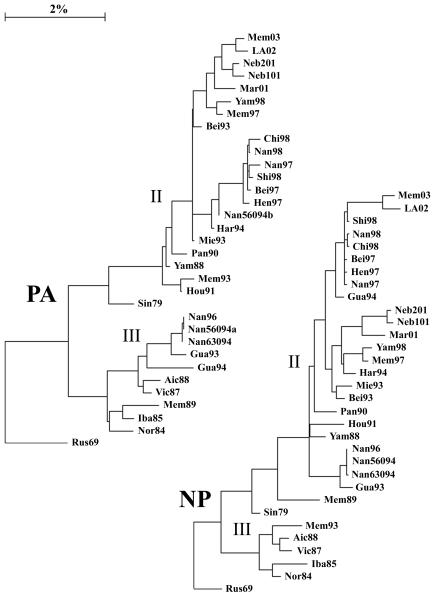
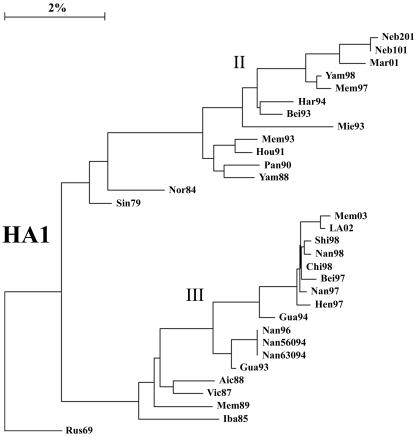
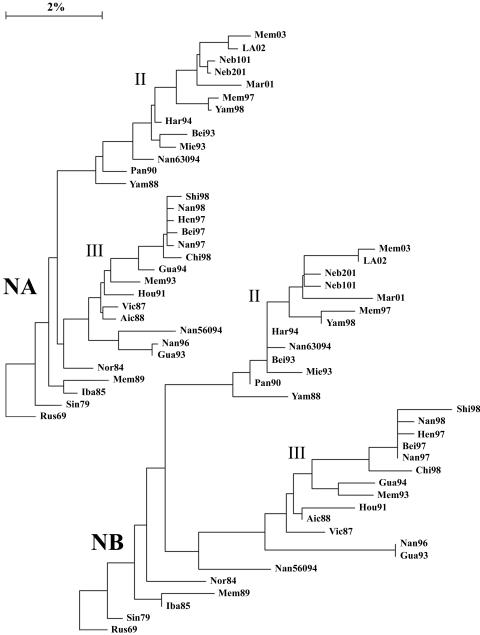
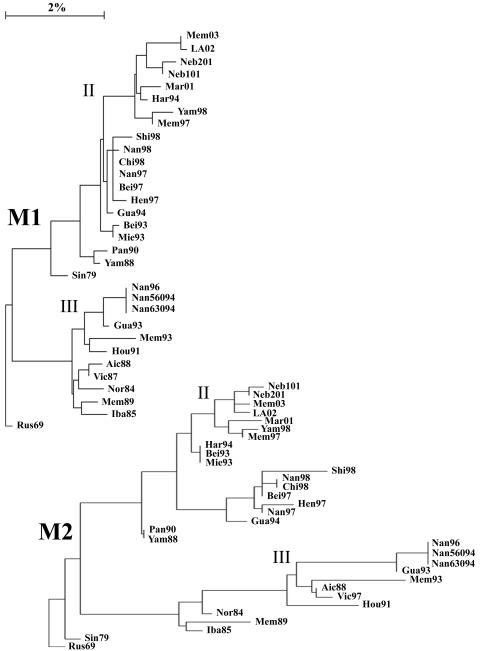
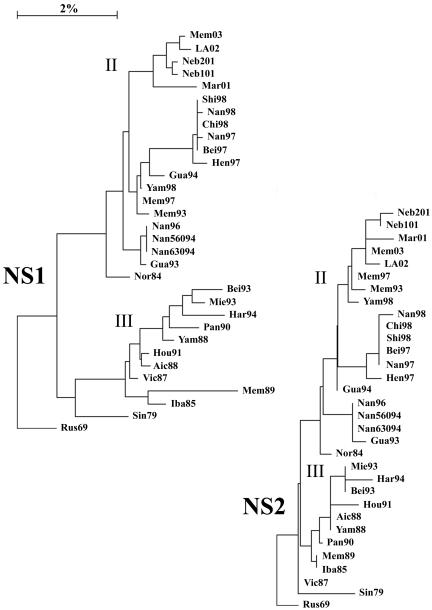
The complete genomes of 31 viruses isolated between 1979 and 2003 with HA genes from lineages II and III were compared, excepting the HA2 region of the HA, for which there is very little sequence information. Lineage designations for the HA1 region were taken from Lindstrom et al. (16), such that HA genes that were grouped together before the divergence into the two currently circulating lineages are designated lineage I, Vic87-like HA genes are designated lineage III, and Yam88-like HA genes are designated lineage II. For consistency, lineages in all other genes were assigned the same way, with early viruses as lineage I, the lineage that contained Vic87 designated lineage III, and the other current lineages designated lineage II. Vic87 and Yam88 were chosen as lineage-defining viruses based on the convention established in earlier reports (20, 24, 25), although Iba85 has a gene constellation similar to that of Vic87 and roots closer to the putative node of divergence. Rus69 was used as a root in the construction of phylogenetic trees, as it is the lineage I virus closest to the node of divergence for the majority of genes. Analysis of the nucleotide sequences of the PB1 (Fig. 1), PB2 (Fig. 1), PA (Fig. 2), HA (Fig. 3), NP (Fig. 2), NA (Fig. 4), NB (Fig. 4), M1 (Fig. 5), M2 (Fig. 5), NS1 (Fig. 6), and NS2 (Fig. 6) genes demonstrated a divergence by 1987 into two new lineages. For most genes, i.e., PB1, PB2, PA, NP, HA, M1, and NS1, this divergence occurred earlier, by 1979. Analysis of the 18 HA genes for which full-length sequences are available did not alter the location of those genes in the phylogenetic tree (data not shown).
FIG. 1.
Phylogenetic trees constructed using the neighbor-joining method and bootstrap analysis (n = 500) to determine the best-fitting tree for the PB1 and PB2 genes. Nucleotide distances were estimated by the method described by Tajima and Nei (29) and by using evolutionary trees drawn with TREECON software. The bar indicates a 2% difference at the nucleotide level.
FIG. 2.
Phylogenetic trees constructed using the neighbor-joining method and bootstrap analysis (n = 500) to determine the best-fitting tree for the PA and NP genes.
FIG. 3.
Phylogenetic tree constructed using the neighbor-joining method and bootstrap analysis (n = 500) to determine the best-fitting tree for the HA1 region of the HA gene.
FIG. 4.
Phylogenetic trees constructed using the neighbor-joining method and bootstrap analysis (n = 500) to determine the best-fitting tree for the NA and NB genes.
FIG. 5.
Phylogenetic trees constructed using the neighbor-joining method and bootstrap analysis (n = 500) to determine the best-fitting tree for the M1 and M2 genes.
FIG. 6.
Phylogenetic trees constructed using the neighbor-joining method and bootstrap analysis (n = 500) to determine the best-fitting tree for the NS1 and NS2 genes.
A division into sublineages is evident for some genes, all of which are within lineage II. These sublineages are represented in the PA gene by Bei93 and Har94 (Fig. 2) (bootstrap confidence level, 100%), in the NP gene by Bei93 and Gua94 (Fig. 2) (bootstrap confidence level, 96%), and in the M2 gene by Gua94 and Har94 (Fig. 5) (bootstrap confidence level, 82%). The NS1 and NS2 genes, similar to the NS segment of influenza A viruses (15), are not undergoing linear evolution (Fig. 6). No clear sublineages are evident for lineage III genes, and in many genes lineage III has not been seen for several years. Lineage III NP has been absent since 1993, NS1 and NS2 have been absent since 1995 (18), PA has been absent since 1996, and M1 and M2 have been absent since 1996. Lineage III HA was found only in mainland China from 1992 to 2000 but reemerged worldwide in 2001 to 2002 (27). The continued evolution and increasing diversity of lineage II genes coupled with the disappearance of lineage III genes may indicate a selective advantage for lineage II or may be an artifact of the limited sequence data available for many influenza B virus genes.
Two separate PA genes were recovered from the quasispecies population of Nan56094, first egg passage (the original clinical material was not available for testing). Two viruses could be plaque purified from this stock, and seven of their gene segments were identical, but each possessed a different PA gene. The first virus isolated is considered to be B/Nanchang/560/94, and the PA genes are labeled “a ” and “b ” to differentiate them (Nan56094 contains the a gene). It is uncertain whether these two viruses existed separately in nature, whether they existed together as a quasispecies, or whether the second PA gene is a remnant of a different virus from which only this gene segment was recovered through laboratory reassortment during the initial passage. The two PA genes are found in separate lineages in the phylogenetic tree (Fig. 2).
Amino acid differences between lineages II and III.
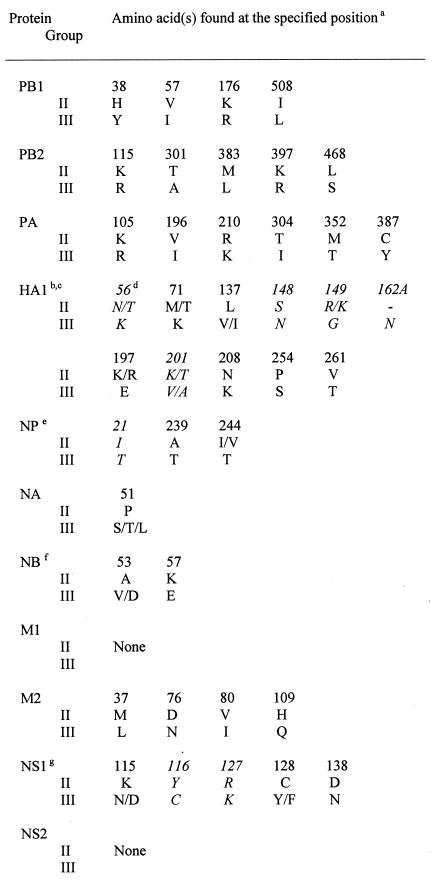
The predicted amino acid sequences of lineage II and III genes from this study were analyzed to identify sites where they consistently differed. This analysis was then extended to all full-length sequences in the ISD from viruses isolated after 1986. The PB1, PB2, PA, NB, and M2 genes had four, five, six, two, and four lineage-specific amino acids, respectively, all of which could be generalized to all sequences in the ISD (Fig. 7). The NP gene had three lineage-specific amino acids, and the NS1 gene had five lineage-specific amino acids, although some exceptions existed in the ISD for lineage II NP genes at position 21 and lineage II NS1 genes at positions 116 and 127. The HA1 gene had 11 lineage-specific amino acids, 6 of which could be generalized to all 722 full-length HA1 sequences in the ISD. The high number of exceptions may be due to increased antigenic variability of this protein or may be a function of the number of sequences available for examination. Interestingly, the NA gene had only one lineage-specific amino acid, although several other positions were very commonly lineage specific (for lineages II and III: position 44, E versus K; position 70, G versus E; position 71, V versus M; position 73, L versus F; position 88, P versus Q; position 106, T versus A). The exceptions are rare and appear to be reversions at those positions, most of which are in a set of viruses whose NA genes cluster together, i.e., Gua93, Nan56094, and Nan96. The M1 and NS2 genes had no lineage-specific amino acids; these genes separate into lineages at the nucleotide level but are highly conserved at the amino acid level.
FIG. 7.
Amino acids specific for group 2 or group 3 lineages. a, numbering of amino acids is relative to B/Lee/40 beginning at the start of the coding region of each protein. b, differences were determined for the entire coding sequence of all proteins except HA, where only the region coding for HA1 was used (analysis of the limited number of full-length HA sequences available indicates that no lineage-specific differences are seen in the HA2 region). c, group 2 HA1 sequences in the ISD may also have a D, A, or K at position 56; a T at position 71; an N at position 148; a G at position 149; an N, R, or A at position 201; an S or D at position 208; or an I at position 261. Group 3 HA1 sequences may also have had a K at position 56 or an S, D, or no amino acid at position 162A. d, amino acids in italics are lineage specific within the viruses studied in this report, but exceptions exist within sequences found in the ISD, as further detailed here. For this determination, 30 post-1986 sequences each were examined for PB1, PB2, and PA; 722 sequences were examined for HA; 36 sequences were examined for NP; 119 sequences were examined for NA and NB; 36 sequences were examined for M1 and M2; and 80 sequences were examined for NS1 and NS2. e, group 2 NP sequences in the ISD may also have a T at position 21. f, group 2 NB sequences in the ISD may also have a T at position 53. g, group 2 NS1 sequences in the ISD may also have a C at position 116 or a K at position 127. -, no amino acid.
Evolutionary rates.
Evolutionary rates were determined for each gene and its corresponding protein separately for each lineage (Table 2). All genes in both lineages except the NS1 gene were found to be evolving linearly at the nucleotide level. At the amino acid level, the NB, M2, HA, and NA genes are clearly evolving in a linear fashion. The lineage II and III M1 proteins are identical at the amino acid level, and either very low or indeterminate evolution was occurring for the PB1, PB2, PA, NP, NS1, and NS2 proteins. The HA1 protein of lineage II is evolving faster than that of lineage III at both the nucleotide and amino acid levels, but there is not a clear difference in the amino acid rates for any other protein.
TABLE 2.
Evolutionary rates of influenza B virus genes and percentage nucleotide differences that cause amino acid changes
| Protein | Group | Nucleotide substitution ratea (nt/site/yr [10−3]) (CC)c | Amino acid substitution ratea (aa/site/yr [10−3]) (CC) | % Nucleotide differences coding for amino acid changes ± SDb |
|---|---|---|---|---|
| PB1 | II | 1.11 (0.96) | 0.45 (0.86) | 10.1 ± 1.5 |
| III | 0.90 (0.96) | NDd | 8.6 ± 2.4 | |
| PB2 | II | 0.71 (0.96) | ND | 5.3 ± 1.5 |
| III | 0.97 (0.97) | 0.25 (0.85) | 8.5 ± 0.9f | |
| PA | II | 0.84 (0.90) | ND | 17.6 ± 1.6 |
| III | 1.07 (0.92) | ND | 17.3 ± 1.7 | |
| HA1e | II | 2.34 (0.99) | 2.63 (0.98) | 42.8 ± 2.8 |
| III | 1.15 (0.97) | 0.83 (0.84) | 41.4 ± 2.9 | |
| NP | II | 0.98 (0.97) | ND | 12.9 ± 1.7 |
| III | 0.70 (0.95) | ND | 23.8 ± 3.8f | |
| NA | II | 1.66 (0.96) | 1.54 (0.94) | 34.6 ± 2.3 |
| III | 1.33 (0.99) | 1.61 (0.96) | 34.2 ± 3.8 | |
| NB | II | 1.32 (0.87) | 3.04 (0.81) | 77.0 ± 4.2f |
| III | 2.41 (0.94) | 3.72 (0.94) | 59.0 ± 12.4 | |
| M1 | II | 0.93 (0.96) | ND | 1.3 ± 2.9 |
| III | 0.49 (0.76) | ND | 1.8 ± 4.3 | |
| M2 | II | 1.70 (0.84) | 2.40 (0.78) | 56.4 ± 6.2f |
| III | 3.06 (0.93) | 2.52 (0.83) | 26.2 ± 4.2 | |
| NS1 | II | ND | ND | 48.4 ± 3.8 |
| III | ND | ND | 44.7 ± 5.7 | |
| NS2 | II | 0.72 (0.78) | 1.26 (0.80) | 27.5 ± 12.7 |
| III | 1.09 (0.79) | ND | 27.0 ± 8.4 |
Nucleotide and amino acid substitution rates were estimated by determining the evolutionary distance of each virus from the putative node of divergence and plotting it against year of isolation.
Values are percentages of nucleotide differences from the putative node of divergence that code for amino acid changes.
CC, correlation coefficient for the slope of the plot.
ND, not determined. Evolutionary rates could not be estimated because either the slope was negative or the coefficient of correlation was less than 0.75.
Rates were determined for the entire coding sequence of all proteins except HA, where only the region coding for HA1 was used.
P < 0.01 compared to the other group for a given protein.
To determine whether amino acid changes in the two lineages were random or due to selection, the percentage of nucleotide differences coding for amino acid changes was determined for each lineage of each gene (Table 2). The PB1, PB2, PA, and M1 genes appear to be under negative selection, as their percentage of nucleotide differences coding for amino acid changes is less than 24%, the expected rate if selection is random (1). The HA1, NA, NB, and NS1 genes are under positive selection by this measure. The NS2 gene appears neutral, the NP gene may be under negative selection, and the M2 gene may be under positive selection depending on which lineage is examined. The lineage II NB and M2 genes and the lineage III PB2 and NP genes have a significantly higher percentage of nucleotide changes coding for amino acid substitutions than their corresponding genes from other lineages.
Genotypes of influenza B virus.
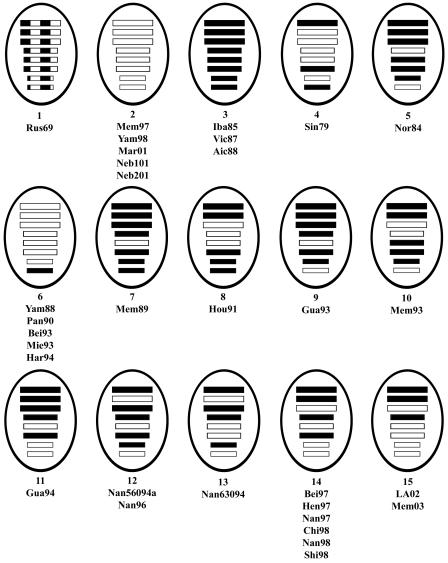
At least 15 separate genotypes based on the lineage of the eight gene segments were identified from the 32 viruses examined in this study (Fig. 8). A 16th genotype is possible if the Nan560b PA is considered in the background in which it was isolated (data not shown). Although the selection of the viruses included in the study was not random, it is clear from these results that reassortment among influenza B viruses is a common event and that a great diversity of gene constellations exists. Of the 56 theoretical pairings of a lineage II gene segment with the other seven lineage III gene segments, a surprisingly high 47 actual pairings are seen. The lineage III NP segment is not seen paired with the lineage II PB2, NA, or M segments, and the lineage II PB1 segment is not seen paired with the lineage III PB2, PA, HA, NP, NA, and M segments. Thus, most possible pairings are present despite the small sample size, suggesting that few if any functional restrictions on reassortment exist.
FIG. 8.
Genotypes of influenza B viruses. Hatched boxes represent lineage I genes, open boxes represent lineage II genes, and filled boxes represent lineage III genes. From top to bottom, the boxes within each virus diagram represent the lineage of gene segments 1 through 8, which code for PB1, PB2, PA, HA, NP, NA and NB, M1 and M2, and NS1 and NS2.
Lack of evidence for coevolution of gene segments.
If strain- or lineage-specific differences in proteins are functionally important, reassortment may create mismatches that decrease the fitness of the resulting virus. We hypothesized that coevolution of gene segments whose proteins cooperate functionally would lead to reversions at strain-specific amino acids, including those that are common but not completely penetrant in all sequences, following reassortment. We examined several theoretical reassortment events for this phenomenon. Since the polymerase genes PB1, PB2, and PA operate as a functional unit, HA and NA are known to require matching of activity, and the matrix protein physically associates with HA and NA during assembly and budding, we chose these interactions to test our hypothesis. We first examined changes that may have occurred in the lineage II PA gene when it underwent a theoretical reassortment event, moving from genotype 2 and 6 (PA) or 3, 7, 9, and 11 (PB1 and PB2) viruses to genotype 8, 10, 14, and 15 viruses, where it was mismatched with lineage III PB1 and PB2 sequences (Fig. 8). No reversions were detected in any of the polymerase genes of lineage 8, 10, 14, or 15 viruses, as the lineage II PA sequence did not change at any position to lineage III amino acids, and the lineage III PB1 and PB2 sequences did not change at any position to lineage II sequences. Similar analyses were done for the mismatch of lineage II PB2 with lineage III PB1 and PA, lineage II HA with lineage III NA, lineage II NA with lineage III HA, lineage II HA with lineage III M, and lineage II M with lineage III HA and NA. After lengthy analysis, we could find no evidence that reversions occurred after these theoretical reassortment events (data not shown). Therefore, we see no support for this hypothesis at present. It is possible that the gene segments are coevolving at other, distinct positions, although no candidates were apparent after careful examination of the sequences.
DISCUSSION
Influenza A viruses cause yearly epidemics related to antigenic drift of their surface glycoproteins (32). Although linear evolution of the influenza B virus HA is occurring, there is no similar, established pattern of influenza B virus epidemics. In some years influenza B viruses are the predominant influenza viruses isolated worldwide, and in others they are virtually absent from the population. It has been suggested that reassortment contributes to the diversity of influenza B viruses, potentially providing an explanation for this observed epidemiology (16, 20). Thus, antigenic change in HA may be less important for evolution than acquisition of other genes by reassortment. Previous reports exploring the evolution and diversity of influenza B viruses have focused on a single gene, typically the HA gene, or a limited set of genes (1, 4, 10, 16, 18, 20, 22, 24, 25, 33). This is the first report that considers the viral genome as a whole and examines the relationships between strains based on comparisons of all eight gene segments.
Analysis of the entire genomes of 31 influenza B viruses isolated between 1979 and 2003 revealed a high degree of genetic diversity generated by reassortment. Fourteen genotypes could be distinguished within these viruses. These genotypes appear to be the result of reassortment events between a theoretical genotype 2 virus that contributed seven gene segments to Yam88 and a theoretical genotype 3 virus similar to Vic87, which took all eight gene segments from lineage III (Fig. 8). While the Yam88 virus did not derive all eight gene segments from lineage II, a later reassortment event generated a set of genotype 2 viruses that circulated worldwide between 1996 and 2001 that did (Fig. 8). Individual genes, excepting the NS1 gene, were undergoing linear evolution during the 20-year period that was studied, although the rate of evolution differed depending on the lineage and the specific gene. The degree to which these nucleotide changes translated into amino acid changes also varied by lineage and by gene.
It is tempting to speculate that the sequence of reassortment and evolution of genotypes can be inferred from an examination of the gene constellation of individual viruses and the year of isolation. Thus, a genotype 3 virus may have acquired a lineage II NP segment prior to 1989 to generate genotype 7, which acquired a lineage II NS segment between 1989 and 1993 to generate genotype 9, which sequentially led to genotypes 11, 14, and then 15. Similarly, a theoretical genotype 2 virus likely gained a lineage III NS segment to generate genotype 6, which later took back a lineage II NS segment to form the group of genotype 2 viruses that circulated in the late 1990s. However, there is little evidence to support this set of assumptions, and the viruses could easily have been created another way. For example, it might be assumed that genotype 15 viruses were generated by reassortment between genotype 14 viruses and a source of a gene segment 6 from lineage III (Fig. 8), particularly since genotype 15 viruses cluster so closely to genotype 14 when the phylogenetic tree for HA1 is examined (Fig. 3). However, analysis of the trees for the other genes demonstrates that the PA (Fig. 2) and the M1 and M2 (Fig. 5) genes likely derive from a different set of viruses, as the genotype 15 virus genes are found in different sublineages from the genotype 14 viruses.
One manner by which reassortment could contribute to evolution is by providing a functional advantage for the new viruses. However, proof of a biological difference between the different genotypes, such as differences in growth or pathogenicity, is lacking. Therefore, the alternate explanation that reassortment is random and does not impact the fitness of the virus can also be argued. A number of observations from this study suggest this conclusion. Most possible pairings of gene segments between lineages were seen, and the absence of the others is likely explained by the sample size and the disappearance of some lineage III gene segments from circulation. Although the selection of viruses for study was not random, a large number of genotypes could be detected by studying relatively few isolates. The genes in different lineages are closely related; examination of the polymerase genes reveals that even the most divergent genes are 94% identical at the nucleotide level and 97 to 98% identical at the amino acid level. Finally, we could find no evidence for coevolution of genes, which might be expected if functional mismatches occur during reassortment. However, the dominance of lineage II gene segments over lineage III in terms of length of circulation and continued evolution supports a functional difference for at least some of these genes. The study of potential biological differences between artificial reassortants created by reverse genetics (11) will be necessary to answer this question.
One advantage of our method for selecting viruses was that representatives from both Asia and North America could be studied and compared. Both lineages of all genes were seen in both the Asian and the North American viruses, indicating frequent mixing between these pools of viruses. Examples from both regions are also seen in most of the identified sublineages. It is clear that multiple genotypes can circulate in a single location at once. Five different genotypes circulated together in China in 1993 and 1994, while at least two circulated in Memphis in 1996 (20). However, individual genotypes were more likely to be confined to a single region. For example, genotype 14 viruses were found only in Japan and China, while genotype 15 viruses were found only in the United States. This result is most likely an artifact of sampling bias, but it also may reflect regional circulation of certain genotypes following reassortment events. More viruses will have to be sequenced to understand the global distribution of genotypes.
One of the questions that this study can help to address is the sequestration of gene segments away from the general pool of viruses that are sampled annually. Lindstrom et al. (16) observed a 9-year gap in the lineage II NS gene segment between 1984 and 1993, a 5-year gap in the lineage III M gene segment between 1988 and 1993, and the disappearance of the lineage III M gene segment after 1993. This result is partially explained by the limited number of influenza B viruses which have been sequenced, as only seven sequences are available for the NS gene segment from viruses isolated between 1984 and 1993 (five at the time of the report), and thus the gap may be by chance. This appears to be the explanation for the gap in the lineage III M gene's appearances, since the sequences in this report add viruses to that lineage in 1989, 1991, 1994, and 1996. However, multiple instances of lineage gaps of 3 to 4 years can be found even with the expanded pool of sequences provided in this report. This question and the question of whether the lineage III genes that have not been seen in recent years are currently circulating at low levels in regions that are not frequently sampled or are gone from the population remain open.
Acknowledgments
These studies were supported by the Cancer Center Support Grant (CA-21765) at St. Jude Children's Research Hospital and the American Lebanese Syrian Associated Charities.
REFERENCES
- 1.Air, G. M., A. J. Gibbs, W. G. Laver, and R. G. Webster. 1990. Evolutionary changes in influenza B are not primarily governed by antibody selection. Proc. Natl. Acad. Sci. USA 87:3884-3888. [DOI] [PMC free article] [PubMed] [Google Scholar]
- 2.Air, G. M., W. G. Laver, M. Luo, S. J. Stray, G. Legrone, and R. G. Webster. 1990. Antigenic, sequence, and crystal variation in influenza B neuraminidase. Virology 177:578-587. [DOI] [PubMed] [Google Scholar]
- 3.Akoto-Amanfu, E., N. Sivasubramanian, and D. P. Nayak. 1987. Primary structure of the polymerase acidic (PA) gene of an influenza B virus (B/Sing/222/79). Virology 159:147-153. [DOI] [PubMed] [Google Scholar]
- 4.Barr, I. G., N. Komadina, A. Hurt, R. Shaw, C. Durrant, P. Iannello, C. Tomasov, H. Sjogren, and A. W. Hampson. 2003. Reassortants in recent human influenza A and B isolates from South East Asia and Oceania. Virus Res. 98:35-44. [DOI] [PubMed] [Google Scholar]
- 5.Burmeister, W. P., F. Baudin, S. Cusack, and R. W. Ruigrok. 1993. Comparison of structure and sequence of influenza B/Yamagata and B/Beijing neuraminidases shows a conserved “head” but much greater variability in the “stalk” and NB protein. Virology 192:683-686. [DOI] [PubMed] [Google Scholar]
- 6.Burnet, F. M., J. D. Stone, and S. G. Anderson. 1946. An epidemic of influenza B in Australia. Lancet 250:807-811. [DOI] [PubMed] [Google Scholar]
- 7.Fox, J. P., C. E. Hall, M. K. Cooney, and H. M. Foy. 1982. Influenzavirus infections in Seattle families, 1975-1979. I. Study design, methods and the occurrence of infections by time and age. Am. J. Epidemiol. 116:212-227. [DOI] [PubMed] [Google Scholar]
- 8.Hall, C. E., M. K. Cooney, and J. P. Fox. 1973. The Seattle virus watch. IV. Comparative epidemiologic observations of infections with influenza A and B viruses, 1965-1969, in families with young children. Am. J. Epidemiol. 98:365-380. [DOI] [PubMed] [Google Scholar]
- 9.Hiebert, S. W., M. A. Williams, and R. A. Lamb. 1986. Nucleotide sequence of RNA segment 7 of influenza B/Singapore/222/79: maintenance of a second large open reading frame. Virology 155:747-751. [DOI] [PubMed] [Google Scholar]
- 10.Hiromoto, Y., T. Saito, S. E. Lindstrom, Y. Li, R. Nerome, S. Sugita, M. Shinjoh, and K. Nerome. 2000. Phylogenetic analysis of the three polymerase genes (PB1, PB2 and PA) of influenza B virus. J. Gen. Virol. 81:929-937. [DOI] [PubMed] [Google Scholar]
- 11.Hoffmann, E., K. Mahmood, C. F. Yang, R. G. Webster, H. B. Greenberg, and G. Kemble. 2002. Rescue of influenza B virus from eight plasmids. Proc. Natl. Acad. Sci. USA 99:11411-11416. [DOI] [PMC free article] [PubMed] [Google Scholar]
- 12.Jackson, W. P. U. 1946. Influenza-B among West Indians—outbreaks in the Bahamas and in England. Lancet 251:631-635. [DOI] [PubMed] [Google Scholar]
- 13.Jambrina, E., J. Barcena, O. Uez, and A. Portela. 1997. The three subunits of the polymerase and the nucleoprotein of influenza B virus are the minimum set of viral proteins required for expression of a model RNA template. Virology 235:209-217. [DOI] [PubMed] [Google Scholar]
- 14.Kanegae, Y., S. Sugita, A. Endo, M. Ishida, S. Senya, K. Osako, K. Nerome, and A. Oya. 1990. Evolutionary pattern of the hemagglutinin gene of influenza B viruses isolated in Japan: cocirculating lineages in the same epidemic season. J. Virol. 64:2860-2865. [DOI] [PMC free article] [PubMed] [Google Scholar]
- 15.Lindstrom, S. E., Y. Hiromoto, R. Nerome, K. Omoe, S. Sugita, Y. Yamazaki, T. Takahashi, and K. Nerome. 1998. Phylogenetic analysis of the entire genome of influenza A (H3N2) viruses from Japan: evidence for genetic reassortment of the six internal genes. J. Virol. 72:8021-8031. [DOI] [PMC free article] [PubMed] [Google Scholar]
- 16.Lindstrom, S. E., Y. Hiromoto, H. Nishimura, T. Saito, R. Nerome, and K. Nerome. 1999. Comparative analysis of evolutionary mechanisms of the hemagglutinin and three internal protein genes of influenza B virus: multiple cocirculating lineages and frequent reassortment of the NP, M, and NS genes. J. Virol. 73:4413-4426. [DOI] [PMC free article] [PubMed] [Google Scholar]
- 17.Londo, D. R., A. R. Davis, and D. P. Nayak. 1983. Complete nucleotide sequence of the nucleoprotein gene of influenza B virus. J. Virol. 47:642-648. [DOI] [PMC free article] [PubMed] [Google Scholar]
- 18.Luo, C., T. Morishita, K. Satou, Y. Tateno, K. Nakajima, and E. Nobusawa. 1999. Evolutionary pattern of influenza B viruses based on the HA and NS genes during 1940 to 1999: origin of the NS genes after 1997. Arch. Virol. 144:1881-1891. [DOI] [PubMed] [Google Scholar]
- 19.Macken, C., H. Lu, J. Goodman, and L. Boykin. 2001. The value of a database in surveillance and vaccine selection, p. 103-106. In A. D. M. E. Osterhaus, N. Cox, and A. Hampson (ed.), Options for the control of influenza IV. Elsevier Science, Amsterdam, The Netherlands.
- 20.McCullers, J. A., G. C. Wang, S. He, and R. G. Webster. 1999. Reassortment and insertion-deletion are strategies for the evolution of influenza B viruses in nature. J. Virol. 73:7343-7348. [DOI] [PMC free article] [PubMed] [Google Scholar]
- 21.Monto, A. S., and F. Kioumehr. 1975. The Tecumseh Study of Respiratory Illness. IX. Occurence of influenza in the community, 1966-1971. Am. J. Epidemiol. 102:553-563. [DOI] [PubMed] [Google Scholar]
- 22.Nerome, R., Y. Hiromoto, S. Sugita, N. Tanabe, M. Ishida, M. Matsumoto, S. E. Lindstrom, T. Takahashi, and K. Nerome. 1998. Evolutionary characteristics of influenza B virus since its first isolation in 1940: dynamic circulation of deletion and insertion mechanism. Arch. Virol. 143:1569-1583. [DOI] [PubMed] [Google Scholar]
- 23.Robbins, P. A., P. A. Rota, and S. Z. Shapiro. 1997. A broad cytotoxic T lymphocyte response to influenza type B virus presented by multiple HLA molecules. Int. Immunol. 9:815-823. [DOI] [PubMed] [Google Scholar]
- 24.Rota, P. A., M. L. Hemphill, T. Whistler, H. L. Regnery, and A. P. Kendal. 1992. Antigenic and genetic characterization of the haemagglutinins of recent cocirculating strains of influenza B virus. J. Gen. Virol. 73:2737-2742. [DOI] [PubMed] [Google Scholar]
- 25.Rota, P. A., T. R. Wallis, M. W. Harmon, J. S. Rota, A. P. Kendal, and K. Nerome. 1990. Cocirculation of two distinct evolutionary lineages of influenza type B virus since 1983. Virology 175:59-68. [DOI] [PubMed] [Google Scholar]
- 26.Saitou, M., and M. Nei. 1987. The neighbor-joining method: a new method for reconstructing phylogenetic trees. Mol. Biol. Evol. 4:406-425. [DOI] [PubMed] [Google Scholar]
- 27.Shaw, M. W., X. Xu, Y. Li, S. Normand, R. T. Ueki, G. Y. Kunimoto, H. Hall, A. Klimov, N. J. Cox, and K. Subbarao. 2002. Reappearance and global spread of variants of influenza B/Victoria/2/87 lineage viruses in the 2000-2001 and 2001-2002 seasons. Virology 303:1-8. [DOI] [PubMed] [Google Scholar]
- 28.Shiraishi, K., S. E. Lindstrom, T. Saito, M. Shinjoh, R. Nerome, S. Funatsumaru, and K. Nerome. 2001. Genetic analysis of an influenza B virus isolated from a patient with encephalopathy in Japan. J. Med. Virol. 65:590-597. [PubMed] [Google Scholar]
- 29.Tajima, F., and M. Nei. 1984. Estimation of evolutionary distance between nucleotide sequences. Mol. Biol. Evol. 1:269-285. [DOI] [PubMed] [Google Scholar]
- 30.Van de Peer, Y., and R. De Wachter. 1994. TREECON for Windows: a software package for the construction and drawing of evolutionary trees for the Microsoft Windows environment. Comput. Appl. Biosci. 10:569-570. [DOI] [PubMed] [Google Scholar]
- 31.Verhoeyen, M., L. Van Rompuy, W. M. Jou, D. Huylebroeck, and W. Fiers. 1983. Complete nucleotide sequence of the influenza B/Singapore/222/79 virus hemagglutinin gene and comparison with the B/Lee/40 hemagglutinin. Nucleic Acids Res. 11:4703-4712. [DOI] [PMC free article] [PubMed] [Google Scholar]
- 32.Webster, R. G., W. J. Bean, O. T. Gorman, T. M. Chambers, and Y. Kawaoka. 1992. Evolution and ecology of influenza A viruses. Microbiol. Rev. 56:152-179. [DOI] [PMC free article] [PubMed] [Google Scholar]
- 33.Yamashita, M., M. Krystal, W. M. Fitch, and P. Palese. 1988. Influenza B virus evolution: co-circulating lineages and comparison of evolutionary pattern with those of influenza A and C viruses. Virology 163:112-122. [DOI] [PubMed] [Google Scholar]


