Abstract
Living together in large social communities within an enriched environment stimulates self-motivated activity in rats. We developed a modular housing system in which a single unit can accommodate as many as 48 rats and contains multiple functional areas. This rat colony cage further allowed us to remotely measure body weight and to continuously measure movement, including jumping and stair walking between areas. Compared with pair-housed, age-, strain-, and weight-matched rats in conventional cages, the colony-housed rats exhibited higher body mass indices, had more exploratory behavior, and were more cooperative during handling. Continuous activity tracking revealed that the amount of spontaneous locomotion, such as jumping between levels and running through the staircase, fell after surgery, blood sampling, injections, and behavioral tests to a similar extent regardless of the specific intervention. Data from the automated system allowed us to identify individual rats with significant differences (>2 SD) from other cohoused rats; these rats showed potential health problems, as verified using conventional health scoring. Thus, our rat colony cage permits social interaction and provides a variety of functional areas, thereby perhaps improving animal wellbeing. Furthermore, automated online tracking enabled continuous quantification of spontaneous motion, potentially providing objective measures of animal behavior in various disease models and reducing the need for experimental manipulation. Finally, health monitoring of individual rats was facilitated in an objective manner.
Wild rats naturally live in colonies comprising 100 members or more. They establish complex habitats including burrow systems and use human facilities (for example, farms, barns) to find food. The home ranges of rats living at high density overlap, and the rats’ relationships are determined through social interactions.1 The facts that domestic male rats tend to be socially despotic rather than territorial enables rats to life at high densities in shelters in which they can build social structures. In contrast, most research facilities house rats in small groups of 2 to 5 animals, in an environment with low complexity and few opportunities to practice their natural physical activities, to develop a social hierarchy or to establish functional areas.
Several studies have investigated the effects of group sizes and environmental enrichment on the wellbeing, development, and stress responses of rats during experiments. Female, Hooded Norway rats showed greater preference for a cage containing a group of familiar rats than for extra space or enrichment, thus indicating the high importance of social contact for rats.17 A systematic comparison of preferred group sizes with increased space (20 cm2 per rat) revealed that a group size of 6 was preferred over both smaller (1, 2, 4 rats) and larger (12 rats) groups.18 However, the experiment was restricted to a short time period (90 min) and small group sizes (12 rats or fewer).18 When rats are housed at high densities, pathophysiologic indices of social stress, such as escape-related behavior, occurs11 and are much more pronounced in female than male rats, suggesting that social housing conditions of rats can vary markedly between sexes. In addition, female rats show increased aggression toward cage mates, and this behavior is highly variable and dependent on the individual animals.
Pain sensitivity, anxiety, and stress responses seem particularly to be positively influenced through social buffering and vary markedly depending on the presence of cage mates.15 In a study with male rats, social housing (10 to 12 animals per cage) for more than 25 d attenuated stress responses, such as impulsiveness and anxiety after forced swimming or foot shock.12 When rodents are devoid of any social contact, dramatic pain behaviors, such as autotomy of a denervated limb after dorsal rhizotomy, are markedly increased.2 In contrary, another study showed that social isolation can decrease pain sensitivity by µ-opioid signaling, and overcrowding has the opposite effect.15 In addition to social buffering, the introduction of enrichment items into the cage can modify stress resistance and pain sensitivity. Objects that enhance sensory stimulation, cognitive activity, and physical exercise have dramatic positive effects on brain morphology and behavior in rodents.4 These enrichment items provide superior ‘environmental construct validity’ for preclinical research. One recent study combined colony socialization and cage enrichment by housing 40 mice in a large cage with several vertically connected levels.9 Hippocampal neurogenesis during aging was markedly prolonged in mice that experienced this housing for more 20 wk compared with mice from standard, nonenriched housing. Hippocampal development correlates with improved memory function and decreased depression.14 Furthermore, neurogenesis correlated with roaming entropy, a measure that describes the degree to which activity is distributed throughout the entire cage area (for example, different levels).14 This relationship suggests that locomotion in a social and complex environment is a marker of an individual animal's development, even in genetically identical, inbred mice. Positive influences of social housing on neurogenesis also occur in rats of both sexes.23
In summary, housing rodents in a large social community and complex environment can reduce stress and improve animal wellbeing. Continuous tracking of the socially stimulated locomotion and body weight of single rats within the colony may represent a powerful, sensitive, and objective resource to estimate the stress experienced by various treatment or surgery groups and the general condition of individual animals. To test this hypothesis, we here developed a modular cage system for housing more than 40 rats in a group; this housing systems allows them to jump, hide, and climb or descend a ramp to change between differently enriched functional areas. We introduced a fully automated tracking system that enables the experimenter to study patterns of locomotion longitudinally continuously and to automatically assess body weight of each rat at least once daily. Using this automated tracking system, we investigated the effects of various experimental interventions such as knee surgery and oral dosing on movement behavior and body weight gain in rats.
Materials and Methods
Animals and general housing conditions.
Male Lister Hooded (Crl:LIS) outbred (weight, 244 ± 11 g) and male Lewis (LEW/Crl) inbred (weight, 253 ± 11 g) SPF rats were purchased from Charles River Laboratories (Sulzfeld, Germany). Although we acknowledge the importance to investigating both sexes in colony housing, we decided to first establish colony housing with males only in view of the increased aggressiveness and potential influence of hormonal fluctuation in female rats.11,23
At the vendor, rats were housed in conventional polycarbonate cages (595 mm × 380 mm × 200 mm high; floor area, 1820 cm2) in groups of 5 animals per cage. On arrival at our facility, rats were either housed in the same type of cages in pairs of 2 (1 from each strain or stock) or directly transferred to colony housing cages. Here 20 Lister Hooded rats were housed together with 20 Lewis rats (mixed strain and stock in the experiment with prototype colony cage). For identification, rats were tattooed (Animal Identification and Marking Systems, Hornell, NY) at the base of the tail. Rats were housed on an inverted day–night photocycle: during the daytime (0600 to 1800), housing rooms were dark (with short-term red working light, which likely is invisible to rats due to their dichromatic vision21), with rooms lit (less than 125 lx) at night (1800 to 0600). Room temperature was set to 20 °C. All experimental interventions and behavioral testing (outside of the home cage) were performed between 0700 and 1500 (active phase). Rats in all cage types received pelleted food (V1534–727, Ssniff, Soest, Germany) and water without restriction. Woodchip bedding (aspen wood, 3.5 × 4.4 mm) was provided in cellulose bags (200-g Nestpacks, Danesand, Bioscape, Castrop-Rauxel, Germany ), which are gnawed open for use as burrows. In addition, autoclaved paper bedding (Enviro-dri, 1 mm, Charles River) was provided to be used as nesting material, and aspenwood blocks (large, Ssniff) were available for rats to gnaw. Colony cages were changed twice each week (Monday and Thursday), and the conventional cages were changed weekly. All procedures were approved by the animal protection authorities of the local district government (Regional Authorities of Hessen, Germany).
Prototype setting of modular cage system for rat colony housing.
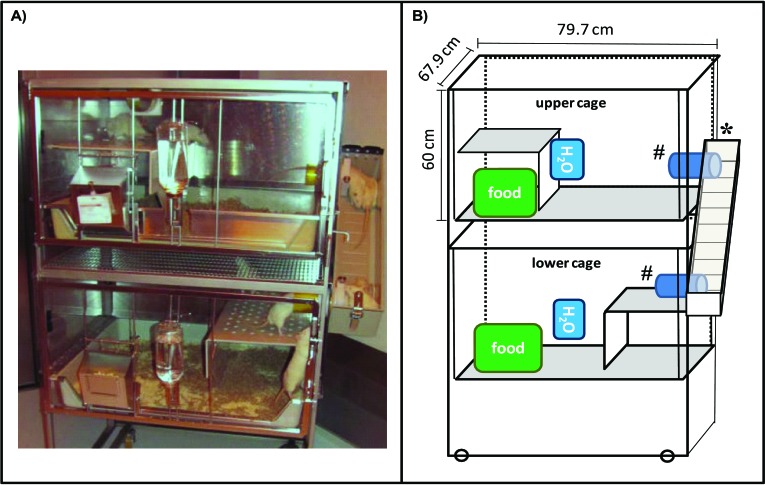
We converted a commercially available housing rack (F-suite Ferret Rack, Tecniplast, Buguggiate, Italy; http://www.tecniplast.it/en/product/f-suite-ferret-housing-rack.html) for colony housing of a maximum of 48 rats (Figure 1 A). A tube on the back of the cage that originally enabled ferrets to cross between the lower and upper cages was removed, and the holes were closed by a stainless-steel plate. The upper and lower cages were connected by a custom external staircase (Hugo Wohnig, Niedernhausen, Germany) on one side of the cage. This staircase was designed as a walled ramp (84 cm × 15.6 cm × 14.8 cm) with 6 transverse struts spaced 10 cm apart to provide footholds. A hinged top was added that allows easy access to rats in the staircase. Transit tubes (diameter, 8.2 cm) were used to interface the staircase with the upper and lower cage walls (Figure 1). The area of a complete floor of this prototype cage is approximately 5400 cm2.
Figure 1.
(A) The prototype rat colony cage. (B) Diagram of the cage setup. The rack consists of 2 cages which are connected by a custom staircase (*) with transit tubes that enter and exit the staircase (#). Both cages are equipped with a feeder and water bottles. Each level is interspersed with wood bedding.
Rat colony cage (final set-up).
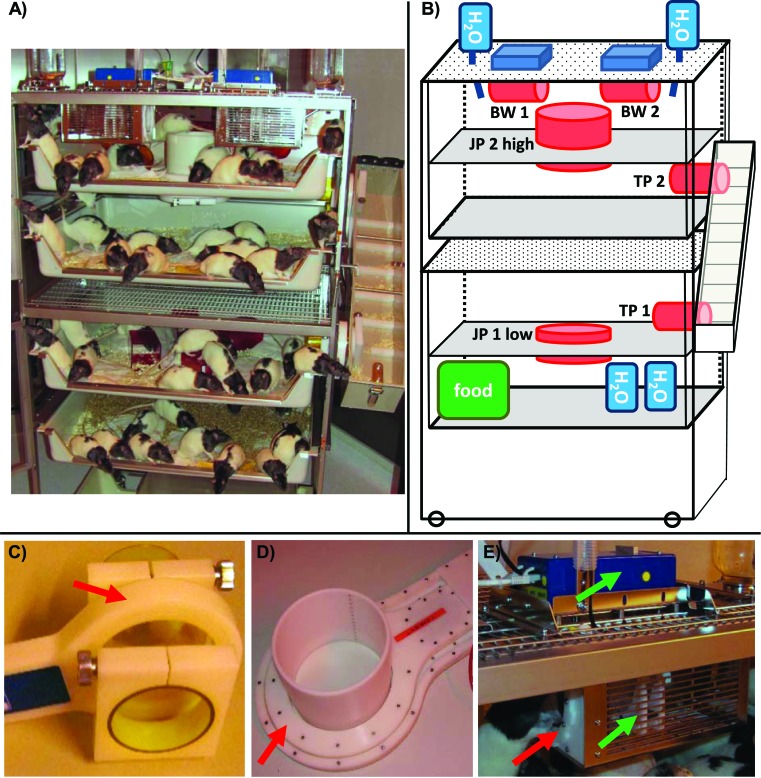
To obtain the final set-up, which included the integrated tracking system, we added removable back walls, ceilings with a grid, an additional water bottle at each front door, and 2 intermediate levels (catalog no. 4P02B700rat, Makrolon tubs, Tecniplast) with central holes to the prototype cage, yielding a total of 22,246 cm2 over 4 levels in the complete cage (Figure 2). The upper level was enriched with a single tunnel, 4 retreats, and 2 crawl balls (all from Plexx, Elst, Netherlands), The staircase was attached through additional holes in the right side wall. Care was taken to ensure that all parts in contact with rats are easy to remove, clean, and autoclave. According to EU directive 2010/63 Annex III (2010), which mandates 250 cm2 per rat weighing 200 to 300 g, we housed 48 rats in a single colony cage. However, several cages can be connected by means of the staircase transit tubes; in this case, the staircase is removed and the transit tubes connect the upper and lower cages of 2 racks. Therefore, a total of 194 rats (that is, 48 × 4) can be housed as a single group when 4 racks are combined into a single unit.
Figure 2.
Final set-up of the rat colony cage containing the spontaneous motion and body-weight tracking system. (A) Photograph of colony cage with the HM3 locomotion and body-weight tracking equipment (doors open). (B) Diagram of final colony cage set-up. BW, body-weight measurement station with antenna (red); H2O, watering station (blue); JP1 and JP2, lower and upper (respectively) jump holes with antennas; TP1 and TP2 lower and upper (respectively) entrance to and exit from staircase with antennas. Each detection is recorded as an event designated its location ID, rat ID, detection time, and (possibly) body weight. The recorded data are kept in a database for further data processing. Individual levels are equipped as follows: level 1 (feeding ground) contains food, water, and woodchip bedding; level 2 (resting area) contains woodchip bedding and red plastic huts; level 3 (defecation area) contains woodchip bedding; level 4 (playground) contains 4 retreats, 2 crawl balls, 1 hanging tunnel, watering stations, and body-weight stations. (C) Staircase transit tracking system (TP1, TP2) comprises a tube that allows a single rat to enter or exit the staircase, which has antennas. (D) Both jump holes (JP1, JP2) are formed by tubes (diameter, 169 mm) that are adjustable in height (height of jump, 28 to 34 cm). Both jump holes allow tracking of any jump separately from level 1 to 2 and from 3 to 4. (E) The weighing stations (BW1, BW2) are located on the ceiling of level 4. Single rats enter a tube suspended on a scale. The rat can then access a drinking nipple at the end of the tube. Red arrows, antennas; green arrows, tube and scale of the weighing station.
In the final colony cage set-up, we housed male Lister Hooded (Crl:LIS) rats (age, 6 wk; average weight, 200 to 225 g at study start) for 20 wk (final weight, 412 to 495 g). We chose Lister Hooded rats because they were much more active than the Lewis rats in preliminary experiments. Increased activity is an advantage for behavioral tests, such as the CatWalk test (see following section), which is used to characterize osteoarthritis symptoms.8 The CatWalk gait analysis results were consistent, and we did not see increased variability due to outbreeding and investigating functionality under different conditions. For identification through the system antenna, rats were injected subcutaneously at the lower back with a radiofrequency identification chip (Slim T-SL Microchip 10.9 × 1.6 mm and 2.0-mm needle, Datamars, Bedano, Switzerland). To ensure that rats could be identified locally by visual examination in the group quickly or when a chip got lost, the rat's number was tattooed at the base of their tail. Using this set-up and the automated tracking system, we analyzed the effect of different experimental interventions and unexpected cases of abnormal general condition on the locomotion and body weight of rats.
Automated tracking system and HM3 software.
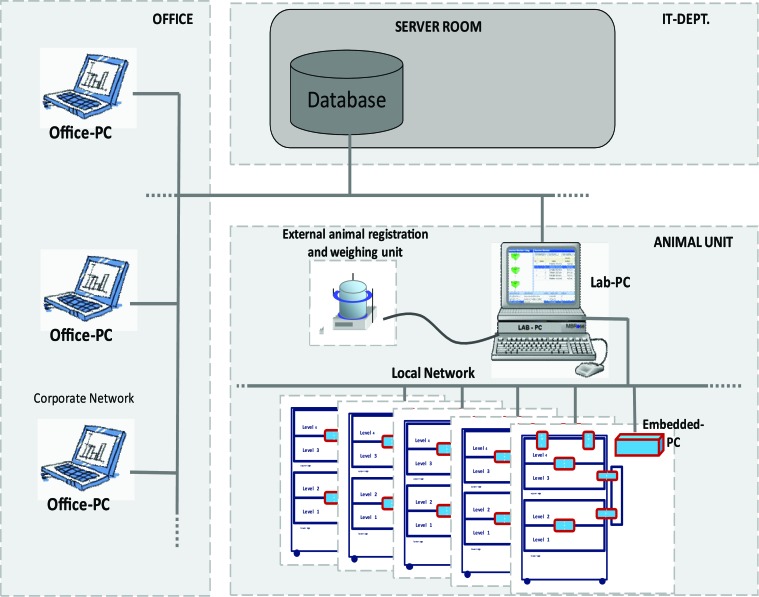
The data acquisition system HM3 was designed by MBRose (Faaborg, Denmark) according to our requirements. To detect the transponders displaying the rat's identification number, antennas were placed at the bottom and top of the staircase (TP1 and TP2, Figure 3 C), at the jump holes (height at JP1, 28 cm; height at JP2, 34 cm, Figure 3 D), and at the 2 body weight measurement stations [BW1 and BW2], Figure 3 E). Whereas the TP and JP antennas merely detect the passage of a rat, the rat is attracted to enter the scale for weight measurement by the BW detectors because of access to a drinking nipple at the end of the tube (Figure 3). All antennas are connected by data cables (RJ45) to the embedded personal computer, where rat detection events were compiled and stored locally inline for subsequent synchronization. During synchronization (every 30 min, for our set-up), the local database of each embedded PC is synchronized with the common database, which is accessible from the institutional network (Figure 4). Thus our data were accessible outside the animal facility at 30 min after collection. The setup and control of the system was managed by the HM3-Lab program of the data acquisition system. From here, tracking experiments were started and stopped and the actual data recording was monitored. When stored in the corporate database, data were accessible from any computer in the network that ran the HM-View program. The entire hardware works as a ‘plug and play’ system; none of the antennas, scale units, or cables are accessible to the rats.
Figure 3.
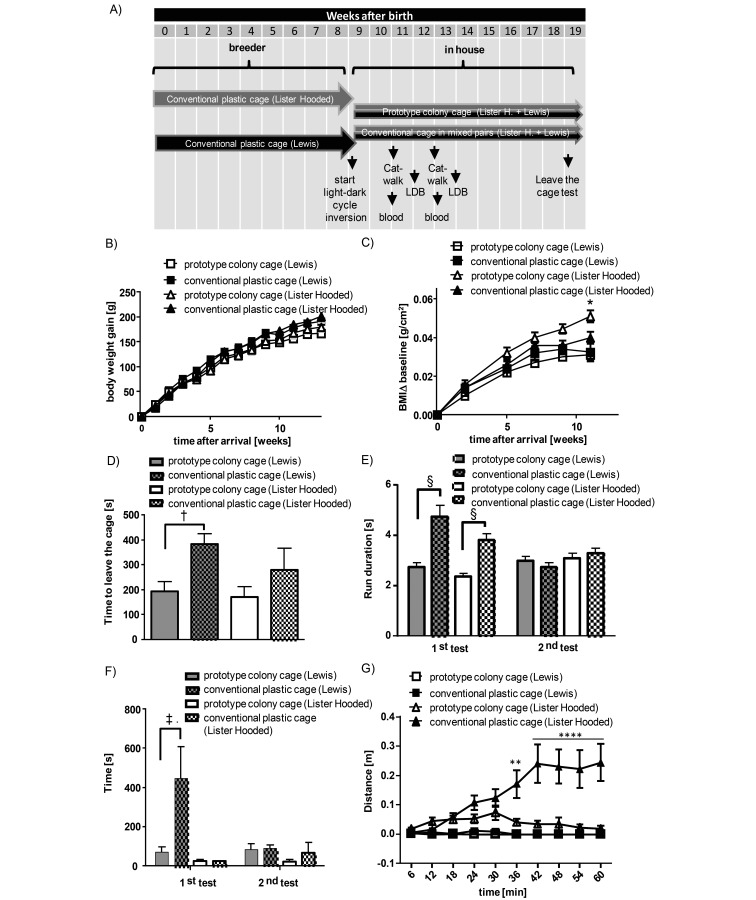
Influence of housing conditions on body weight gain, change in body mass index (BMI), and exploratory behavior in the prototype colony cage. (A) Scheme of the time course for housing conditions, behavior testing, and blood sampling. (B) Comparison of manually measured body weight gain of Lewis and Lister Hooded rats housed in conventional cages or the prototype colony cage. Shown is the mean weight gain over time since arrival. (C) Comparison of body mass index (body weight / body length2) of the same rats shown in panel A. Data are given as mean ± SEM (n = 4–10 Lewis rats or 5–9 Lister Hooded rats; 2-way ANOVA followed by Sidac posthoc testing comparing single animals from different housing types within a given rat line; *, P < 0.05). (D) Effects of housing conditions on exploratory behavior of rats in the leave-the-cage test. Data are shown as the mean ± SEM (n = 5–10 Lewis rats and 5–9 Lister Hooded rats; unpaired t test comparing single animals from different housing types within a given rat line; †, P < 0.01). (E) The duration of the run through the walkway was determined after 2 and 4 wk of differential housing. Data are shown as the mean ± SEM of total runs from 10 to 20 Lewis or Lister Hooded rats (each rat made 1 to 3 runs; 2-way ANOVA followed by Sidac posthoc testing of single runs. §, P < 0.0001). (F) Latency to enter the light compartment after placement into the dark compartment in the light–dark box test (LDB). Data are shown as mean ± SEM (n = 9–20 Lewis rats and 10–20 Lister Hooded rats; 2-way ANOVA followed by Sidac posthoc testing. ‡, P < 0.01). (G) Locomotion in the light compartment of a light–dark box over 1-h in 6-min intervals during the first test of the same rats as shown in panel F. Data are shown as the total distance travelled (mean ± SEM).
Figure 4.
Data collection, transport, and storage. All radiofrequency identification (RF-ID)-detecting antennas located in the cage were connected via data cables (RJ45) to the embedded PC, where the events were compiled and stored locally inline for the succeeding synchronization. Every 30 min, the Lab-PC sequentially synchronized the local database of each embedded PC with the common database, which was accessible from the corporate network, so that the results of a study could be followed from the office PC outside the animal facility. The setup and control of the system were managed from the Lab-PC. From here, sessions were started and stopped and running sessions monitored. Before rats entered the cage, their actual body weight was registered at an external station.
‘Leave the cage’ test.
Exploratory behavior was determined by using the leave-the-cage test. Two rats, one Lewis and one Lister Hooded, were placed in an empty conventional cage (floor area, 1820 cm2; height, 20 cm; Tecniplast). The cage lid was opened to 25% of maximum, and the time until the rats left the cage with both hind paws (stands mostly on the top of the cage) was determined. The maximum time of assessment was 480 s.
Gait analysis by using the CatWalk test.
The CatWalk test (CatWalk XT 10.0 system, Noldus, Wageningen, The Netherlands) was performed to investigate gait characteristics according to time and surface parameters of paw prints. While rats walked voluntarily along the walkway, their paw prints were visualized by boundary surface optics. Rats that had been housed for 2 wk in conventional cages or the prototype colony cage were placed on a wet tissue to moisten paws and then placed onto one end of the walkway of the CatWalk system. An individual run was defined as sufficient when the walkway was completely passed within 10 s, and run duration was the actual time for a sufficient run. Three independent runs were targeted for each rat, and total analysis time did not exceed 5 min per animal. If fewer than 3 run were acquired, the cut off time of 10 s was assigned for each of the missing runs. For a complete CatWalk session (for example, testing 48 rats 3 times each), the rats were outside of the colony cage for 2 to 4 h. Tests were done between 0700 and 1500.
Light–dark box test.
Rats that had been housed in the respective cage type for 2 wk were placed individually in the dark compartment of the test system (TSE Systems, Bad Homburg, Germany). The latency until the rat entered the light compartment and the distance moved during 3-min intervals for 1 h were recorded. The long duration was chosen to estimate not only the threshold for initial exploration but also the decline of exploratory activity, which can indicate habituation and reduced stress in the new environment.
Joint instability surgery.
Surgery was performed after rats had been habituated for 4 wk (age at arrival, 10 wk). At 30 min before surgery, each rat received buprenorphine (0.06 mg/kg SC, Temgesic, RB Pharmaceuticals Limited, Berkshire, United Kingdom). Rats were anesthetized with 1.5 %– 2.5 % isoflurane (Baxter, Unterschleissheim, Germany) in 0.5 L/min carbogen (95% oxygen and 5% carbon dioxide) by inhalation mask and placed onto a warming pad (model 150, CMA Microdialysis, Solna, Sweden). Eyes were covered with eye cream (Bepanthen, Bayer Vital, Leverkusen, Germany). The rat was placed in the supine position, the right knee joint was shaved and disinfected (Cutasept, Bode, Hamburg, Germany), and joint instability surgery through transection of the anterior cruciate ligament and resection of the medial meniscus surgery was performed as described elsewhere.19 Briefly, a skin incision was made medial in parallel to the patella of the right joint. The area of the medial quadriceps tendon was cut from its anchorage, the patella was translocated proximately, and the joint capsule was opened. Then the anterior cruciate ligament was transected by using a sharp hook, the anterior meniscotibial tendon was dissected by using a scalpel, and the medial meniscus was removed. Finally, the joint capsule, associated muscles, and connective tissue were sutured in layers. For postsurgical analgesia, rats received meloxicam (0.5 mg/kg SC; Metacam injection solution, Boehringer Ingelheim, Bieberach, Germany). To allow full recovery from anesthesia, the rats were housed in conventional cages in pairs with water and food available during the first night after surgery, after which they were replaced in the colony cage.
Health monitoring.
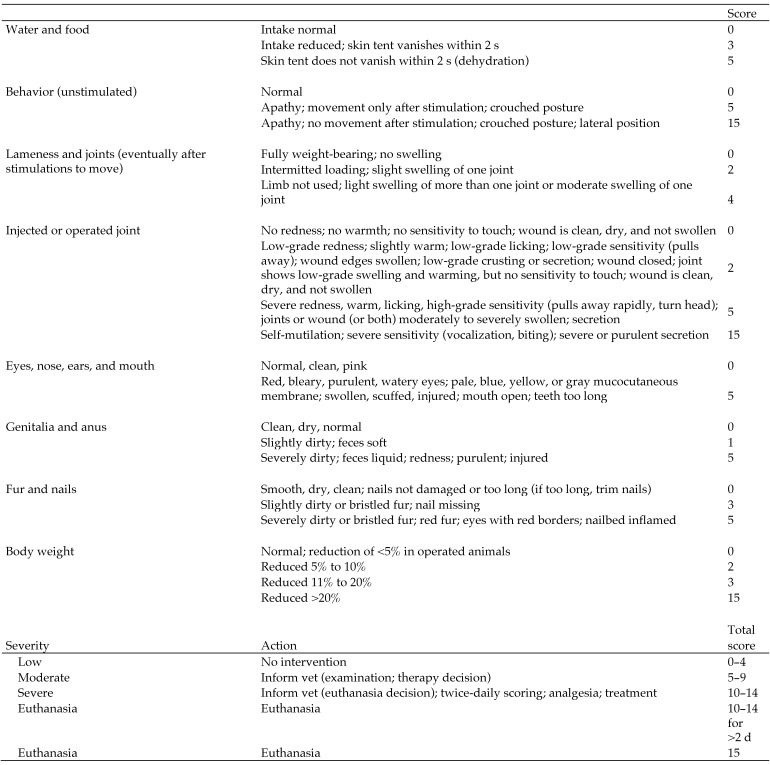
Health monitoring by visual examination was performed daily during the week after surgery and once weekly thereafter, according to a health scoring system (Figure 5). Health parameters were body weight; retention of a 2-finger skin fold as a sign of dehydration; fur and claw condition; signs of infection; signs of inflammation or injury; condition of eyes, mouth, ears, and surgical wound; lameness during movement; and general behavior (for example, apathy). In this study, 2 animals had health scores higher than 0 (optimal score); one rat had lameness with minor joint swelling at 6 d after joint instability surgery, and the other rat had a weight loss of greater than 10% during the week after oral vehicle dosing. These cases were used for cross validation of general condition assessment by the automated tracking system.
Figure 5.
Ethogram: general health score.
Sublingual blood sampling.
Rats were anesthetized with isoflurane (3% to 4.5%). To expose the underside of the tongue to the outside of the mouth, the tongue was coiled around a cotton-tipped applicator. The sublingual vein was localized and a cannula inserted (23-gauge, B Braun, Melsungen, Germany). Free-catch blood (approximately 200 µL) was collected in a plastic tube, after which the bleeding was suppressed by using a gauze sponge.
Dosing procedure.
For intraarticular injection, rats were anesthetized with isoflurane (3% to 4.5%), the right knee was shaved and disinfected, and 30 µL of 0.9% NaCl was injected intraarticularly through a cannula (27-gauge, Sterican, B Braun). The application was made by using a custom device (the ‘Handy Stepper System’), which moves the needle and applies the exact volume after a pedal is pushed. Oral administration of vehicle (0.5% methyl cellulose and 0.25% Tween) was performed by using a flexible stomach tube (Feeding needles, Scanbur, Karlslunde, Denmark) inserted into the esophagus.
Statistical methods.
The effect of housing type was analyzed statistically by using data points from individual rats (housed in colony or in pairs) according to strain or stock. The statistical analysis is based on the core assumption that the 24 conventional cages used in this experiment were comparable in all respects, such that the cage number had no effect on the outcome. Great care was taken to ensure the same environmental conditions for all conventional cages. All type IV cages together were treated as a single experimental unit (given that there was no treatment difference) within the statistical tests. When multiple time points were considered, 2-way ANOVA followed by Sidac posthoc testing was used. For comparison at a single time point, unpaired and 2-tailed t tests of normally distributed data (that is, passed KS normality test with an α value of greater than 0.05, and the same SD in 2 compared groups was assumed) was used to compare 2 groups of each strain or stock. Significance was defined as a P value less than 0.05.
Results
Rat behavior and adolescence in the colony housing prototype.
To investigate the effect of different types of housing on rat development and behavior, Lewis (strain) and Lister Hooded (stock) rats from the same delivery were either housed together in a prototype cage in colony of 48 rats (24 of each strain and stock) or as pairs in conventional plastic cages (same strain or stock in each cage; Figure 2 A). No harm or serious hostilities were observed when the 2 rat lines were housed together in the prototype colony cage, beginning the first day of their socialization. In general, the rats in the colony housing were very active, using the staircase and changing levels frequently (that is, more than 100 times daily). Weight gain was similar in rats housed in the prototype colony cage and in conventional cages (Figure 3 B). After 11 wk of housing, Lister Hooded rats that had been colony-housed had significantly (P < 0.05) greater body mass index than did those housed in conventional cages (Figure 3 C); this effect was less pronounced and not significantly different in the Lewis strain. During the observation period of 8 min, the leave-the-cage test revealed that Lewis rats that had been colony-housed for 10 wk left the cage significantly (P < 0.05) faster than did age- and strain- matched control rats from conventional pair housing (Figure 3 D). Lister Hooded rats showed the same (albeit nonsignificant) trend.
When rats are placed into a new test system, they typically need several habituation cycles to acclimate them to the new environment. We investigated how rats housed in the conventional and prototype colony cages behaved when first placed in the CatWalk system for gait analysis. In our experience, when conventionally housed rats are placed in the system for the first time, they usually explore the new environment slowly and cautiously. However, when rats are tested a second time (for example, 2 wk later), they typically perform the CatWalk run much faster than initially, which we interpret as a habituation effect. Both lines of colony-housed rats performed the CatWalk run significantly more quickly than did the rats in the conventional cages, even at the first visit (Figure 3 E).
We investigated exploratory behavior related to illumination of a test area by using the light–dark box paradigm. During the first trial, Lewis rats took more time to enter the light box than did Lister Hooded rats; colony housing significantly (P < 0.05) reduced this latency (Figure 3 F). During the second test (2 wk after the first) all rats, independent of line and housing type, entered the light box relatively promptly, indicating some habituation to this condition. We then compared the rats’ activity in the light box during the 1-h test period. As expected, Lister Hooded rats were much more active than were Lewis rats (P < 0.05). In addition, after an initial exploration phase, the colony-housed rats Lister Hooded rats entered the light box infrequently (Figure 3 G); for the majority of the 1-h test period, these rats stayed in the dark box. This behavior was significantly (P < 0.05) different from that of conventionally housed Lister Hooded rats, which still left the dark compartment more frequently.
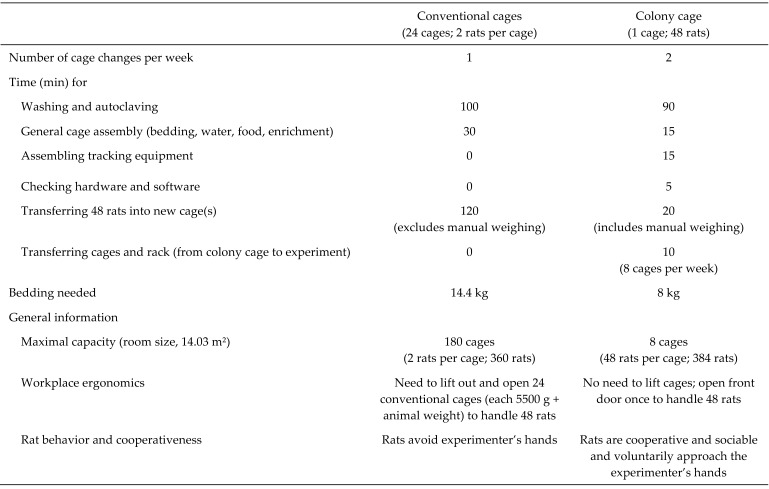
Practical experience showed that the colony-housed rats were very easy to handle. We familiarized colony-housed rats to handling by daily training over 1 wk, beginning the day after delivery. For approximately 10 to 20 min, experimenters used both hands to stroke all rats and allowed the rats to explore their gloved hands and arms. As soon as an experimenter opened the door of a colony cage, the rats were attracted to the experimenter's hands. The experimenters placed their hands into all areas of the cage, and the rats did not show any escape or hiding behaviors. This simplifies the removal of rats from the cage and enables large numbers of rats to be handled in a short time. Several important aspects regarding the time and cost effectiveness of colony housing compared with a conventional housing system are compared in Figure 6.
Figure 6.
Time- and cost-effectiveness of conventional caging and colony housing for rats.
Automated tracking of spontaneous motion of healthy rats in the final colony cage set- up.
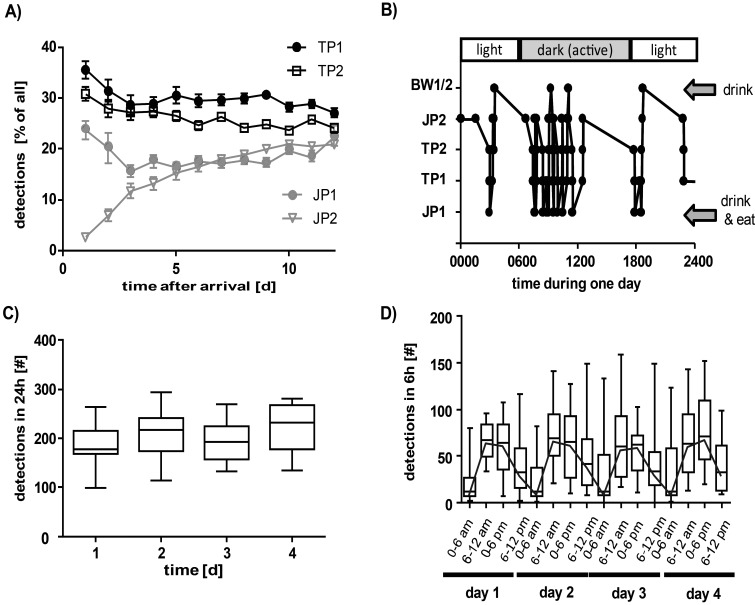
Directly after arrival from breeders, rats were placed into the version of the colony cage that was equipped with an automated tracking system (Figures 4 and 7). The rats gradually learned how to access all levels of the cage habitat. In particular, level 4 can only be accessed through the upper jump hole (JP2, which is set to 34 cm) and is not visited by the rats during the first several days after arrival. The analysis of the relative distribution of detections at the different stations (Figure 8 A) shows that the number of detections at JP2 reached a plateau of approximately 20% only after about 12 d, thus indicating that a minimum of 12 d is needed to habituate rats to the colony cage before baseline recordings should start.
Figure 7.
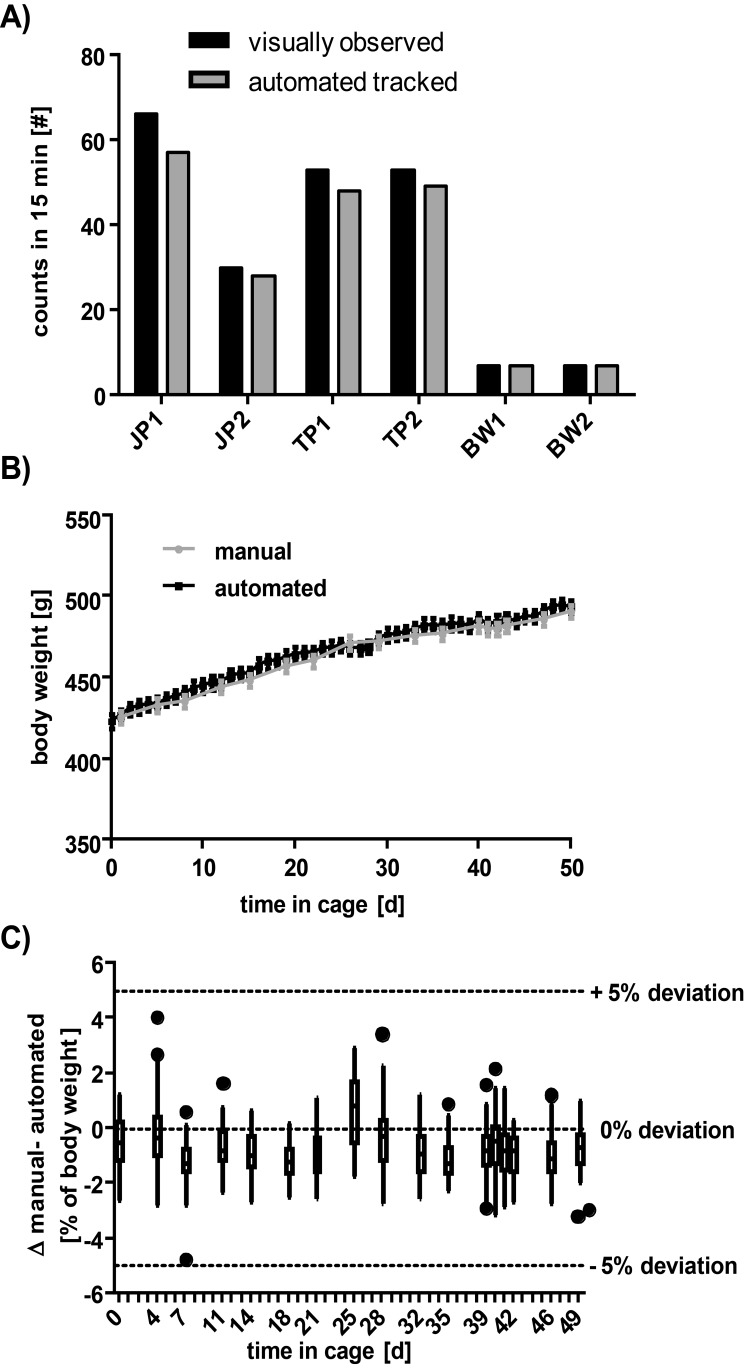
Accuracy of automated locomotion and body weight measurements of individual rats. (A) The number of times a rat passed a particular antenna in 15 min was counted by eye (as the observer stood in front of the cage) and compared with the number of detections stored in the database for the same station and time period. (B) The time course of manual compared with automated body weight measurement. Data are shown as mean ± SEM (n = 60 rats). (C) Differences between manual and automated body weight measurements of rats shown in panel B. Data are shown as median, minimum, and maximum (n = 60 rats). For orientation, the 5% deviation threshold (average) is indicated as a dotted line.
Figure 8.
Automated tracking of spontaneous motion of individual rats housed in a colony cage. (A) Habituation period of 150- to 200-g Lister Hooded rats in a colony cage after breeding and rearing in conventional plastic cages. Data are shown as the percentage of detections at the single tracking stations relative to other stations over the first 25 d. (B) Example of the path of a rat (8-wk habituated Lister Hooded rat) through a colony cage over 24 h. Consecutive detections at the same station have been filtered out, and only sequential moves to a different station are shown (data in panels A, C, and D are not filtered). (C) Total number of detections at all 6 stations in 24-h intervals over 4 d without disturbance (weekend and holidays after 11 wk of habituation). Data are shown as the median, minimum, and maximum of 18 rats. (D) Total number of detections at all 6 stations in 6-h intervals (same rats as in panel C). The black line connects median values to demonstrate circadian rhythmicity.
The path of an individual rat through the cage can be illustrated by plotting the antenna responses over time; Figure 8 B shows an example of the path of an 8-wk habituated rat over 24 h. To view only sequential moves from one specific tracking point to another, we filtered out all consecutive detections at the same station. The locomotion pattern illustrates that during the light phase (that is, 1800 to 0600), the rat remained at level 4 from 0000 to 0600 and 1800 to 0000, passing the JP2 antenna only once in 6 h to briefly visit the base level (which contains the feeding station) before returning directly to level 4. This pattern suggests that the sleeping area of the example rat is level 4. During the dark phase (0600 to 1800), this rat frequently moved between the very low and high levels of the cage and often used the staircase. Comparing many such path views, we recognized that the results varied markedly both between individual rats and for a particular rat over time (data not shown). Of note, even rats with the lowest activity were still detected nearly 100 times daily (including consecutive repeated detections at the same station, which are not shown in Figure 8 B).
We next investigated locomotion by summarizing the detections at all stations within 24-h periods. During 4 consecutive days without any experimental interventions, the daily activity was comparable between days (Figure 8 C), and none of the healthy rats was detected fewer than 100 times each day. Finally, we analyzed the locomotion data in 6-h intervals to follow the circadian rhythm (Figure 8 D). Although variation within the group increased when analyzed over the shorter interval, the median values describe a steady circadian rhythm in the rat colony, with their lowest activity during the light phase between 0000 and 0600.
Sensitivity of spontaneous motion to experimental interventions.
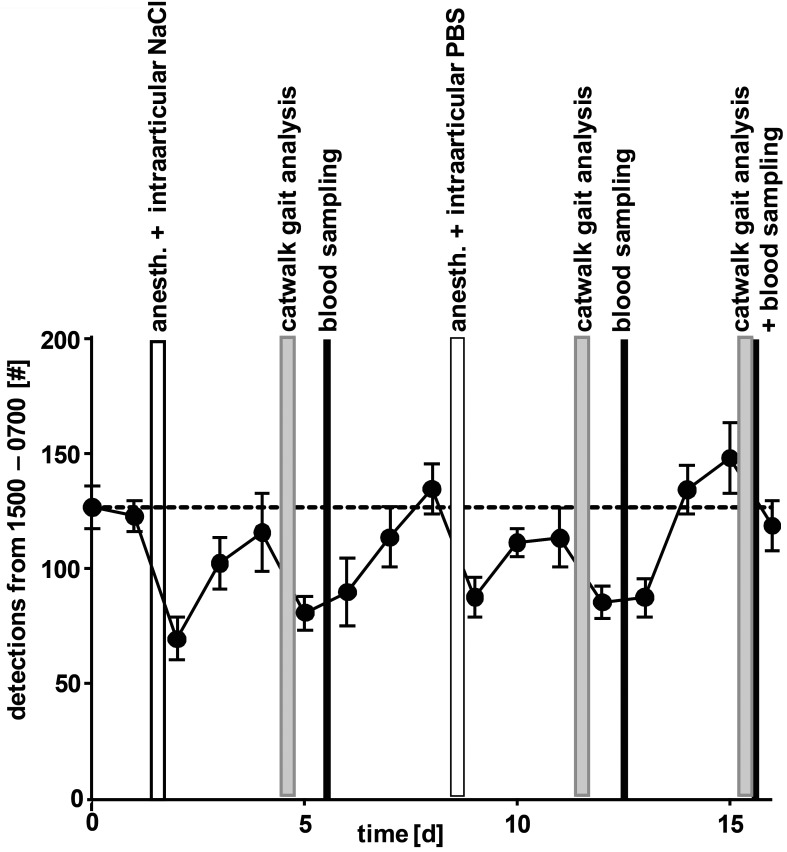
Changes in spontaneous motion can potentially reflect stress, anxiety, pain, or physical disability.7 For anesthesia, blood sampling, intraarticular injection, and behavioral tests (for example, gait analysis), animals typically are brought in conventional cages to a different room, where they remain for as long as 3 h. This practice may induce a minimal level of stress, even though this effect is not detectable through visual health scoring (Figure 5). We here assessed whether changes in spontaneous motion occurred after rats are returned to the colony cage after experimentation. To this end, we analyzed the number of detections at all antennas during 1500 to 0600, when no one was in the housing room and when the rats were undisturbed (Figure 9). We found that any intervention performed during the day substantially reduced the spontaneous motion activity of rats during the following undisturbed nighttime period. However, the effect did not differ between the various types of intervention: for example, anesthesia with subsequent blood sampling had a similar effect as did CatWalk gait analysis. The visual health scores of the affected rats did not differ before and after intervention (Figure 5). Furthermore, reductions in activity did never fell below 50%, and if there was no further disturbance, the activity level recovered within the next 2 d.
Figure 9.
Effects of blood sampling, behavioral testing (CatWalk), or anesthesia with intraarticular injection on spontaneous motion in the colony cage. Data are shown as the mean ± SEM (n = 7 rats) of the total detections at all antennas between 1500 and 0700 (time without any disturbance by staff) each day. Anesthesia was induced by isoflurane (3% to 4%) and was followed by intraarticular injection of vehicle (30 µL 0.9% NaCl or PBS) or blood sampling (approximately 200 µL, sublingual venipuncture). For gait analysis, rats performed 1 to 3 runs along a CatWalk apparatus. For any intervention, rats were transferred to and transported in conventional plastic cages from the housing room to a different room, where they waited in the conventional cages until all testing was complete. All interventions were performed between 0700 and 1500, when locomotion data were excluded from the analysis shown.
Automated identification of animals with a reduced general condition.
To investigate whether the locomotion and body-weight tracking system is suitable for identifying individual rats with potential health problems, we cross-validated the tracking data by using findings from visual health scoring (Figure 5).
Case 1: Reduction in body weight after dosing of vehicle by oral gavage.
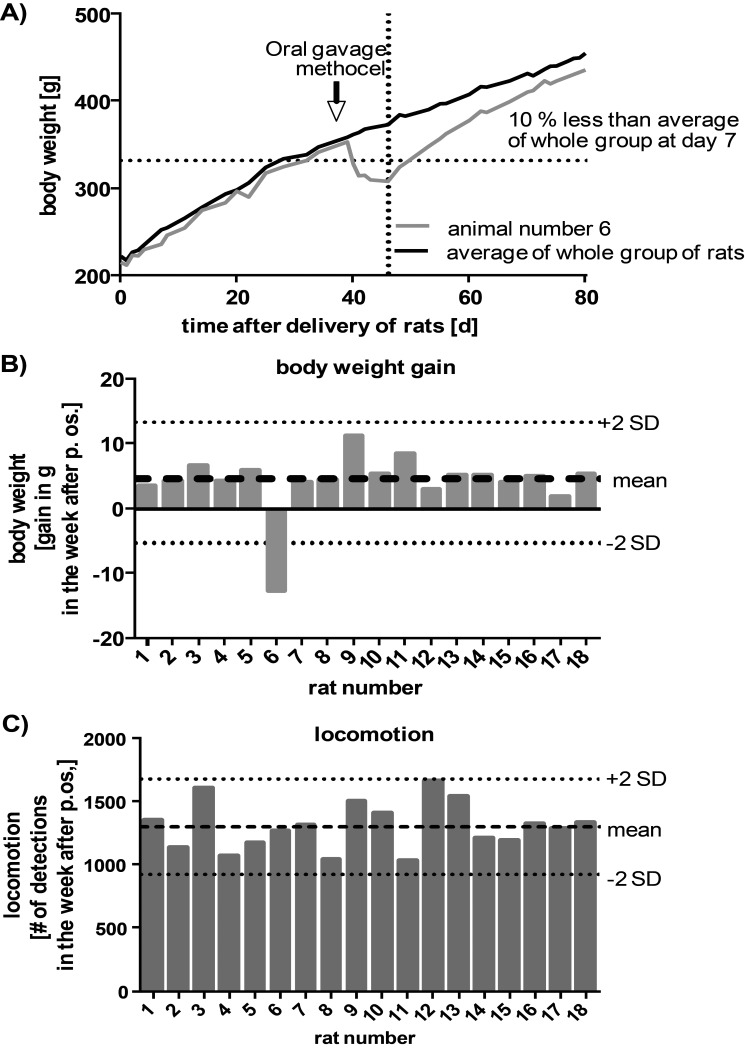
After dosing a group of 18 healthy rats with a vehicle solution by oral gavage, we found that health scoring 7 d later revealed that one rat (no. 6) had a greater than 10% reduction in body weight (score, 3). All other rats and all other health parameters were scored as 0 throughout the entire week after this procedure. The time course of automatically determined weight in the colony cage showed that the body weight of rat 6 began to fall after oral application (Figure 10 A). No other rat showed a reduction in body weight of more than 5% (that is, 2 SD; Figure 10 B). In contrast, the analysis of data from different antennas indicated that rat 6 did not show any significant difference in locomotion activity through the cage compared with the group average (Figure 10 C). Therefore, in this case, the body weight function of the automated tracking system supported the findings from visual health monitoring.
Figure 10.
Case of decreased general health condition was identified through automated body weight measurement but not by locomotion tracking. After oral gavage of vehicle (methocel), rat 6 was noticed during health scoring because of low body weight. (A) Automated body weight tracking illustrates body weight difference of rat 6 compared with the group average (n = 18). (B) Weight gain of individual rats during the first 7 d after dosing of a vehicle solution by oral gavage. The accuracy of automated compared with manual body weight measurements is illustrated in Figure 4. (C) Locomotion of individual rats during the first 7 d after dosing by oral gavage. Data are shown as the sum of detections at all antennas during 7 d for each rat.
Case 2: Reduction of spontaneous motion after surgical intervention.
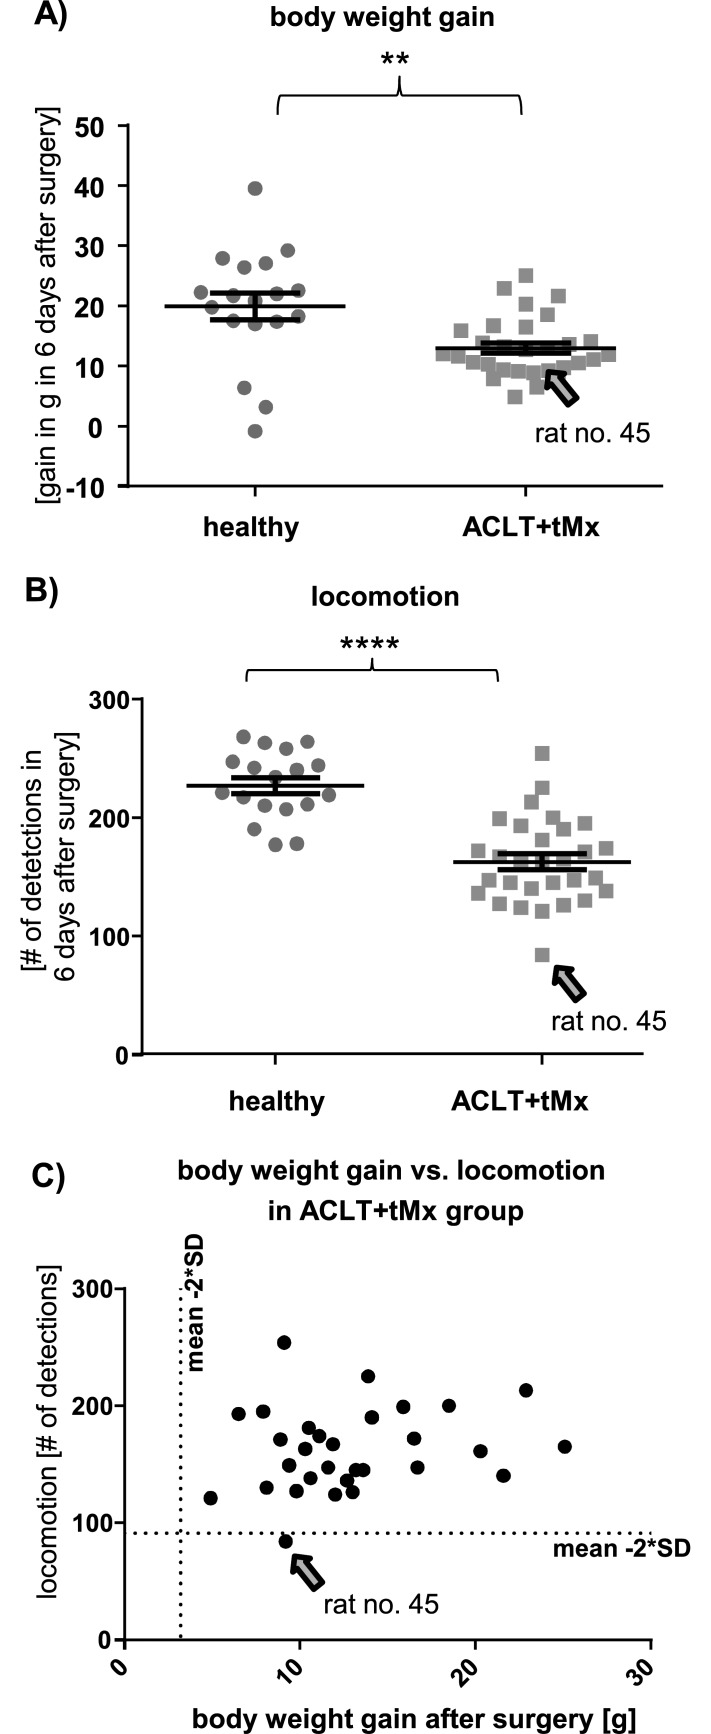
We induced joint instability by using a surgical method that results in cartilage erosion19 to investigate potential drug effects in this model. Daily health scoring reveals that rats usually recover from this surgical intervention within approximately 1 wk, when body weight returns to levels comparable to those of healthy rats, health scores normalize, and gait disturbances are not noticeable at visual examinations. Here we compared automated tracking data between colony-housed healthy rats and those in which joint instability was induced surgically. One rat of the operated group (no. 45) was documented on the health-scoring sheet as still showing signs of lameness at 6 d after surgery. We compared the body weight and locomotion activity of rat 45 with those of the rest of the operated group during the postsurgical period. Compared with the healthy group, all rats in the surgery group (including no. 45) showed some decrease in body weight gain during the first postoperative week. The weight of rat 45 did not differ from that of other rats in the surgery group, either by manual measurement or automated detection (Figure 11 A). Analysis of the number of detections at all antennas revealed that locomotion on day 6 after surgery was significantly lower in the joint instability group compared with healthy rats. Rat 45 had, by far, the greatest reduction in spontaneous motion (more than 2 SD below the mean of all operated rats, Figure 11 B and C), indicating that this parameter can be used to confirm the observed health issue.
Figure 11.
A rat with a decreased general health condition was identified due to locomotion data but not by automated body weight tracking. Rat 45 was noticed during health scoring because of postsurgical lameness. (A) Body weight gain during the first 6 d after surgical intervention as measured by the automated weighing stations. †, Unpaired t test: t = 3.31, P = 0.0018. (B) Total detections on day 6 (1500 to 0700) after joint instability surgery. Each symbol represents a single rat. §, Unpaired t test: t = 6.501, P < 0.001. (C) Body weight gain compared with spontaneous motion activity within the operated group. The dotted line indicates the cut-off value (that is, 2 SD below the mean). Of note, rat 45 is below the threshold for locomotion activity but not for weight gain.
Discussion
In the colony cage, rats can socialize and express self-motivated behaviors including climbing, jumping, and arranging different functional areas. The system was designed for economical long-term use with a large number of rats. All parts of the apparatus that contact rats can be autoclaved, and the time for assembly, bedding changes, and animal handling does not exceed that for conventional cages containing the same number of rats.
The high body mass indices with low variation indicate that all colony-housed rats have undisturbed access to food and that subordinate rats are not blocked from the food area by territorial, aggressive rats. Using the tracking system, we observed that after a 2-wk habituation period, all rats frequently moved between all levels of the cage. As a benefit of this colony housing environment, we noted that rats were more inquisitive and cooperative during handling outside of the colony cage. Previous studies have demonstrated that social and cage enrichment can buffer anxiolytic effects of stress, attenuate pain-related behaviors, and even improve the response rate to analgesics.12,15,20 Our observations reflect these same benefits. Compared with conventionally housed rat pairs, colony-housed animals needed less time to habituate to a new test environment and show exploratory behavior. These findings indicate that colony-housed rats adapt more readily to the new environment and suggest a lower level of stress in these animals. Habituation is important for many studies, given that rodents, as prey animals, may mask signs of distress when they are in a novel environment.22 In the light–dark box paradigm, a test for anxiety behavior,3 the latency to and duration of exploration of the illuminated area (the novel environment) were shorter for colony-housed compared with conventionally housed rats. Therefore, rats housed in the colony cage showed less anxiety with regard to exploring the light area but soon stopped entering this area. We hypothesize that the social interactions and environmental enrichment in the colony cage stimulate the rats; conversely the novel light–dark box environment may be perceived as having low sensory input and therefore does not induce activity. In contrast, conventionally housed rats were active throughout the 1-h observation period and explored this novel environment much longer than did the colony-housed rats.
Similar to stress and anxiety, pain can be attenuated by social buffering in different animal models.15 Both physical enrichment in a 3-floor cage including tunnels, running wheel, and extra nesting material as well as social enrichment in groups of 4 rats have been shown to ameliorate the duration of inflammatory pain.10 How colony housing modulates parameters indicative of experimentally induced pain needs to be determined in the respective models. However, we surmise that colony housing refines experiments both by buffering overall pain through the provision of a stimulating and diverse living environment as well as by improving symptomatic characterizations through the reduction of stress during testing outside of the home cage and in a novel environment. The recently developed paradigm Phenoworld offers physically enriched housing in a social environment for a maximum of 6 rats, where rats can choose different functional areas and perform different physical activities, such as wheel running.5,6 Rats housed in this environment show a more clearly circadian sleep pattern and more social interactions.5,6 In male guinea pigs, colony housing was associated with a lower increase in the cortisol level in response to novelty.13 It is well established that in humans, social support leads to resilience to stress.16
Furthermore, we developed a custom automated tracking system to monitor voluntary activity, which can be impaired due to experimental pain, disability, or decreased general health of any cause. The tracking system automatically detected jumps and staircase use between cage levels. Antennas were located at key positions to detect all vertical moves throughout the cage, which reflect the majority of physical efforts. Different functional areas—such as the food and water area on the lowest level and the playground with 4 retreats, 2 crawl balls, and a hanging tunnel at the highest level—and the ability to interact with numerous cage mates likely drives rats to seek the area that provides them with the most comfort. This preference can be influenced by the rats’ current health condition; conversely, we predicted that their spontaneous choice can give information regarding their current health condition. Changes in spontaneous motion has previously been shown to reflect stress, anxiety, pain, or physical disability.7
We characterized the influence of typical experiment-related interventions, which are not expected to affect rat health or represent a significant burden, by analyzing the sum of detections that occurred after such an intervention and between 1500 and 0700, when no staff was present to disturb the rats. In contrast to our expectations, all nonsurgical interventions tested—a voluntary behavioral test (CatWalk gait analysis), short general anesthesia, blood sampling or vehicle application—significantly decreased activity to similar extents, such that a noninvasive behavior test produced a similar reduction in locomotion activity as did anesthesia followed by intraarticular injection or blood sampling. For all of these interventions, we transferred rats as small groups in small cages to a different room, where they remained for as long as 3 h. This practice likely induced pretesting stress, which was reflected as a reduction in activity during the following night. Reductions in activity did not fall below 50% after these short interventions. More severe decreases in activity can therefore be considered to exceed the usual experiment-induced effects and can be used to estimate disease burden or to identify individual rats with unanticipated decreases in their general health.
To cross-validate the automated tracking system with a conventional health scoring system, we describes 2 cases that illustrate how the rat colony cage system can be used to identify potential health problems. In the first case, overall activity at 6 d after joint instability surgery was reduced significantly in the operated group compared with untreated rats. Although the operated group was expected to and did show a moderate decrease in activity, the activity level of one rat with postsurgical lameness according to visual health scoring was more than 2 SD below the mean of the group and therefore was identified as abnormal.
The overall activity of a rat population can vary from day to day, potentially due to new personnel in or visitors to the facility, noise, new smells, the presence of a new batch of rats in the same or an adjacent room, or even group dynamics. The meaning of such events and their overall influence on rat behavior might be greatly underestimated, because they typically are only barely visibly apparent. However, our current data indicate that the variation in activity within a group (whether treated or healthy) during a given day is relatively low. Therefore, establishing a cut-off value (for example, 2 SD) to define an individual animal's activity relative to that of the remaining group members may be a better predictor of a reduced general condition than is evaluating that particular animal's activity over several days.
In the colony cage, body weight was measured automatically at least once daily for most rats (>98%). We found that weight could identify an animal with a potential health issue despite no noticeable impairment of its activity level. A limitation of body weight measurement is that rats with decreased general health conditions might not enter the weighing station, which is on the highest level of the cage; in addition, this level has no feeding station and has to be accessed through the upper jump hole. However, because a rat that has not entered the automatic weighing station must be weighed manually, the associated visual observation might then reveal a potential impaired condition. In addition, data comparison over time for the individual rat likely will reveal reduced use of the body weighing station as a noticeable deviation. In addition, such rats would be likely to have decreased overall locomotion, especially regarding the upper jump hole. The combination of activity and body-weight tracking may be an ideal complementary system to identify most potential health issues.
A goal is to collect data from daily experimental routines to define an ideal threshold that reliably discriminates an individual rat with a reduced general condition from the normal or expected internal control group. Because all data are transmitted to a network server every 30 min, the colony cage might serve as an online alarm system to notify the attending veterinarian promptly regarding the need to visually examine a particular rat. Our experience shows that within a short period of time, natural variations in activity can be dramatic. Some rats are almost completely immobile for long periods of time, whereas others move a lot. Therefore, a time interval that is long enough to compensate for these interindividual differences over time is necessary to identify real outliers in terms of their degree of spontaneous motion. We found that even within a 6-h period, activity counts varied from almost 0 to 150 detections between rats. In contrast, no rats had fewer than 100 detections during an entire day. These findings suggest that we can expect a minimal level of activity by healthy colony-housed rats during a 24-h period but that rest periods within that day will vary markedly from rat to rat.
Because the colony cage is a modular design and because multiple units can be connected horizontally, it potentially can be used to house very large groups. How an increase in group size (for example, 96 or 144 rats) and habitat size (for example, 2 or 3 cages) influences rat development and the sensitivity of the relative locomotion readout to the health status of individual rats needs to be investigated. In the present study, we started housing rats in colony cages at an average age of 6 wk and housed them until a maximum of 20 wk. We do not know yet how older, potentially less adaptable, rats will associate with cage mates in the group cage.
In conclusion, we established a new housing system for rat colonies that includes an automated activity and body-weight tracking system. Our data suggest that this environment has beneficial effects on rat activity and on ease of handling. In addition, our system proved valuable for the objective and timely identification of individual rats with impaired general-health conditions. The system directly provides data that can be used to refine animal experimentation. Moreover, long-term use of the system might reveal evidence to support reduction of animal numbers. With the health-tracking system, the loss of sick animals potentially can be avoided through earlier identification and appropriate treatment. Furthermore, group sizes potentially might increase to accommodate the individuality that emerges during life in a socially enriched environment, as was shown previously in mice.8 In contrast, the necessary group size might decrease due to refined data collection, as represented by the undisturbed recording of activity behavior in a social context. Furthermore, the translational value of the disease models in the colony cage may increase because as in humans, physical activity and social relations interact in rats. Ultimately, these benefits might allow fewer animals to be used for successful drug development.
We anticipate that data associated with complex activity patterns related to social interaction and different functional areas will prove to be a valuable resource for unraveling rat behavior in the context of different diseases and treatments. Therefore, the next step will be the evaluation of this tool's potential to quantify associated disease and drug-treatment related impairment of symptomatic condition.
Acknowledgments
This study benefitted substantially from the great scientific work of Jennifer Duschek, Lieselotte Winter, and Herbert Ziegler (Merck KGaA); the construction of the tracking hardware and software by Henrik Johansen, Sören Ellegaard, and Sean Dollard (MBRose, Faaborg, Denmark); from project and IT support by Thomas Nelles; and from management of the new system in the animal facility by Silvia Sauer, Nicole Weingärtner, Liane Lang, and Susanne Bog (Merck KGaA).
References
- 1.Barnett SA. 1958. Physiological effects of social stress in wild rats. I. The adrenal cortex. J Psychosom Res 3:1–11. [DOI] [PubMed] [Google Scholar]
- 2.Berman D, Rodin BE. 1982. The influence of housing condition on autotomy following dorsal rhizotomy in rats. Pain 13:307–311. [DOI] [PubMed] [Google Scholar]
- 3.Bilkei-Gorzo A, Gyertyan I, Levay G. 1998. mCPP-induced anxiety in the light–dark box in rats—a new method for screening anxiolytic activity. Psychopharmacology (Berl) 136:291–298. [DOI] [PubMed] [Google Scholar]
- 4.Burrows EL, Hannan AJ. 2013. Towards environmental construct validity in animal models of CNS disorders: optimizing translation of preclinical studies. CNS Neurol Disord Drug Targets 12:587–592. [DOI] [PubMed] [Google Scholar]
- 5.Castelhano-Carlos M, Costa PS, Russig H, Sousa N. 2014. PhenoWorld: a new paradigm to screen rodent behavior. Transl Psychiatry 4:e399. [DOI] [PMC free article] [PubMed] [Google Scholar]
- 6.Castelhano-Carlos MJ, Baumans V, Sousa N. 2016. [PhenoWorld: addressing animal welfare in a new paradigm to house and assess rat behaviour.] Lab Anim. [Epub ahead of print]. [DOI] [PubMed] [Google Scholar]
- 7.Cobos EJ, Portillo-Salido E. 2013. “Bedside-to-bench” behavioral outcomes in animal models of pain: beyond the evaluation of reflexes. Curr Neuropharmacol 11:560–591. [DOI] [PMC free article] [PubMed] [Google Scholar]
- 8.Ferland CE, Laverty S, Beaudry F, Vachon P. 2011. Gait analysis and pain response of 2 rodent models of osteoarthritis. Pharmacol Biochem Behav 97:603–610. [DOI] [PubMed] [Google Scholar]
- 9.Freund J, Brandmaier AM, Lewejohann L, Kirste I, Kritzler M, Kruger A, Sachser N, Lindenberger U, Kempermann G. 2013. Emergence of individuality in genetically identical mice. Science 340:756–759. [DOI] [PubMed] [Google Scholar]
- 10.Gabriel AF, Marcus MA, Honig WM, Joosten EA. 2010. Preoperative housing in an enriched environment significantly reduces the duration of postoperative pain in a rat model of knee inflammation. Neurosci Lett 469:219–223. [DOI] [PubMed] [Google Scholar]
- 11.Hurst JL, Barnard CJ, Tolladay U, Nevision CM, West CD. 1999. Housing and welfare in laboratory rats: effects of cage stocking density and behavioural predictors of welfare. Anim Behav 58:563–586. [DOI] [PubMed] [Google Scholar]
- 12.Huzard D, Mumby DG, Sandi C, Poirier GL, van der Kooij MA. 2015. The effects of extrinsic stress on somatic markers and behavior are dependent on animal housing conditions. Physiol Behav 151:238–245. [DOI] [PubMed] [Google Scholar]
- 13.Lurzel S, Kaiser S, Sachser N. 2011. Social interaction decreases stress responsiveness during adolescence. Psychoneuroendocrinology 36:1370–1377. [DOI] [PubMed] [Google Scholar]
- 14.Malykhin NV, Coupland NJ. 2015. Hippocampal neuroplasticity in major depressive disorder. Neuroscience.309:200–213. [DOI] [PubMed] [Google Scholar]
- 15.Martin LJ, Tuttle AH, Mogil JS. 2014. The interaction between pain and social behavior in humans and rodents. Curr Top Behav Neurosci 20:233–250. [DOI] [PubMed] [Google Scholar]
- 16.Ozbay F, Johnson DC, Dimoulas E, Morgan CA, Charney D, Southwick S. 2007. Social support and resilience to stress: from neurobiology to clinical practice. Psychiatry (Edgmont) 4:35–40. [PMC free article] [PubMed] [Google Scholar]
- 17.Patterson-Kane EG, Hunt M, Harper D. 2002. Rats demand social contact. Anim Welf 11:327–332. [Google Scholar]
- 18.Patterson-Kane EP, Hunt M, Harper D. 2004. Short communication: rat's demand for group size. J Appl Anim Welf Sci 7:267–272. [DOI] [PubMed] [Google Scholar]
- 19.Setton LA, Elliott DM, Mow VC. 1999. Altered mechanics of cartilage with osteoarthritis: human osteoarthritis and an experimental model of joint degeneration. Osteoarthritis Cartilage 7:2–14. [DOI] [PubMed] [Google Scholar]
- 20.Smith MA, Bryant PA, McClean JM. 2003. Social and environmental enrichment enhances sensitivity to the effects of ĸ opioids: studies on antinociception, diuresis and conditioned place preference. Pharmacol Biochem Behav 76:93–101. [DOI] [PubMed] [Google Scholar]
- 21.Szel A, Rohlich P. 1992. Two cone types of rat retina detected by anti-visual pigment antibodies. Exp Eye Res 55:47–52. [DOI] [PubMed] [Google Scholar]
- 22.Torres ILS, Vasconcellos AP, Silveira Cucco SN, Dalmaz C. 2001. Effect of repeated stress on novelty-induced antinociception in rats. Braz J Med Bio Res 34:241 –244. [DOI] [PubMed] [Google Scholar]
- 23.Westenbroek C, Den Boer JA, Veenhuis M, Ter Horst GJ. 2004. Chronic stress and social housing differentially affect neurogenesis in male and female rats. Brain Res Bull 64:303–308. [DOI] [PubMed] [Google Scholar]


