

Abstract
The presence of human erythrovirus DNA in 2,440 blood donations from the United Kingdom and sub-Saharan Africa (Ghana, Malawi, and South Africa) was screened. Sensitive qualitative and real-time quantitative PCR assays revealed a higher prevalence of persistent infection with the simultaneous presence of immunoglobulin G (IgG) and viral DNA (0.55 to 1.3%) than previously reported. This condition was characterized by a low viral load (median, 558 IU/ml; range, 42 to 135,000 IU/ml), antibody-complexed virus, free specific IgG, and potentially infectious free virus. Human erythrovirus genotype 1 (formerly parvovirus B19) was prevalent in the United Kingdom, Malawi, and South Africa. In contrast, only human erythrovirus genotype 3 (erythrovirus variant V9) was prevalent in Ghana. Genotype 3 had considerable genetic diversity, clustering in two probable subtypes. Genotype 1-based antibody assays failed to detect 38.5% of Ghanaian samples containing antibodies to genotype 3 virus but did not fail to detect cases of persistent infection. This study indicates a potential African origin of genotype 3 human erythrovirus and considerable shortcomings in the tools currently used to diagnose erythrovirus infection.
Human erythrovirus (formerly parvovirus B19) is a member of the genus Erythrovirus within the family Parvoviridae (24). Erythrovirus infection occurs frequently in humans. The prevalence of specific immunoglobulin G (IgG) antibodies is 2 to 15% in young children, 30 to 60% in adults, and more than 85% in those 70 years old or older (14). The linear single-stranded DNA genome of this small, nonenveloped virus is about 5 kb long and contains two large open reading frames (ORFs). The first ORF encodes nonstructural protein NS1, and the second one encodes both major VP2 and minor VP1 structural capsid proteins. VP1 consists of a unique sequence of 227 amino acids (VP1u) and is followed by the entire VP2 sequence (554 amino acids). Two additional ORFs encoding small proteins (7.5 and 11 kDa) with unknown functions have also been described (see reference 14 for a review).
Following viral infection in immunocompetent individuals, the predominant immune response is a humoral response, which is assumed to confer protective, lifelong immunity. The early IgM response is directed against VP2, while the mature response mostly involves the production of IgG to VP1 (see reference 14 for a review). Several VP2 and VP1u regions containing neutralizing epitopes have been identified (10, 32, 43). However, neutralizing linear epitopes seem to cluster in the N terminus of VP1u and the VP1-VP2 junction regions and to elicit a more efficient response than the epitopes in the VP2 region, which are mainly conformational epitopes (21, 26, 28, 31, 36). The inability to develop an efficient neutralizing immune response, as observed mainly in immunosuppressed individuals but also in otherwise healthy individuals, may result in the failure to eliminate the virus, thus leading to persistent infection and the possible occurrence of chronic diseases, such as chronic anemia or arthropathies (14). Viral persistence has been documented for several tissues, including bone marrow, synovium, and skin, but in these cases the pathogenicity of the virus remains undetermined (16, 19).
Genetic analysis of human erythrovirus has so far focused mainly on parvovirus B19 strains. Full-length and partial sequence data have shown a low degree of genetic diversity among B19 strains (less than 2%), with a slightly higher degree of variability among viral strains from distinct epidemiological settings and geographical areas (up to 4.8% divergence for the most distant strains). However, some B19 strains obtained from patients with persistent infection have had a higher degree of variability, particularly in the VP1u region (4 and 8% divergence at the DNA and protein levels, respectively) (see reference 11 for a review). With the recent discovery of several strains showing considerable sequence divergence from B19 strains, the genetic variability of human erythroviruses was reexamined. The characterization of these variants indicated that the human erythrovirus group was more diverse than previously thought, and three genetic clusters that were divergent by 10% or more were identified (35). These clusters are now recognized as genotypes 1 to 3.
This study was designed to detect and quantify the three genotypes of human erythrovirus in plasma or serum and to evaluate the frequency of persistent erythrovirus infection in blood donors from the United Kingdom and various regions of sub-Saharan Africa. Through an analysis of viral strains and humoral immune responses from infected individuals, new aspects of the molecular distribution of human erythrovirus in Africa and of virus-immune system interactions have emerged.
MATERIALS AND METHODS
Samples.
Plasma samples from 1,000 United Kingdom donors identified as first-time blood donors by standard interviews were collected between 1999 and 2001 and stored at −20°C (7). Plasma samples from volunteer blood donors were collected between 2001 and 2003 at the Komfo Anokye Teaching Hospital blood bank in Kumasi, Ghana (1, 8). From these plasma samples, 1,000 were randomly selected for human erythrovirus testing. Finally, between 1998 and 1999 and between 1999 and 2000, respectively, plasma samples were collected from 80 blood donors in Ntcheu, Malawi, and from 360 blood donors in Natal, South Africa (6). African samples were stored at −20°C and shipped in dry ice to the Laboratory of Molecular Virology, Division of Transfusion Medicine, Cambridge, United Kingdom. Both United Kingdom and African samples had previously been found negative for human immunodeficiency virus type 1 (HIV-1) and hepatitis C virus (HCV) infections by testing with an HIV-1/HCV transcription-mediated amplification assay (7) or a multiplex hepatitis B virus/HCV/HIV-1 real-time quantitative reverse transcription-PCR assay (8). In addition, plasma sample C39 from a genotype 1-infected individual with a high viral load (1013 IU/ml) was kindly provided by I. Thomas, National Institute of Health, Brussels, Belgium, as a control.
Viral DNA isolation.
Viral DNA was isolated from 200 μl of plasma by using a High Pure viral nucleic acid kit (Roche Diagnostics, Mannheim, Germany) according to the manufacturer's instructions. Nucleic acids were eluted from the filter column with 50 μl of nuclease-free double-distilled water and were stored at −80°C until further use.
Consensus nested PCR for human erythrovirus DNA detection.
Screening of clinical samples for viral DNA was performed by using a consensus nested PCR with primer pairs based on sequences located within the NS1 gene. The outer primers were PVB-1 (5′-CACTATGAAAACTGGGCAATAAAC-3′; positions 1747 to 1770) and PVB-2 (5′-AATGATTCTCCTGAACTGGTCC-3′; positions 1988 to 1967), and the inner primers were PVB-3 (5′-ATAAACTACACTTTTGATTTCCCTG-3′; positions 1765 to 1789) and PVB-4 (5′-TCTCCTGAACTGGTCCCG-3′; positions 1982 to 1965). The positions refer to the erythrovirus V9 sequence (GenBank accession number AX003421). The first PCR round was performed with a 50-μl reaction mixture containing 10 μl of DNA, 1.5 U of AmpliTaq (Applied Biosystems, Warrington, United Kingdom), 2 mM MgCl2, 0.2 mM deoxynucleoside triphosphates (dNTPs), and 0.4 μM each primer. The same conditions were used in the second PCR round, which was performed with 5 μl of first-round amplified products. The cycling profiles were identical for the two rounds and consisted of predenaturation at 95°C for 5 min followed by 38 cycles of 95°C for 30 s, 55°C for 30 s, and 72°C for 30 s. A final extension was performed at 72°C for 10 min.
Human erythrovirus DNA quantification.
Viral DNA was quantified by using an Mx4000 multiplex quantitative PCR (Q-PCR) system (Stratagene, La Jolla, Calif.) and a TaqMan-based methodology. Primers B19F (5′-CTCATCACYCCAGGCGC-3′; positions 1909 to 1925) and B19R (5′-GAGGAAACTGRGCTTCCGACA-3′; positions 2009 to 1989) and probe B19P (5′-TCCCCGGGACCAGTTCAGGAGAAT-3′; positions 1961 to 1984) were designed on the basis of sequences within the NS1 gene. The fluorogenic probe was 5′ labeled with VIC (Applied Biosystems) and 3′ labeled with 6-carboxy-tetramethyl-rhodamine. Amplification was performed in duplicate by using a Brilliant quantitative PCR core reagent kit (Stratagene). The 50-μl Q-PCR reaction mixture contained core PCR buffer, 6 mM MgCl2, 0.8 mM dNTPs, 0.1 μM each primer, 0.2 μM fluorogenic probe, 0.3 μM reference dye (carboxy-X-rhodamine [ROX]), 2.5 U of SureStart Taq polymerase, and 10 μl of template DNA. After an initial incubation at 95°C for 10 min, 40 two-step cycles of 1 min at 60°C and 30 s at 95°C were carried out. For each run, duplicates of a 10-fold serial dilution of the First International Standard for Parvovirus B19 DNA NAT assays 99/800 (National Institute of Biological Standards and Control [NIBSC], Potters Bar, United Kingdom), containing 2 to 20,000 IU of B19 genome per reaction, were used as a reference curve for quantification.
In addition, viral DNA extracted from a plasma sample from an individual infected with a genotype 2 A6-related strain (kindly provided by S. Baylis, NIBSC; original plasma available from the European Directorate for the Quality of Medicines) and plasmid pD91.1-C10, containing the nearly full-length genome of the genotype 3 V9-related strain D91.1 (35) (kindly provided by A. Servant and A. Garbarg-Chenon), were used as genotype 2 and 3 reference samples, respectively.
Human erythrovirus sequencing and genotyping.
Viral DNA for sequencing was obtained by seminested PCR amplification of a 944-bp region spanning the NS1-VP1u junction. First-round PCR was performed with a 50-μl reaction mixture containing 2 mM MgCl2, 0.2 mM dNTPs, 0.4 μM primers PVB-1 and B19SR (5′-CCAGGCTTGTGTAAGTCTTC-3′; positions 2691 to 2672), 3% dimethyl sulfoxide, 8% glycerol, and 1.5 U of Pfu Turbo DNA polymerase (Stratagene). The reaction was performed with 1 cycle of 94°C for 5 min; 50 cycles of 94°C for 30 s, 55°C for 1 min, and 72°C for 1 min 30 s; and 1 cycle of 72°C for 10 min. The primary product was amplified with primers PVB-3 and B19SR and the same reaction conditions, except that 38 cycles of amplification were performed. The PCR products were analyzed by electrophoresis in a 1% low-melting-temperature agarose gel and subsequently purified by using a QIAquick gel extraction kit (Qiagen Ltd., Crawley, United Kingdom). Purified amplicons were sequenced by using an ABI PRISM BigDye terminator cycle sequencing ready reaction kit (version 3.0) and an ABI PRISM 3100 genetic analyzer (Applied Biosystems) according to the manufacturer's instructions.
Phylogenetic analyses were performed as previously described (6, 7), and genotyped erythrovirus sequences from the GenBank database were used as reference sequences (GenBank accession numbers were as follows: genotype 1, AB030694, AF113323, AF162273, AY028237, M13178, M24682, Z70528, Z70560, and Z70599; genotype 2, AJ249431, AJ249434, AY044266, and AY064476; and genotype 3, AJ249430, AX003421, AY083234, AY083238, AY083241, and AY083242).
Detection of antibodies to human erythroviruses.
Antibodies to erythroviruses were detected by using parvovirus B19 IgM and IgG enzyme immunoassays (EIAs) from Biotrin (Dublin, Ireland). These assays use a recombinant VP2 protein to capture IgG and plates coated with anti-μ-chain antibody to capture IgM prior to incubation with biotinylated VP2 antigen. Both assays were performed and interpreted according to the manufacturer's instructions.
Antibodies to the VP2 antigen of erythrovirus variant V9 were detected as follows. Purified recombinant VP1 protein (VP1u and VP2 regions), generously provided by K. Brown (Hematology Branch, National Heart, Lung, and Blood Institute, Bethesda, Md.), was diluted 1:200 in bicarbonate buffer (pH 9.0), used to coat 96-well microtiter plates, and incubated overnight at +4°C. After five washes with phosphate-buffered saline (PBS) containing 0.5% Tween 20 (PBS-Tween), the wells were incubated for 2 h at 37°C with 200 μl of PBS containing 4% bovine serum albumin. After five washes with PBS-Tween, plasma samples (100 μl) diluted 1:50 in PBS were incubated for 60 min at 37°C in duplicate. After five washes with PBS-Tween, 100 μl of peroxidase-conjugated anti-human IgG was added and incubated for 30 min at room temperature. After a further five washes, the substrate was added and incubated for 10 min at room temperature, and then the developed color was read at a wavelength of 450 nm. The cutoff was determined as the mean of four negative controls from United Kingdom blood donors plus 3 standard deviations. Samples with an optical density above the cutoff were considered reactive, and the sample/cutoff (S/CO) ratio was calculated.
Identification of virus-antibody complexes.
Free and IgG-associated viruses were separated by affinity chromatography with protein G-Sepharose by using a monoclonal antibody Trap kit (Amersham Pharmacia Biotech AB, Uppsala, Sweden). Briefly, 500 μl of plasma was diluted 1:2 and filtered through a 0.22-μm-pore-size filter before being loaded onto a protein G-Sepharose column. The flowthrough was collected and reloaded onto the column, which was then washed with 5 ml of Tris-buffered saline solution (pH 7.5). The second flowthrough and the wash fractions (1 ml) were collected and stored as nonretained fractions. Bound material was eluted with 5 ml of 0.1 M glycine HCl buffer (pH 2.5), and the eluted fractions (1 ml) were neutralized with Tris-HCl buffer (pH 9.0). Erythrovirus DNA in both nonretained and eluted fractions was quantified as described above.
Nucleotide sequence accession numbers.
The GenBank accession numbers of the nucleotide sequences analyzed in this study are AY582143 to AY582164.
RESULTS
Detection of human erythrovirus DNA in blood donor plasma.
Consensus nested PCR and real-time Q-PCR assays were developed to detect and quantify the three genotypes of human erythrovirus DNA in plasma or serum. The performance of these assays was first evaluated with serial dilutions of the First International Standard for Parvovirus B19 DNA (NIBSC code 99/800) and with genotype 2 and 3 reference samples. Nested PCR and Q-PCR were both able to detect all genotypes with similar 95% detection limits of 25 and 50 IU-copies/ml, respectively. The Q-PCR dynamic range was determined by using serial dilutions of plasma sample C39 (1013 IU/ml), a genotype 2 strain from the European Directorate for the Quality of Medicines (106 IU/ml), and strain D91.1 (5 × 10¹¹ copies/ml). The dynamic range was linear for over 10 log units for genotypes 1 and 3 and for at least 5 log units for genotype 2. The linear range started at 50 IU/ml for genotypes 1 and 2 and at 50 copies/ml for genotype 3.
First-time blood donors from the United Kingdom (n = 1,000) and random blood donors from Ghana (n = 1,000), South Africa (n = 360), and Malawi (n = 80) were initially screened for human erythrovirus DNA by nested PCR of pools of 10 plasma samples. As shown in Table 1, viral DNA was detected in 7, 12, 2, and 1 pools containing 9 (0.9%), 13 (1.3%), 2 (0.55%), and 1 (1.25%) positive individual samples from donors from the United Kingdom, Ghana, South Africa, and Malawi, respectively. These positive samples were confirmed by Q-PCR and contained a viral load ranging from 42 to 106 IU/ml.
TABLE 1.
Human erythrovirus DNA detection in blood donor plasma samples
| Parameter | Value for samples from the following origin:
|
|||
|---|---|---|---|---|
| United Kingdom | Ghana | South Africa | Malawi | |
| No. of plasma samples testeda | 1,000 | 1,000 | 360 | 80 |
| No. of viral DNA-positive pools | 7 | 12 | 2 | 1 |
| No. (%) of viral DNA-positive individual plasma samples | 9 (0.9) | 13 (1.3) | 2 (0.55) | 1 (1.25) |
| Viral load (IU/ml) | ||||
| Median | 371 | 3,020 | 1,514 | 155 |
| Range | 42-1 × 10⁶ | 158-1.35 × 10⁵ | 248-2,780 | |
Tested in pools of 10 plasma samples by nested PCR.
Molecular characterization of human erythrovirus strains.
An 863-bp region (nucleotide positions 1908 to 2770) that includes the carboxy terminus of the NS1 protein (amino acids 492 to 671) and half of the VP1u antigen (amino acids 1 to 109) was amplified and sequenced from 19 erythrovirus DNA-positive samples (4 samples from the United Kingdom, 12 from Ghana, 2 from South Africa, and 1 from Malawi). Nucleotide and amino acid positions were based on the sequence of parvovirus B19 strain Pvbaua (GenBank accession number M13178). Five United Kingdom and two Ghanaian samples were not tested or not amplified due to plasma volume limitation or a viral load of <100 IU/ml. As explained in further detail below, five samples (Gh1280, Gh2094, Gh2120, Gh2135, and UK4523) were chromatographed on protein G, and sequences obtained from protein G-retained and non-protein G-retained viral DNAs were included in the phylogenetic analysis when sequences from the two fractions had >1% divergence, as in sample Gh1280.
The four strains from the United Kingdom (UK4523, UK4920, UK4983, and UK5537), the two strains from South Africa (SA003848 and SA004059), and the strain from Malawi (BB450299) clustered with genotype 1 reference sequences with bootstrap values of 100% over 1,000 replicates (Fig. 1). No distinct subcluster was observed within the genotype 1 clade. These strains and the genotype 1 reference sequences shared 97 to 99% sequence homology. Sequence homology between the genotype 1 reference sequences and the genotype 2 and 3 reference sequences ranged from 91 to 92% and from 87 to 89%, respectively.
FIG. 1.
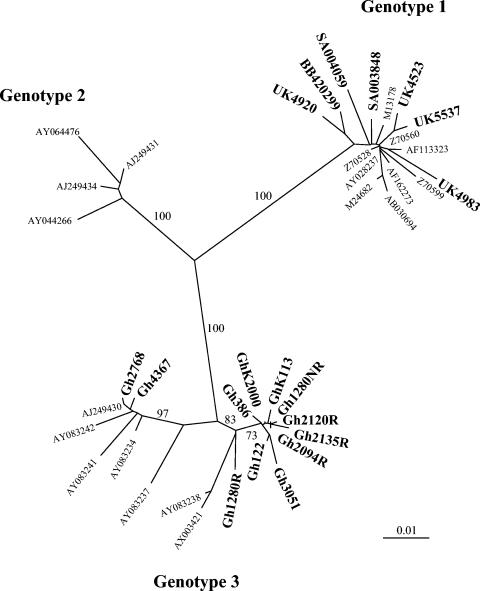
Phylogenetic relationships among human erythrovirus NS1 and VP1u sequences. Four sequences from the United Kingdom, 12 from Ghana, 2 from South Africa, and 1 from Malawi were aligned with 19 human erythrovirus reference sequences from the GenBank database. The three major lineages of human erythrovirus are indicated by the branches. Reference strains are identified by their GenBank accession numbers. The sequences determined in this study are indicated by boldface characters. Only significant bootstrap values (≥75%) are shown.
The 12 strains from Ghana clustered with genotype 3 reference sequences with bootstrap values of 100% over 1,000 replicates. However, two distinct clusters were observed within the genotype 3 clade. Ten Ghanaian strains clustered with reference strain V9 (GenBank accession number AX003421) with bootstrap values of 75% over 1,000 replicates. The average sequence homology between the 10 Ghanaian sequences and the V9 sequence was 97%. The sequences of two other strains, Gh2768 and Gh4367, clustered with sequences related to strain D91.1 (GenBank accession number AY083234) with bootstrap values of 99% over 1,000 replicates. Sequence homology ranged from 97 to 99% in that cluster. These two distinct clusters within the genotype 3 clade shared 96 to 97% sequence homology and showed 88 to 89% and 91 to 92% sequence homology with genotype 1 and 2 sequences, respectively. The ratio of synonymous (Ds) to nonsynonymous (Dn) substitutions in the VP1u ORF was estimated for the two clusters by using the Nei-Gojobori method (http://www.hiv.lanl.gov/content/hiv-db/SNAP/WEBSNAP/SNAP.html). The average Ds/Dn substitution ratio was 8.83, indicating that most of the substitutions were synonymous.
The VP1u amino acid sequences were deduced from the PCR consensus sequences and aligned with the corresponding sequence of the reference parvovirus B19 strain Pvbaua (Fig. 2). The 109-amino-acid partial sequence obtained contains the main neutralization epitopes (14). Ninety-six residues (88%) were conserved among the genotype 1 sequences. Amino acid substitutions were present across the VP1u sequences, and glutamic acid was found at position 4 in all genotype 1 sequences as opposed to lysine in the sequence of reference strain Pvbaua. Similarly, 89% amino acid identity was observed among the genotype 3 sequences from Ghana. Identical amino acid sequences were obtained for strains Gh3051 and GhK2000 and for strains Gh1280NR, Gh2094R, Gh2094NR, and Gh2135NR. The possibility of cross-contamination during sample processing was eliminated, as multiple nucleotide differences were found among the strains. Among the other sequences, the majority of the amino acid substitutions were located in the first 30 residues of VP1u (Fig. 2).
FIG. 2.
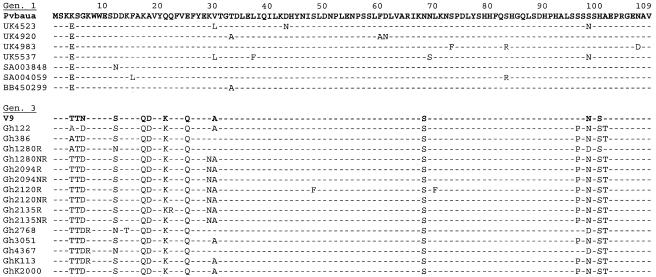
Alignment of VP1u partial amino acid sequences of human erythrovirus genotypes 1 and 3. The sequences determined in this study were aligned with the sequence of the genotype 1 reference strain Pvbaua (GenBank accession number M13178); the sequence of strain V9 (GenBank accession number AX003421) was added for comparison within the genotype 3 group. Residues identical to those in the Pvbaua sequence are indicated by dashes. The numbering of the residues starts at the NH2 terminus of VP1u.
Analysis of the intergenotype variability showed that 79 residues (72.5%) were conserved among all of the strains analyzed, irrespective of their genotype. The amino acid identity between genotype 1 and genotype 3 strains was 85% ± 1% (mean and standard deviation). As shown in Fig. 2, substitutions were located mainly between positions 4 and 30 of VP1u. The main differences were T/A4T5D6, S/N12, Q17D18, K21, and Q25 in genotype 3 sequences instead of E4S5G6, D12, K17A18, Q21, and E25 in genotype 1 sequences. Genotypes 1 and 3 also differed at positions 96 to 101. The motifs SSSSHA and SSNSHA and the motifs PSNSST, SSDSST, and PSDSSA were found in genotype 1 and genotype 3, respectively. An asparagine residue at position 68 in genotype 1 sequences was replaced by a serine in genotype 3 sequences. A comparison of VP1u sequences by using the Kyte-Doolittle and Parker antigenicity methods (http://us.expasy.org/cgi-bin/protscale.pl) indicated very similar hydrophilicity and antigenicity profiles among the erythrovirus strains, regardless of their genotype (data not shown).
Detection of antibodies to parvovirus B19 in DNA-positive and DNA-negative samples from the United Kingdom and Ghana.
All samples containing viral DNA and a representative random group of DNA-negative samples from the United Kingdom and Ghana were tested for the presence of IgG and IgM antibodies to recombinant VP2 protein of genotype 1 erythrovirus by using commercial assays (Table 2). All DNA-positive United Kingdom samples contained IgG antibodies to B19, and one of them also contained IgM antibodies. Eleven of the 13 DNA-positive Ghanaian samples contained detectable IgG to B19, 1 sample also contained a low level of IgM (S/CO ratio, 1.6), but 2 samples (Gh1280 and Gh2135) showed no detectable antibody despite viral loads of 1.2 × 10³ and 1.4 × 10⁵ IU/ml, respectively. The two samples with detectable IgM showed relatively higher viral loads (7.5 × 10⁴ and 1.0 × 10⁶ IU/ml), suggesting an early phase of infection.
TABLE 2.
Anti-VP2 seroreactivity of erythrovirus DNA-positive and -negative samples
| Parameter | Result for samples from the following origin:
|
||||||||
|---|---|---|---|---|---|---|---|---|---|
| United Kingdom
|
Ghana
|
||||||||
| DNA positive (n = 9) | DNA negative (n = 86) | DNA positive (n = 13) | DNA negative (n = 153) | ||||||
| IgM | + | − | − | − | + | − | − | − | − |
| IgG | + | + | − | + | + | + | − | − | + |
| No. (%) | 1 (11) | 8 (89) | 34 (39) | 52 (61) | 1 (8) | 10 (77) | 2 (15) | 46 (30) | 107 (70) |
The presence of IgG to parvovirus B19 was also tested in 86 and 153 erythrovirus DNA-negative samples from the United Kingdom and Ghana, respectively. Reactivity was found in 52 (60.5%) and 107 (70%) of the United Kingdom and Ghanaian samples, respectively. Comparison of the S/CO ratios showed significantly higher values in the DNA-negative United Kingdom samples (mean S/CO ratio, 6; range, 1.8 to 8.7) than in the Ghanaian samples (mean S/CO ratio, 3.3; range, 1.4 to 9.0) (the P value, as determined by the Mann-Whitney test, was <0.0001). No such difference was observed between DNA-positive samples from the United Kingdom (mean S/CO ratio, 4.96; range, 2.6 to 7.3) and those from Ghana (mean S/CO ratio, 4.32; range, 1.5 to 6.8). The difference in S/CO ratios between Ghanaian and United Kingdom samples was not related to age. These results suggest that the lower S/CO ratio in Ghanaian samples might reflect a relatively poor recognition of genotype 1 VP2 antigen by genotype 3 antibodies prevalent in Ghana.
To further explore this hypothesis, an in-house EIA was developed with a recombinant VP1 antigen (VP1u and VP2 regions) from prototype genotype 3 erythrovirus strain V9. For 36 Ghanaian samples (10 reactive and 26 nonreactive in the Biotrin assays), all 10 genotype 1 antigen-reactive samples and 10 of 26 nonreactive samples (38.5%) were reactive with the genotype 3 antigen-derived EIA. However, a significantly lower level of reactivity was observed for the samples reactive with genotype 3 antigen only (mean S/CO ratio, 1.33; range, 1 to 2.3) than for those also reactive with genotype 1 antigen (mean S/CO ratio, 1.97; range, 1.2 to 2.8) (P = 0.002). Among the two DNA-containing samples that were nonreactive with the genotype 1 antigen, Gh2135 was borderline reactive (S/CO ratio, 1.1) and Gh1280 was below the cutoff value. These data suggest that, although Ghanaian samples were more reactive with the V9 genotype 3 VP1 antigen than with the genotype 1 VP2 antigen, the reactivity did not show a clear antigen-antibody match, as had been expected.
Detection of antibody-complexed virus.
Poor or no serologic reactivity might be related either to a substantial difference between the epitopes recognized by the infected donor antibodies and the capture antigens present on the test plate or to a low level of antibodies mostly complexed to viral particles and unavailable to bind capture antigens. To explore these hypotheses, protein G column chromatography was used to separate virus presumably complexed with antibodies from uncomplexed, free virus. In addition to the two samples that were apparently nonreactive in the B19 or V9-based antigen assays, two samples from the United Kingdom (UK4523 and UK4892) and two samples from Ghana (Gh2094 and Gh2120) containing both viral DNA and detectable IgG to both genotype 1 and 3 antigens were tested as controls (Fig. 3). These four samples, with viral loads ranging from 1.0 × 10⁶ to 1.2 × 10⁴ IU/ml, were selected to match the viral loads of Gh1280 and Gh2135 (1.2 × 10³ and 1.4 × 10⁵ IU/ml, respectively). Plasma samples contained 16 to 30 mg of IgG/ml (16 to 22 mg/ml for anti-B19-reactive samples and 17 and 30 mg/ml for Gh2135 and Gh1280, respectively). All of these samples except for UK4523 were anti-B19 IgM negative. The amounts of viral DNA loaded onto the column ranged from 8.5 × 10² to 3.7 × 10⁴ IU/ml. The total percentage of viral DNA in retained and nonretained fractions ranged from 72 to 112% the prechromatography viral load. As shown in Fig. 3, all samples contained 30 to 90% complexed virus, irrespective of the detectability of erythrovirus-specific IgG by EIA. Despite the lack of detectable virus-specific antibody by EIA, the amounts of viral DNA retained on the protein G column for samples Gh1280 and Gh2135 were 30 and 89%, respectively. The eluted fraction still did not react in the genotype 1 antigen-derived EIA. For all samples analyzed, the flowthrough and wash fractions did not contain detectable IgG. These results indicate that the two non-EIA-reactive Ghanaian samples did contain antibody-complexed viral particles and that the proportions of complexed virus retained on the protein G column were similar for both United Kingdom and Ghanaian samples (Fig. 3).
FIG. 3.
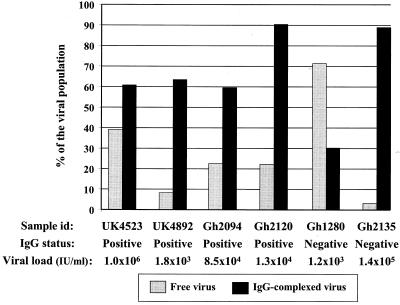
Free and IgG-complexed viruses in six human erythrovirus-infected plasma samples. Antibodies to erythrovirus were detected by using a genotype 1 VP2-based commercial EIA. id, identification.
Characterization of human erythrovirus not complexed to antibodies.
Protein G chromatography revealed that a substantial proportion (4 to 72%) of virus in individuals who had developed an IgG immune response to erythrovirus and had presumably produced neutralizing antibodies was apparently not complexed to IgG and was possibly infectious. Three possible explanations for this observation are proposed: (i) a low level of antibody response, (ii) a low affinity of antibodies, or (iii) the emergence of escape mutants. The last hypothesis was examined by comparing the NS1 and VP1u partial nucleotide and amino acid sequences present in the protein G-retained and non-protein G-retained fractions. Although the viral DNA was quantifiable, we were unable to amplify and sequence the viral DNA in fractionated sample UK4892. In sample UK4523, the nucleotide sequences of both fractions were identical. In contrast, the sequences of retained and nonretained fractions from the four Ghanaian samples showed 6 nucleotide differences (0.7%) in samples Gh2094 and Gh2120, 4 differences (0.46%) in sample Gh2135, and 27 differences (3.1%) in sample Gh1280. Totals of 2 of 6 substitutions (33%), 3 of 6 substitutions (50%), and 19 of 27 substitutions (70%) were synonymous (Fig. 4). The small numbers of substitutions observed in both the NS1 and the VP1u regions did not modify the hydrophilicity or predicted antigenicity of either protein (data not shown).
FIG. 4.
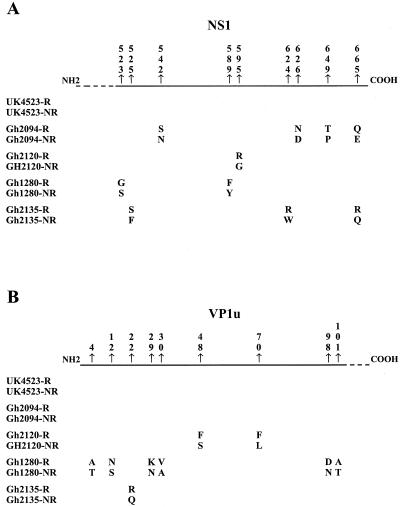
Amino acid substitutions between free and IgG-complexed viruses in five cases of persistent human erythrovirus infection. Partial NS1 (A) and VP1u (B) amino acid sequences of viruses retained (R) and not retained (NR) on protein G columns were aligned. To facilitate the viewing, only differences within each sample are shown, and their positions in the NS1 and VP1u proteins are indicated according to the sequence of reference strain Pvbaua (GenBank accession number M13178).
Analysis of the VP1u sequences showed that the amino acid differences between the retained and the nonretained viruses of samples Gh2135 (one substitution) and Gh1280 (four out of six substitutions) were located in the first 30 residues representing the antigenic region of the protein (Fig. 4B). Common characteristics in the secondary structure of VP1u were consistently predicted (data not shown). An α-helix conformation was expected to be found between positions 15 and 45 in the sequence of the retained fraction of Gh1280, as opposed to two turns flanking a β sheet in the sequence of the nonretained fraction.
DISCUSSION
Using nested PCR and real-time Q-PCR assays, we found similar human erythrovirus DNA prevalences of 0.55 to 1.3% in blood donor samples from four different geographical origins, the United Kingdom, Ghana, South Africa, and Malawi. The prevalences observed were significantly higher than the 0.003 to 0.16% prevalences reported in previous studies (2, 15, 20, 27, 37, 40, 41). This discrepancy was clearly unrelated to sample origin but rather reflected differences in the sensitivity of the assays used in the different studies. The nucleic acid testing (NAT) assays developed in the present study had a higher sensitivity (25 to 50 IU/ml) and a broader linear range (50 to 1010 IU/ml) than in-house or commercial assays previously described (detection limit, ≥100 IU/ml; linear range over 7 log units) (2, 13, 22, 33). Testing minipools of 10 instead of 50 to 1,200 plasma samples also affected detection. For pools of 10 plasma samples, Yoto et al. found a 0.6% prevalence of erythrovirus DNA with a nested PCR assay that had a sensitivity of 100 genome equivalents (geq)/ml (42). The recent identification of at least three fairly distant human erythrovirus genotypes might also have played a role in estimations of the prevalence of circulating viral DNA (35). Commercial NAT assays were developed to detect and quantify human erythrovirus genotype 1 or parvovirus B19 and did not take into account genotypes 2 and 3. The reliability of PCR assays designed for the specific detection of genotypes 1 and 3 (15) should also be reconsidered according to recent evidence showing sequence variations in the primer regions (18, 35). The data presented in Table 1 indicate that erythrovirus DNA is present at low levels in the circulation of considerably more individuals than previously thought, despite the presence of specific IgG. The consistency of the ∼1% prevalence of persistent erythroviral DNA suggests a general phenomenon, probably previously underestimated by test sensitivity and initial plasma pooling.
The second major finding of this study was the identification of a geographical link between erythrovirus genotype 3 and Ghana in West Africa. The geographical distribution of human erythrovirus genotypes is still largely unknown. The predominance of human erythrovirus genotype 1 in the United Kingdom is consistent with previous data; only a few genotype 2 and 3 variants have so far been identified in large-scale screening studies performed in Western countries (15, 19, 30, 35). Until now, genotype 3 strains have occasionally been identified in France, where they have circulated as minority strains accounting for approximately 11% of the strains identified there between 1999 and 2001 (35). Here we report the identification of 11 genotype 3-related (or V9-related) erythrovirus strains that represent 100% of the human erythroviruses detected in blood donors from Kumasi, Ghana (Fig. 1). Although our findings are based on small numbers, it appears that genotype 1 virus is prevalent in southern Africa (South Africa and Malawi). Further molecular studies are needed to circumscribe the area in which genotype 3 is prevalent and to determine whether it originated in Africa.
The presence of three genetic clusters within the human erythrovirus group proposed by Servant et al. (35) was confirmed by the present data, where a clear clustering of genotypes 1 and 3 was observed. Analysis of the Ghanaian NS1-VP1u sequences confirmed the two distinct subclusters (subtypes) previously observed within the genotype 3 clade (Fig. 1) (35). These two subtypes had 4% sequence divergence and were separated by a bootstrap value of >75%. This observation, made in two separate geographical areas (France and Ghana), supports the suggestion that genotype 3 human erythroviruses have evolved in parallel with genotype 1 viruses, rather than having recently emerged (24, 35). The average Ds/Dn substitution ratio of 8.83 obtained for the VP1u region between the two subtypes of genotype 3 reflects an accumulation of synonymous substitutions and suggests long-term evolution after an ancient separation event (24). Additional analyses of full genome sequences are required to definitively confirm the existence of genotype 3 subtypes a and b.
The presence of antibodies to VP2 in erythrovirus DNA-positive and -negative blood donor samples was also examined (Table 2). The results showed that 11 and 8% of the United Kingdom and Ghanaian DNA-positive donors, respectively, were IgM and IgG positive and were considered to be in the early phase of infection. These proportions were lower than those previously reported in studies performed with Belgian (28%) and French (22.2%) blood donors (2, 37). This difference might simply reflect a lack of DNA detection sensitivity that artificially increased the relative proportions of samples with a high viral load, including those containing IgM. The high prevalence of viremia found in this study mainly resulted from persistent infections (∼0.9%, independent of sample origins) characterized by the presence of a low viral load (median, 558 IU/ml; range, 42 to 1.3 × 10⁵ IU/ml) in the presence of IgG only. No significant difference in the frequency of persistent infection and the distribution of viral load between genotype 1 and 3 infections was observed (Table 2). These data suggest that, despite genetic variability, genotypes 1 and 3 have similar host-virus features.
The anti-human erythrovirus IgG seroprevalence of 62% found in United Kingdom blood donors is in agreement with previous reports for the general adult population from the United Kingdom and other developed countries (9, 14, 40). Human erythrovirus seroprevalence in sub-Saharan Africa is largely unknown. In this study, a seroprevalence of 71.3% was initially estimated for Ghanaian blood donors by using a commercial EIA based on a genotype 1-derived VP2 antigen (Tables 1 and 2), but the value increased to 83% when a genotype 3-derived recombinant VP1 antigen (VP1u and VP2 regions) in an in-house EIA was used (Table 3). This prevalence was higher than that reported in Western countries and in South African pregnant women (34) but was consistent with the 82 to 91% B19 seroprevalence found in the adult population of Eritrea (38). Unfortunately, no information is available on the erythrovirus genotype prevalent in Eritrea. Consequently, it is not possible to establish whether the high frequency observed in two distant African countries (Eritrea and Ghana) may be partially explained by infection with a particular genotype or by epidemiologic features characteristic of many parts of Africa.
TABLE 3.
EIA testing of viral DNA-negative Ghanaian samples by two assays
| Genotype 3-derived VP1 EIA result | No. (%) of samples with the following Biotrin assay result:
|
Total no. (%) | |
|---|---|---|---|
| Positive | Negative | ||
| Positive | 10 | 10 | 20 (56) |
| Negative | 0 | 16 | 16 (44) |
| Total | 10 (28) | 26 (72) | 36 (100) |
The results of IgG screening confirmed the high level of serological cross-reactivity between genotype 1- and genotype 3-specific antibodies directed against genotype 1 VP2 capsid protein (29, 35). However, the level of reactivity was significantly lower within the Ghanaian samples than within the United Kingdom samples, and the use of a genotype 3 antigen-based EIA provided a 38.5% increase in the antibody detection rate in the Ghanaian blood donors (Table 3). These results suggest that the level of cross-reactivity between genotypes might be lower than initially expected, considering the high degree of homology of the VP2 protein reported for the three genotypes of erythrovirus (17, 35). Analysis of Ghanaian strain VP2 antigenic properties is now in progress, and preliminary results show limited amino acid divergence compared to that in other genotype 3 strains (0.2%) and genotype 1 strains (2%) (data not shown). The low level of reactivity with the genotype 1 antigen-based assay might result from a combination of both reduced genotype 3 antibody cross-reactivity and/or lower levels of antibodies in viral DNA-negative African samples than in United Kingdom samples. After infection, IgG persists for years (14, 25, 36), and antibody titers decline over time after viral clearance, as has been observed for antibodies to other viruses, such as hepatitis B virus (4, 14). Such a decline over time is supported by an absence of a difference in reactivity for DNA-positive genotypes 1 and 3, in contrast to a decrease in reactivity for DNA-negative Ghanaian donors presumably infected at a younger age than donors in the United Kingdom. An alternative explanation is that the genotype 3 recombinant antigen used in the in-house EIA was the whole VP1 protein, including the VP1u region and the VP2 protein, instead of only the VP2 protein used in the commercial assay. Previous studies showed that the amino-terminal portion of the VP1u region contains immunodominant linear epitopes that are able to elicit an immune response that may last longer than the response to some linear VP2 epitopes but not longer than the response to immunodominant conformational VP2 epitopes (25, 28, 31, 39, 43). The inclusion of VP1u epitopes in serological tests could be considered in order to improve the detection of erythrovirus infection. However, inter- and intragenotype variations at the amino acid level were observed mainly in the Vp1u region (Fig. 2) and might lead to reduced cross-reactivity (10, 11, 35).
As shown in Table 2, two DNA-positive Ghanaian samples (Gh1280 and Gh2135) did not contain detectable IgM or IgG when genotype 1- or 3-based EIAs were used. These donors were unlikely to be in the preseroconversion window period, since viral loads were relatively low (1.17 × 10³ to 1.35 × 10⁵ IU/ml) (23, 41) and protein G chromatography experiments showed that these samples contained IgG-complexed virus. After dissociation of the virus-antibody complexes from the protein G column, no reactivity was detected by EIA, indicating that the antibody detection in the initial plasma samples was not masked by immune complex formation alone. The lack of antibody detection might be due to infection with variants with considerable antigenic divergence. Amino acid sequence data obtained for Gh1280 and Gh2135 did not support that hypothesis, since they were closely related to the other genotype 3 strains that were detected by genotype 1- or 3-based serological tests. It is also possible that the IgG detected by protein G chromatography was not directed against the viral capsid proteins. NS1-specific IgG has been reported to appear late in infection and to be associated with persistence (see reference 14 for a review). In addition, Gigler et al. suggested that the NS1 protein of parvovirus B19 may be partly or temporarily associated with viral particles at very low concentrations (12). It was also previously reported that immunocompromised patients persistently infected with B19 or V9 viruses could have minimal or no detectable IgG to capsid proteins, suggesting a qualitative abnormality in antibody binding to the virus (23, 35). In this study, Gh1280 and Gh2135 were obtained from apparently healthy individuals with no defect in IgG production. Moreover, for Gh2135, 89% of the viral DNA was retained by protein G, indicating efficient binding of antibodies to the virus. A more likely explanation might be that the level of anticapsid antibodies in these two particular samples was below the detection threshold of the serological assays used. In a recent study, 8 out of 25 blood donor plasma samples (32%) were DNA positive and IgM and IgG negative and were assumed to be preseroconversion window period samples, although 5 had viral loads of ≤105 IU/ml, similar to samples Gh1280 and Gh2135 (37). These samples might have contained undetected virus-associated antibodies.
The protein G chromatography results also indicated that 22 to 71% of the total virus detected in all samples tested was free virus despite the presence of specific antibodies (Fig. 3). No relationship was observed between the ratio of complexed virus to uncomplexed virus and genotype, viral load, or EIA reactivity. The consistent presence and, in some cases, the high proportion of apparently free virus might be related to a partially inefficient immune response resulting in a low level of and/or low-affinity antibodies which might dissociate during the process of protein G chromatography. Further studies are needed to establish whether a partially ineffective immunological response could be associated with viral persistence in immunocompetent individuals, as described for immunocompromised patients (23). An alternative explanation might be the emergence of escape mutants leading to persistent infection. The analysis of the NS1-VP1u sequences showed that complexed and free viruses differed from each other by several nucleotide mutations that resulted in amino acid substitutions in VP1u, where the neutralizing epitopes are located, and/or NS1 ORFs (Fig. 4) (28, 31, 39). VP1u conformational epitopes have also been described but appeared to be unaffected by mutations (10, 12). The amino acid substitutions observed in this study did not significantly change the predicted conformation and antigenicity of the VP1u protein, except for Gh1280. This strain had the highest proportion of free virus, the highest number of residue changes, and some predicted capsid protein conformational differences between complexed and free viruses. These findings are compatible with the existence of substantial epitope differences. Studies are in progress to prepare free Gh1280 recombinant proteins to further analyze antibody binding and virus neutralization. No difference was observed in the VP1u sequences from sample Gh2094, but four amino acid substitutions were present in the C terminus of the NS1 protein, which has been reported to contain weak neutralizing epitopes (12). Identical NS1-VP1u sequences of complexed and uncomplexed viruses in sample UK4523, which contained both IgM and IgG, suggest an early phase of infection where an efficient neutralizing immune response was not yet fully developed.
The relatively high frequency of persistent viremia and various proportions of apparently nonneutralized virus have several important implications in transfusion. At present, attention has been drawn toward clinical infections caused by plasma derivatives prepared from pooled plasma samples containing over 104 IU of parvovirus B19 DNA/ml (5). Below such a viral load, there was no evidence of transmission, probably because of the neutralizing capacity of antibodies from recovered individual plasma samples present in the pools. The data collected in this study suggest that specific IgG-containing whole blood or blood components might be infectious, primarily in immunodeficient recipients receiving immunosuppressive drugs for bone marrow or organ transplantation but also in immunocompetent patients who have not been previously exposed to human erythrovirus. Infection by transfusion containing less than 104 geq/ml has been reported in immunocompetent recipients (3, 5). A systematic study of susceptible blood recipients with different immune statuses, transfused with blood components taken from persistently infected donors, needs to be conducted to determine the clinical relevance of this condition in the transfusion setting.
In conclusion, sensitive qualitative and quantitative NAT assays have revealed a higher rate of persistent human erythrovirus infection in blood donors than previously reported. Viral persistence was characterized by a low viral load and a concomitant presence of antibody-complexed and potentially infectious free viruses. Human erythrovirus infection in Ghana was dominated by erythrovirus genotype 3 with a broad genetic diversity that might affect standard diagnostic procedures.
Acknowledgments
We thank S. Owusu-Ofori and F. Sarkodie of the Transfusion Medicine Unit, Department of Medicine, Komfo Anokye Teaching Hospital, Kumasi, Ghana, I. Bates of the Liverpool School of Tropical Medicine, Liverpool, England, and T. Nel of the Natal Blood Transfusion Service, Pinetown, South Africa, who provided blood donor plasma samples from Ghana, Malawi, and South Africa, respectively. We are grateful to K. Brown for providing the V9 recombinant VP1 protein. We thank S. Baylis for providing a genotype 2-infected plasma sample and A. Servant and A. Garbarg-Chenon for providing genotype 3-expressing plasmid pD91.1-C10. We are indebted to I. Thomas for the gift of highly viremic plasma sample C39.
This study was supported in part by Ph.D. fellowships from the National Blood Service, Cambridge, United Kingdom, and by the Ministry of Heath, Republic of Turkey, for N. Etiz.
REFERENCES
- 1.Allain, J.-P., D. Candotti, K. Soldan, F. Sarkodie, B. Phelps, C. Giachetti, V. Shyamala, F. Yeboah, M. Anokwa, S. Owusu-Ofori, and O. Opare-Sem. 2003. The risk of hepatitis B virus infection by transfusion in Kumasi, Ghana. Blood 101:2419-2425. [DOI] [PubMed] [Google Scholar]
- 2.Aubin, J.-T., C. Defer, M. Vidaud, M. Maniez Montreuil, and B. Flan. 2000. Large-scale screening for human parvovirus B19 DNA by PCR: application to the quality control of plasma for fractionation. Vox Sang. 78:7-12. [DOI] [PubMed] [Google Scholar]
- 3.Blumel, J., I. Schmidt, W. Effenberger, H. Seitz, H. Willkommen, H. H. Brackmann, J. Lower, and A. M. Eis-Hubinger. 2002. Parvovirus B19 transmission by heat-treated clotting factor concentrates. Transfusion 42:1473-1481. [DOI] [PubMed] [Google Scholar]
- 4.Brechot, C., V. Thiers, D. Kremsdorf, B. Nalpas, S. Pol, and P. Paterlini-Brechot. 2001. Persistent hepatitis B virus infection in subjects without hepatitis B surface antigen: clinically significant or purely “occult”? Hepatology 34:194-203. [DOI] [PubMed] [Google Scholar]
- 5.Brown, K. E., N. S. Young, B. M. Alving, and L. H. Barbosa. 2001. Parvovirus B19: implications for transfusion medicine. Summary of a workshop. Transfusion 41:130-135. [DOI] [PubMed] [Google Scholar]
- 6.Candotti, D., C. Mundy, G. Kadewele, W. Nkhoma, I. Bates, and J.-P. Allain. 2001. Serological and molecular screening for viruses in blood donors from Ntcheu, Malawi: high prevalence of HIV-1 subtype C and of markers of hepatitis B and C viruses. J. Med. Virol. 65:1-5. [PubMed] [Google Scholar]
- 7.Candotti, D., A. Richetin, B. Cant, J. Temple, C. Sims, I. Reeves, J. A. J. Barbara, and J.-P. Allain. 2003. Evaluation of a transcription-mediated amplification-based HCV and HIV-1 duplex assay for screening individual blood donations: a comparison with a minipool testing system. Transfusion 43:215-225. [DOI] [PubMed] [Google Scholar]
- 8.Candotti, D., J. Temple, S. Owusu-Ofori, and J.-P. Allain. 2004. Multiplex real-time quantitative RT-PCR assay for hepatitis B virus, hepatitis C virus, and human immunodeficiency virus type 1. J. Virol. Methods 118:39-47. [DOI] [PubMed] [Google Scholar]
- 9.Cohen, B. J., and M. M. Buckley. 1988. The prevalence of antibody to human parvovirus B19 in England and Wales. J. Med. Microbiol. 25:151-153. [DOI] [PubMed] [Google Scholar]
- 10.Dorsch, S., B. Kaufmann, U. Schaible, E. Prohaska, H. Wolf, and S. Modrow. 2001. The VP1-unique region of parvovirus B19: amino acid variability and antigenic stability. J. Gen. Virol. 82:191-199. [DOI] [PubMed] [Google Scholar]
- 11.Gallinella, G., S. Venturoli, E. Manaresi, M. Musiani, and M. Zerbini. 2003. B19 virus genome diversity: epidemiological and clinical correlations. J. Clin. Virol. 28:1-13. [DOI] [PubMed] [Google Scholar]
- 12.Gigler, A., S. Dorsch, A. Hemauer, C. Williams, S. Kim, N. S. Young, S. Zolla-Pazner, H. Wolf, M. K. Gorny, and S. Modrow. 1999. Generation of neutralizing human monoclonal antibodies against parvovirus B19 proteins. J. Virol. 73:1974-1979. [DOI] [PMC free article] [PubMed] [Google Scholar]
- 13.Harder, T. C., M. Hufnagel, K. Zahn, K. Beutel, H.-J. Schmitt, U. Ullmann, and P. Rautenberg. 2001. New LightCycler PCR for rapid and sensitive quantification of parvovirus B19 DNA guides therapeutic decision-making in relapsing infections. J. Clin. Microbiol. 39:4413-4419. [DOI] [PMC free article] [PubMed] [Google Scholar]
- 14.Heegaard, E. D., and K. E. Brown. 2002. Human parvovirus B19. Clin. Microbiol. Rev. 15:485-505. [DOI] [PMC free article] [PubMed] [Google Scholar]
- 15.Heegaard, E. D., I. P. Jensen, and J. Christensen. 2001. Novel PCR assay for differential detection and screening of erythrovirus B19 and erythrovirus V9. J. Med. Virol. 65:362-367. [DOI] [PubMed] [Google Scholar]
- 16.Heegaard, E. D., B. L. Petersen, C. J. Heilmann, and A. Hornsleth. 2002. Prevalence of parvovirus B19 and parvovirus V9 DNA and antibodies in paired bone marrow and serum samples from healthy individuals. J. Clin. Microbiol. 40:933-936. [DOI] [PMC free article] [PubMed] [Google Scholar]
- 17.Heegaard, E. D., K. Qvortrup, and J. Christensen. 2002. Baculovirus expression of erythrovirus V9 capsids and screening by ELISA: serologic cross-reactivity with erythrovirus B19. J. Med. Virol. 66:246-252. [DOI] [PubMed] [Google Scholar]
- 18.Hokynar, K., P. Norja, H. Laitinen, P. Palomaki, A. Garbarg-Chenon, A. Ranki, K. Hedman, and M. Sonderlund-Venermo. 2004. Detection and differentiation of human parvovirus variants by commercial quantitative real-time PCR tests. J. Clin. Microbiol. 42:2013-2019. [DOI] [PMC free article] [PubMed] [Google Scholar]
- 19.Hokynar, K., M. Söderlund-Venermo, M. Pesonen, A. Ranki, O. Kiviliuoto, E. K. Partio, and K. Hedman. 2002. A new parvovirus genotype persistent in human skin. Virology 302:224-228. [DOI] [PubMed] [Google Scholar]
- 20.Jordan, J., B. Tiangco, J. Kiss, and W. Koch. 1998. Human parvovirus B19: prevalence of viral DNA in volunteer blood donors and clinical outcomes of transfusion recipients. Vox Sang. 75:97-102. [PubMed] [Google Scholar]
- 21.Kerr, S., G. O'Keeffe, C. Kilty, and S. Doyle. 1999. Undenatured parvovirus B19 antigens are essential for the accurate detection of parvovirus B19 IgG. J. Med. Virol. 57:179-185. [DOI] [PubMed] [Google Scholar]
- 22.Koppelman, M. H. G. M., H. T. M. Cuypers, T. Emrich, and H. L. Zaaijer. 2004. Quantitative real-time detection of parvovirus B19 DNA in plasma. Transfusion 44:97-103. [DOI] [PubMed] [Google Scholar]
- 23.Kurtzman, G. J., B. J. Cohen, A. M. Field, R. Oseas, R. M. Blaese, and N. S. Young. 1989. Immune response to B19 parvovirus and an antibody defect in persistent viral infection. J. Clin. Investig. 84:1114-1123. [DOI] [PMC free article] [PubMed] [Google Scholar]
- 24.Lukashov, V. V., and J. Goudsmit. 2001. Evolutionary relationships among parvoviruses: virus-host coevolution among autonomous primate parvoviruses and links between adeno-associated and avian parvoviruses. J. Virol. 75:2729-2740. [DOI] [PMC free article] [PubMed] [Google Scholar]
- 25.Manaresi, E., G. Gallinella, M. Zerbini, S. Venturoli, G. Gentilomi, and M. Musiani. 1999. IgG immune response to B19 parvovirus VP1 and VP2 linear epitopes by immunoblot assay. J. Med. Virol. 57:174-178. [PubMed] [Google Scholar]
- 26.Manaresi, E., E. Zuffi, G. Gallinella, G. Gentilomi, M. Zerbini, and M. Musiani. 2001. Differential IgM response to conformational and linear epitopes of parvovirus B19 VP1 and VP2 structural proteins. J. Med. Virol. 64:67-73. [DOI] [PubMed] [Google Scholar]
- 27.McOmish, F., P. L. Yap, A. Jordan, H. Hart, B. J. Cohen, and P. Simmonds. 1993. Detection of parvovirus B19 in donated blood: a model system for screening by polymerase chain reaction. J. Clin. Microbiol. 31:323-328. [DOI] [PMC free article] [PubMed] [Google Scholar]
- 28.Musiani, M., E. Mnaresi, G. Gallinella, S. Venturoli, E. Zuffi, and M. Zerbini. 2000. Immunoreactivity against linear epitopes of parvovirus B19 structural proteins. Immunodominance of the amino-terminal half of the unique region of VP1. J. Med. Virol. 60:347-352. [DOI] [PubMed] [Google Scholar]
- 29.Nguyen, Q. T., C. Sifer, V. Schneider, X. Allaume, A. Servant, F. Bernaudin, V. Auguste, and A. Garbarg-Chenon. 1999. Novel human erythrovirus associated with transient aplastic anemia. J. Clin. Microbiol. 37:2483-2487. [DOI] [PMC free article] [PubMed] [Google Scholar]
- 30.Nguyen, Q. T., S. Wong, E. D. Heegaard, and K. E. Brown. 2002. Identification and characterization of a second novel human erythrovirus variant, A6. Virology 301:374-380. [DOI] [PubMed] [Google Scholar]
- 31.Saikawa, T., S. Anderson, M. Momoeda, S. Kajigaya, and N. S. Young. 1993. Neutralizing linear epitopes of B19 parvovirus cluster in the VP1 unique and VP1-VP2 junction regions. J. Virol. 67:3004-3009. [DOI] [PMC free article] [PubMed] [Google Scholar]
- 32.Sato, H., J. Hirata, N. Kuroda, H. Shiraki, Y. Maeda, and K. Okochi. 1991. Identification and mapping of neutralizing epitopes of human parvovirus B19 by using human antibodies. J. Virol. 65:5485-5490. [DOI] [PMC free article] [PubMed] [Google Scholar]
- 33.Schorling, S., G. Schalasta, G. Enders, and M. Zauke. 2004. Quantification of parvovirus DNA using COBAS AmpliPrep automated sample preparation and LightCycler real-time PCR. J. Mol. Diagn. 6:37-41. [DOI] [PMC free article] [PubMed] [Google Scholar]
- 34.Schoub, B. D., N. K. Blackburn, S. Johnson, and J. M. McAnerney. 1993. Primary and secondary infection with human parvovirus B19 in pregnant women in South Africa. S. Afr. Med. J. 83:505-506. [PubMed] [Google Scholar]
- 35.Servant, A., S. Laperche, F. Lallemand, V. Marinho, G. De Saint Maur, J.-F. Meritet, and A. Garbarg-Chenon. 2002. Genetic diversity within human erythroviruses: identification of three genotypes. J. Virol. 76:9124-9134. [DOI] [PMC free article] [PubMed] [Google Scholar]
- 36.Söderlund, M., C. S. Brown, W. J. M. Spaan, L. Hedman, and K. Hedman. 1995. Epitope type-specific IgG responses to capsid proteins VP1 and VP2 of human parvovirus B19. J. Infect. Dis. 172:1431-1436. [DOI] [PubMed] [Google Scholar]
- 37.Thomas, I., M. Di Giambattista, C. Gerard, E. Mathys, V. Hougardy, B. Latour, T. Branckaert, and R. Laub. 2003. Prevalence of human erythrovirus B19 DNA in healthy Belgian blood donors and correlation with specific antibodies against structural and non-structural viral proteins. Vox Sang. 84:300-307. [DOI] [PubMed] [Google Scholar]
- 38.Tolfvenstam, T., M. Enbom, H. Ghebrekidan, U. Ruden, A. Linde, M. Grandien, and B. Wahren. 2000. Seroprevalence of viral childhood infections in Eritrea. J. Clin. Virol. 16:49-54. [DOI] [PubMed] [Google Scholar]
- 39.Tolfvenstam, T., A. Lundqvist, M. Levi, B. Wahren, and K. Broliden. 2001. Mapping of B-cell epitopes on human parvovirus B19 non-structural and structural proteins. Vaccine 19:758-763. [DOI] [PubMed] [Google Scholar]
- 40.Tsujimura, M., K. Matsushita, H. Shiraki, H. Sato, K. Okochi, and Y. Maeda. 1995. Human parvovirus B19 infection in blood donors. Vox Sang. 69:206-212. [DOI] [PubMed] [Google Scholar]
- 41.Weimer, T., S. Streichert, C. Watson, and A. Gröner. 2001. High-titer screening PCR: a successful strategy for reducing the parvovirus B19 load in plasma pools for fractionation. Transfusion 41:1500-1504. [DOI] [PubMed] [Google Scholar]
- 42.Yoto, Y., T. Kudoh, K. Haseyama, N. Suzuki, T. Oda, T. Katoh, T. Takahashi, S. Sekiguchi, and S. Chiba. 1995. Incidence of human parvovirus B19 DNA detection in blood donors. Br. J. Haematol. 91:1017-1018. [DOI] [PubMed] [Google Scholar]
- 43.Zuffi, E., E. Manaresi, G. Gallinella, G. A. Gentilomi, S. Venturoli, M. Zerbini, and M. Musiani. 2001. Identification of an immunodominant peptide in the parvovirus B19 VP1 unique region able to elicit a long-lasting immune response in humans. Viral Immunol. 14:151-158. [DOI] [PubMed] [Google Scholar]