

Abstract
The antibiotic trimethoprim (TMP), a micropollutant found at μg/L levels in raw wastewater, was investigated with regard to its (bio)transformation during biological wastewater treatment. A pilot-scale, nitrifying/denitrifying Sequencing Batch Reactor (SBR) fed with municipal wastewater was monitored for TMP removal during a 16-month monitoring study. Laboratory-scaled bioreactors spiked with TMP were applied to identify the transformation products (TPs). In total, six TPs could be identified from TMP. However, the TP formation was influenced by the spike concentration. At an initial concentration of 500 μg/L TMP, only two TPs were found, whereas at 5 μg/L a completely different transformation pathway led to four further TPs. At low concentrations, TMP was demethylated forming 4-desmethyl-TMP, which was then quickly hydroxylated, oxidized and cleaved forming 2,4-diaminopyrimidine-5-carboxylic acid (DAPC) via two intermediate TPs. DAPC was detected in the SBR effluent in a 3-d composite sample with 61 ng/L, which accounts for 52% of the attenuated TMP. The primary degradation at low spiking levels was best modelled by a pseudo-first order kinetic. Considering the SBR, the model predicted a TMP removal of 88–94% for the reactor, consistent with a monitoring campaign exhibiting an average removal of >83%. Both the TP formation profiles and kinetic modelling indicated that only the results from the bioreactor tests at low spike concentrations were representative of the transformation in the SBR.
Keywords: Trimethoprim, Degradation, Transformation products, Activated sludge, Wastewater, Micropollutants
Graphical abstract

Highlights
-
•
Identification of transformation products of trimethoprim by high-resolution-MS2.
-
•
Transformation products change depending on the initial spike concentration.
-
•
The postulated transformation pathway was observed in a sequencing batch reactor.
-
•
Implications for scaled biodegradation tests and derived transformation pathways.
1. Introduction
The consumption of pharmaceuticals has become a common and important part of modern healthcare. However, these anthropogenic compounds are a potential hazard to the aquatic environment (Luo et al., 2014). Predominantly, these compounds are released into the local sewer system either by excretion via urine/faeces or via direct disposal in the toilet. Most wastewater treatment plants (WWTPs) are primarily designed to remove nutrients and easily degradable carbon compounds. It has been shown that they have limited capacities to remove pharmaceuticals (Joss et al., 2006), making them major sources of these micropollutants in rivers and streams (Metcalfe et al., 2010, Sengupta et al., 2014). Certain pharmaceuticals, such as antibiotics, are of particular concern since emission may foster the development of resistant pathogens discharged into the aquatic environment (Marti et al., 2014). To mitigate the release of micropollutants, an upgrade of conventional wastewater treatment is currently discussed in many countries, including Germany (Hillenbrand et al., 2015). In Switzerland, 2014 saw a revision of the water protection law, which includes the upgrading of a number of Swiss WWTPs specifically for the elimination of micropollutants (Eggen et al., 2014). In Switzerland, the upgrading approaches are usually based on advanced treatment such as activated carbon filters and ozonation, but there is interest in improving and understanding biological processes, which are already established.
In the current study the antibiotic trimethoprim (TMP) was investigated in detail with regard to its removal via biological wastewater treatment. TMP is an antibiotic usually administered in combination with sulfamethoxazole. These two antibiotics target two parts of the bacterial tetrahydrofolic acid synthesis pathway, which is an important cofactor, e.g. for DNA synthesis (Brogden et al., 1982). TMP has been detected in WWTP influents at concentrations ranging from 0.14 to 1.3 μg/L and in effluents from 0.02 to 1.3 μg/L (Le-Minh et al., 2010). In rivers, concentrations of up to 0.02 μg/L have been reported in the UK (Roberts and Thomas, 2006) and up to 0.04 μg/L in Japan (Murata et al., 2011). Reports about the removal of trimethoprim in WWTPs are rather contradictory. In several studies it has been found that TMP is quite resistant to biological wastewater treatment (Göbel et al., 2005, Lindberg et al., 2006), while other studies reported a partial removal of TMP ranging from 40 to 50% (Batt et al., 2006, Radjenović et al., 2009) or even an almost complete removal (Kovalova et al., 2012). However, the reasons for these different results are currently not known. Previous reports about the transformation of TMP also exhibit significant differences. In total, five transformation products (TPs) of TMP have been identified, resulting from hydroxylation reactions and ring opening, but the TPs were not consistent between the different studies (Brenner et al., 2011, Eichhorn et al., 2005, Yi et al., 2012). These TPs have been identified in effluent from an anaerobic reactor treating hospital wastewater, in reactors fed with synthetic wastewater or in lab-scale batch reactors, but have still not been found in municipal WWTPs. Elucidation of TPs is a key aspect of understanding the possible removal mechanisms of micropollutants and to assess whether toxic or refractory products remain after transformation. The current interest in the removal of micropollutants by biological treatment and the growing concern of antibiotic resistant pathogens support the further assessment of the relevance of the reported TPs and the associated transformation pathways of the antibiotic TMP during biological municipal wastewater treatment.
TMP can be transformed in biological wastewater treatment systems. Where removal is observed it is often attributed to removal under aerobic (nitrifying) conditions (Eichhorn et al., 2005, Yi et al., 2012, Batt et al., 2006). However, it is yet unknown if the variability of the TMP removal depends on differences in the investigated treatment processes (Göbel et al., 2007) or if there is temporal variability at fixed treatment conditions over long time scales. Since TMP inhibits the DNA synthesis of certain bacteria, it cannot be ruled out that elevated TMP concentrations often used in lab-scale studies alters the transformation reactions as well as the transformation kinetics. Thus, a deeper look at the aerobic transformation reactions and kinetics at different TMP concentrations is warranted.
Therefore, the objectives of this study were to i) measure the variability of TMP removal in an activated sludge system treating municipal wastewater over a 16-month monitoring period; ii) measure the kinetics of TMP removal in activated sludge in sludge-seeded laboratory-scale reactors under aerobic conditions spiked at different TMP concentrations; iii) investigate the transformation reactions and removal pathway(s) of TMP in these reactors; and iv) transfer the findings of the laboratory studies to the activated sludge system to assess the relevance to native conditions.
2. Methods
2.1. Pilot-scale sequencing batch reactor
A 12-L suspended sludge Sequencing Batch Reactor (SBR) situated on the site of a municipal WWTP with 220,000 person equivalents was used for the study. Incoming municipal wastewater with average concentrations of 220 mg/L BOD, 70 mg/L Ntot, and 16 mg/L Ptot was treated mechanically (screening, grit removal, and sedimentation) at the plant, before being fed to the pilot reactor. The pilot reactor was operated as a conventional nitrification/denitrification process with fixed operational settings: 10-d Solids Retention Time (SRT), 12-h Hydraulic Retention Time (HRT), and a batch duration of 3 h (1-h anoxic conditions followed by 2-h oxic conditions) with a fixed influent volume. On-line sensors connected to a programmable logic controller (Wago 750–881) and a SCADA system (Citect V7.2, Schneider Electric), allowed control of dissolved oxygen concentrations during the oxic phase (1–3 mg/L), and fill levels during all feed and discharge events (9–12 L) as well as continuous monitoring of temperature (15–25 °C) and pH (7.0–7.5).
Influent and effluent samples were collected as 3-d composite samples during a 16-month period. Samples were taken after the settling phase by an automated sampler with refrigerated storage containers. After collection, the samples were immediately filtered (0.45 μm, regenerated cellulose) and stored at −20 °C. A stability test indicated that the compounds of interest were stable during the 3-day collection period. Further details are given in the Supplementary data. The samples were monitored for TMP and its TP concentrations by direct injection, or in some cases via a Solid Phase Extraction (SPE) enrichment step, as described in section 2.5. Additional measurements of dissolved organic carbon (DOC) and inorganic nitrogen species (NO3–-N, NO2–-N, and NH4+-N) confirmed a stable removal of DOC averaging 60%, and ammonium removal averaging 95% during the monitoring period. Detailed parameters are given in the Supplementary data.
2.2. Chemicals
Trimethoprim (TMP) was purchased from Sigma Aldrich (Schnelldorf, Germany). Its metabolite 4-desmethyl-TMP the internal standard trimethoprim-d3 was purchased from Toronto Research Chemicals (Toronto, Canada). Ethyl 2,4-diaminopyrimidine-5-carboxylate was purchased from Activate Scientific (Prien, Germany). All chemicals used for analysis were of ≥95% purity.
2.3. Lab-scale bioreactor incubation experiments
To study the fate of trimethoprim in contact with nitrifying activated sludge, 400 mL bioreactor experiments were set up in light-protected vessels and inoculated with nitrifying activated sludge from the SBR. Activated sludge was either diluted 1:1 with SBR influent for the low dilution experiments or diluted 20:1 with SBR effluent for the high dilution experiments. Effluent was chosen for the 20:1 dilution, since diluting with influent is not practical due to the large matrix effects of influent leading to analytical difficulties. To test the effect of changing the dilution matrix alone, a third experiment was conducted with 1:1 sludge dilution with WWTP effluent. All incubation experiments were conducted with at least one replicate. Throughout the incubation period, the sludge was stirred and aerated with a regulated mixture of air and CO2 via a diffuser. CO2 was added to the gas mixture to compensate for CO2 loss through purging, which would otherwise have led to pH instability (Wick et al., 2009). The pH was maintained at the same level as in the pilot-scale SBR (6.5–7.5). TMP was spiked to the experiments after at least 1 h equilibration time at concentrations of 5 or 500 μg/L. The lower spike level (5 μg/L) was chosen to ensure that down to 1% of TP formation from the parent was still within a detectable range. Control experiments were left unspiked. Further control experiments without biological activity were run concurrently. For these abiotic controls the sludge was filtered (0.2 μm, polyethersulfone) to remove the microbial biomass. Samples of all lab-scale experiments were taken at regular intervals, were immediately filtered (0.45 μm, regenerated cellulose) and were stored at 4 °C prior to analysis via LC–tandem MS.
2.4. Kinetic analysis
The degradation kinetics were modelled according to Schwarzenbach et al. (2005) by either a pseudo-first-order rate law (Eq. (1)) or by a pseudo-zero-order rate law (Eq. (2)):
| (1) |
| (2) |
where [TMP] is the trimethoprim concentration (μg/L), Xss the sludge concentration (gSS/L), kbiol is the pseudo-first-order rate constant in L/(gSS·d), and k'biol the zero-order rate constant in μg/(gSS·d). The uncertainty of kbiol was determined by analysis of 3 replicate batches, or where only 2 replicates were made, by statistical analysis of the regression.
2.5. Analytical methods
TMP and its TPs other than DAPC were analysed by LC–tandem MS via direct injection using an Agilent HPLC system equipped with a ZORBAX Eclipse Plus C18 column (150 × 2.1 mm, 3.5 μm, Agilent Technologies) coupled to a Qq-LIT-MS (API 5500 QTRAP, Sciex, Darmstadt, Germany) with ESI in positive ionization mode. As mobile phase, water with 0.1% formic acid buffer and methanol with 0.1% formic acid buffer were used. Quantification of TMP was performed in MRM mode (Multiple Reaction Monitoring) using trimethoprim-d3 as an internal standard.
High-resolution mass spectra and MSn fragmentation experiments for the identification and characterization of TPs were obtained by Orbitrap-MS (LTQ Orbitrap Velos) coupled by ESI to an Accela HPLC system (both from Thermo Scientific, Bremen, Germany) running the same chromatographic method as described above.
Analysis of DAPC in effluent wastewater included a sample enrichment step using solid phase extraction. Samples were extracted using ENVI-Carb graphitic carbon cartridges (Sigma Aldrich) at pH 7. The cartridges were conditioned with 6 mL methanol and 8 mL of pristine groundwater (pH 7). Wastewater samples (50 mL, pH 7) were loaded onto the cartridges, which were then dried under a light nitrogen gas flow and eluted with 10 mL methanol. The organic phase was evaporated to 0.5 mL at 35 °C under a gentle nitrogen flow. Water (0.3 mL) was added and the mixture was again evaporated to 0.5 mL. Analysis was carried out by LC–HRMS on a Q-ToF-MS (5600 TripleTOF, Sciex) coupled by ESI in positive ionisation mode to an Agilent HPLC system running the same chromatographic method as described above.
For the quantification of DAPC, a direct injection method was used utilizing LC–tandem MS and a standard addition method on the same Qq-LIT-MS system described. To improve the retention a different chromatographic method was used. The HPLC was equipped with a Hypercarb graphitic carbon column (150 × 2.1 mm, 3 μm, Thermo Scientific). The mobile phases for gradient elution were water and acetonitrile. The water was buffered to pH 10 with 0.1% ammonium formiate, while 0.1% ammonia was added to acetonitrile.
Detailed instrumental parameters including MRM transitions used in the above methods are provided in the Supplementary data section.
3. Results and discussion
3.1. Variability of primary removal over time
The concentrations of TMP were monitored in the pilot-scale SBR, which was configured as a nitrifying/denitrifying reactor and fed with the primary effluents of a municipal WWTP as described in section 2.1. Both concentrations in SBR influent and effluent were measured in 3-day composite samples. The elevated fluctuations of the TMP influent concentration has been observed previously (Coutu et al., 2013). Variable influent concentrations of pharmaceuticals are a common phenomenon and are linked to temporal/spatial variability in their use as well as changes in water flow of the sewer system (Petrie et al., 2015).
Initially, the removal of TMP was relatively low. During the initial start-up phase, the average TMP removal was 34% (Fig. 1). This included a period of heavy rainfall in the catchment area of the treatment plant, which caused large variations in the measured TMP removal. These effects can be attributed to dilution of the wastewater and possible biomass loss in the reactor or varying dilution of the SBR influent and effluent samples, which could have led to the very low removals observed. After the start-up phase the removal increased and remained relatively constant with an average of >83% removal during the operational phase. Although the reactor was able to remove nutrients, nitrogen and other micropollutants during both periods, the high removal efficiency of TMP was first achieved after 7 months of operation.
Fig. 1.

Concentrations (ng/L) of TMP in 3-day composite samples of influent and effluent of a pilot-scale SBR over 16 months of the experiment (7-month start-up phase and 9-month operational phase).
A TMP removal of >83% is uncharacteristically high for nitrifying activated sludge reactors with an SRT of 10 d (Batt et al., 2006, Radjenović et al., 2009). However, this does not appear to be an intrinsic process and the removal shows development over time. Since the removal of TMP is a biological process, as shown in the next section, this may be attributed to the microbial community in the reactor which developed in the summer of 2013. Incubation experiments conducted with the SBR sludge and TMP were therefore inoculated with sludge after it had achieved this TMP degrading ability.
3.2. Incubation of trimethoprim in aerobic sludge
The degradation of trimethoprim (TMP) was investigated in lab-scale bioreactors inoculated with activated sludge from the SBR. To assess the influence of the TMP concentration and the effects of the wastewater matrix on the TMP removal, incubations were performed at different spike levels (5 μg/L and 500 μg/L) and sludge dilutions (1:1 and 1:20) with influent wastewater (primary effluent of the WWTP) or effluent wastewater. To confirm that the removal in these incubations was associated with the biomass, a control reactor with sludge filtrate was also established and exhibited no TMP removal or formation of TPs during 4 days of incubation.
In the first set of experiments, the sludge was diluted 1:1 with influent wastewater and spiked with TMP at two different concentrations (500 μg/L and 5 μg/L), (Fig. 2a and b). Removal of TMP was observed in both of these experiments, but proceeded at different rates (Table 1). The primary degradation at 5 μg/L TMP (low spike level) was fast, whereas the primary degradation at 500 μg/L TMP (high spike level) was slower.
Fig. 2.

Time courses of TMP and TPs in lab-scale reactor experiments with activated sludge diluted with influent wastewater. TMP (●), TP306 (□), TP324 (▵), 4-desmethyl-TMP (■), TP292 ( × ), TP290 (▴) and DAPC ( ). A: c0 = 500 μg/L; influent:sludge 1:1 (n = 3), 12-day incubation. The dotted line represents a zero-order kinetic model. B: c0 = 5 μg/L influent:sludge 1:1 (n = 2), 4-day incubation.
Table 1.
Summary of kinetic results.
| TMP spike concentration [μg/L] | Sludge dilution | Corresponding figure | Estimate of kinetic order | DT50 [d] | kbiol L/(gSS·d) | k'biol μg/(gSS·d) |
|---|---|---|---|---|---|---|
| 5 | 1:1 with influent | 2b | Pseudo-first-order | 0.2 | 3.0 ± 0.1 | 5 ± 3 |
| 5 | 1:20 with effluent | 3b | Zero-order | 9.6 | 0.09 ± 0.01 | 0.23 ± 0.02 |
| 5 | 1:1 with effluent | 3c | Pseudo-first-order | 1.2 | 0.63 ± 0.02 | 0.5 ± 0.3 |
| 500 | 1:1 with influent | 2a | Zero-order | >14 | 0.03 ± 0.01 | 9 ± 4 |
| 500 | 1:20 with effluent | 3a | No observed removal | – | – | – |
| 1a | No dilution | S16 | Pseudo-first Order | 0.1 | 4.0 ± 0.5 | – |
Rate constants kbiol were determined by Equation (1) or (2) depending on the kinetic order: kbiol for pseudo-first-order, k'biol for pseudo-zero-order. DT50 is time needed for 50% TMP removal, and ± indicate the uncertainty expressed as 95% confidence intervals.
Experiment conducted in the SBR running in batch mode (no cycling). The uncertainty was estimated by statistical analysis of the regression.
When the sludge dilution was increased from 1:1 to 1:20 and the wastewater matrix was changed from influent to effluent, no removal of TMP could be observed in the experiment with high spike level (500 μg/L; Fig. 3a). At the low spike level (5 μg/L, Fig. 3b), a significant dissipation took place. However, this removal was still slower than in the 1:1 dilution experiment (Fig. 2b).
Fig. 3.

Time courses of TMP and TPs in lab-scale reactor experiments with activated sludge diluted with effluent wastewater. TMP (●), TP306 (□), TP324 (▵), 4-desmethyl-TMP (■), TP292 ( × ) and DAPC (). A: c0 = 500 μg/L; effluent:sludge 20:1 (n = 2). B: c0 = 5 μg/L; effluent:sludge 20:1 (n = 3). The dotted line represents a zero-order kinetic model. C: c0 = 5 μg/L; effluent:sludge 1:1 (n = 2).
In the last experiment, 5 μg/L TMP was incubated in sludge diluted 1:1 with reactor effluent instead of the reactor influent (Fig. 3c). The results again show a contrast to the 20:1 dilution with effluent (Fig. 3b), where the removal is much slower (DT50 of 10 d versus 1 d) (Table 1). The kinetics appears to fit more closely to Fig. 2b, where influent dilution was used (also 1:1), albeit with a longer DT50. Clearly, changing the dilution matrix had an impact on degradation. However, this was not as significant as changing the level of dilution or the spike concentration of TMP.
The data in Fig. 2, Fig. 3 suggest that it would be difficult to fit a pseudo-first-order kinetic model to the degradation shown in Fig. 2, Fig. 3 (high TMP concentration or high sludge dilution). A zero-order model gives a better fit, shown by the dotted lines. The data shown in 2b and 3c suggests more typical degradation kinetics that could fit a pseudo-first order rate law. The rate constants for both kinetic models are given in Table 1. However, further studies at higher sampling frequency are needed to confirm the kinetic order. Comparison of pseudo-first order rate constants (kbiol), show these to be highest at low spike concentrations and low dilution. The zero-order rate constants (k'biol) are based on absolute concentration changes and are therefore more difficult to compare, but are also generally higher at low sludge dilution.
For a more accurate determination of the kinetics of TMP removal, the SBR itself was spiked with 1 μg/L TMP and run in batch mode (no cycling) for two days. A high sampling frequency (8 samples/d) allowed a clear interpretation of the kinetics showing that a pseudo-first-order model fits very well (Table 1 and Supplementary data Fig. S16).
It can be concluded that increasing the TMP to biomass ratio, either by a higher initial TMP concentration or by a significant sludge dilution, lowers the biological rate constants of TMP. Similar kinetic effects of higher substrate concentration have also been observed in degradation studies of ibuprofen (Collado et al., 2012). More recent studies of TMP degradation have found that rate constants are not impacted as long as the TMP to COD ratio remains below 2 × 10⁻³ (Su et al., 2015). This level lies approximately between the two extreme cases tested in this study (around 1 × 10⁻⁴ and 2 × 10⁻²). This supports the result that the removal kinetics can change at higher TMP spike concentration and higher matrix dilutions. To further investigate if this is due to changing kinetics of one primary transformation reaction, as a function of TMP to biomass ratio, or if multiple transformation reactions are involved, each with different kinetics, the formation of TPs was elucidated.
3.3. Identification of transformation products of TMP removal
The TMP incubation experiments with activated sludge were analysed by LC–HRMS to identify transformation products (TPs) and thereby elucidate possible transformation pathways of TMP.
3.3.1. Experiments with high TMP concentration (500 μg/L)
In the experiments with high TMP concentration (Fig. 2, Fig. 3a), in total two TPs were identified during the incubation period: TP306 and TP324. Both could be initially characterized by their chemical formulae and MS² fragmentation spectra (See Supplementary data Fig. S2–3). The two TPs matched well with those reported by Eichhorn et al. (2005) with respect to their exact masses (i.e. their molecular formulae) and their MS² fragmentation spectra. These TPs were present in both high and low sludge-dilution experiments (Fig. 2, Fig. 3a, respectively), although TMP dissipation was only observed at low sludge dilution (Fig. 2a). Quantification was impossible since reference standards were not available. However, by plotting their peak areas as a percentage of the initial TMP peak area over time, their formation rates were assessed. In the high dilution experiment, although TP formation was observed there was no observable removal of TMP (Fig. 3a). The low signals of these TPs would suggest they do not represent a significant fraction of TMP removal. TP306 is formed by a hydroxylation, while TP324 is formed by hydroxylations and several subsequent redox reactions (Scheme 1a).
Scheme 1.

Observed TPs of TMP under aerobic conditions in activated sludge. A: Reactions dominating when 500 μg/L TMP were amended. TP306 and TP324 were previously reported by Eichhorn et al. (2005). B: Reactions found to dominate when 5 μg/L TMP were amended to the reactor. The dashed arrow represents a minor pathway.
3.3.2. Experiments with low TMP concentration (5 μg/L)
The TP identification in the experiments with 5 μg/L TMP and with low sludge dilution (1:1) provided a different picture. Surprisingly, four new TPs were found which appeared sequentially as TMP was degraded. The chemical structures of the TPs were elucidated by their MS² fragmentation patterns (see Supplementary data Fig. S4–7). The time courses of each TP are shown in Fig. 2b. The first three TPs were formed and dissipated in quick succession, which is typical of intermediates in consecutive reactions. These also have a low steady-state concentration, which can be seen from their low peak intensities in comparison to TMP. The most prominent of these TPs had an m/z-ratio of 277.13, corresponding to an exchange of CH3 by a hydrogen atom resulting from a demethylation of one of the aromatic methoxy moieties present in TMP. By comparing the retention time and fragmentation pattern with an analytical standard, the formation of 4-desmethyl-TMP was verified (Scheme 1b). This TP is also a human metabolite of TMP, along with 3-desmethyl-TMP and two N-oxides; in total, around 2.2% of ingested TMP is excreted in the form of 4-desmethyl-TMP (Sigel et al., 1973).
The two other TPs formed at the beginning had the m/z-ratios of 293.12 and 291.11 (TMP has a m/z-ratio of 291.14, which can be easily resolved). Both TPs showed a demethylation of one aromatic methoxy group and the addition of oxygen and differed only by 2H atoms indicating that a redox reaction took place. The position of the oxygen on TP290 could be elucidated by the MS² spectra, showing that an additional oxygen atom was inserted between the phenolic and pyrimidine ring (see Supplementary data Fig. S6). Since the formation of both TPs was closely related and as TP292 was formed before TP290, it can be concluded that TP290 was formed by the oxidation of TP292 (see right graph in Fig. 2b). All MS² fragments of TP292 showed a loss of water which was not observed in 4-desmethyl-TMP or TP290. This suggests that an aliphatic hydroxyl group is located between the two aromatic rings, which was then oxidized to a ketone forming TP290.
The fourth TP of TMP had a smaller mass with only 155.06 and was more stable in contrast to the other TPs formed. Hence, it accumulated to higher concentration levels in the experiment. Based on the molecular formula and the MS2 spectra it was postulated that the pyrimidine ring of TMP was still unaltered, while the di-methoxy-phenolic ring was cleaved and replaced by a carboxylic moiety. Since a reference standard of this TP (2,4-diaminopyrimidine-5-carboxylic acid, DAPC) was not commercially available this TP was synthesized in our laboratory from the ethyl ester derivative by ester hydrolysis (Eq. (3)).
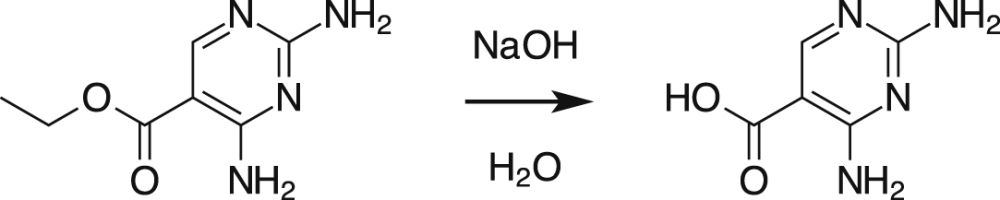 |
(3) |
Details of this synthesis are given in the supplementary information. The chemical structure of the synthesized DAPC, verified by HRMS and MS2, was identical to DAPC formed in the incubation experiments during TMP transformation. The quantification of DAPC showed that it accounted for 90% of the TMP portion degraded in the incubation experiment (Fig. 2b). Hence, it can be confirmed that the proposed transformation pathway was dominant in this experiment, leading to DAPC via 4-desmethyl-TMP, TP292 and TP290 (Scheme 1b).
The sequence of the pathway was further verified by directly spiking 4-desmethyl-TMP (500 μg/L) separately to a sludge-inoculated reactor. In this experiment, 4-desmethyl-TMP was immediately degraded and TP292, TP290 and DAPC were formed in the same order as was observed when TMP was spiked (see Supplementary data Fig. S8a). Although a slow removal of DAPC could be observed (Fig. 2b), no further TPs could be identified. DAPC was also previously found as a photodegradation product of TMP (Michael et al., 2012).
TP306 was only observed in the experiments with high TMP concentrations (500 μg/L), while TP324 was also detected in small amounts when the reactor was amended with low concentrations of 5 μg/L TMP at high dilution or when effluent was used for dilution (Fig. 3b and c, respectively). It is therefore possible that under these conditions, which are of intermediate TMP to biomass ratio, pathway A (Scheme 1) plays a minor role. It cannot be totally ruled out that TP306 can be demethylated into TP292 and thus represents a minor transformation pathway (dashed arrow in Scheme 1). However, this demethylation was not seen in the experiments spiked with 500 μg/L TMP, where TP306 formation was observed. Obviously, the formation of TP306 and TP324 is favoured at higher TMP to biomass ratios, and 4-desmethyl-TMP at lower TMP to biomass ratios, but both reactions, demethylation and hydroxylation, can occur simultaneously as the initial TMP reaction.
3.3.3. Interpretation of the kinetic experiments and observed transformation pathways
Based on the transformation pathways, the different kinetics described in the previous section were caused by more than one initial transformation reaction. At a high initial concentration of TMP (500 μg/L), the previously reported hydroxylation reactions (Eichhorn et al., 2005) were dominant (Scheme 1a), whereas at low initial concentration (5 μg/L) a different pathway, beginning with demethylation, was favoured (Scheme 1b). This example clearly emphasises the importance of the concentration of antibiotics in biodegradation experiments.
Several reasons can be postulated for this observation. One possibility is a toxic/inhibition effect of the antibiotic TMP on bacteria/enzymes that are involved in TMP transformation. Although a general toxic effect on sludge bacteria is rather unlikely, since for sludge bacteria an EC50 of 16 mg/L TMP has been reported (Halling-Sørensen et al., 2000), a toxic/inhibition effect on key species or enzymes carrying out the demethylation of TMP cannot be ruled out.
Another possibility is based on enzyme kinetics with different enzyme saturations of two alternative transformation pathways (Chen et al., 2010, Houston, 2006) or a similar effect caused by differences in membrane transport kinetics. If the enzymes (or transport proteins) of the demethylation pathway quickly reach their saturation at higher TMP concentrations (i.e. the turnover becomes limited by the amount of available free enzyme) the hydroxylation pathway would be favoured, if its enzyme saturation is not reached so quickly. Thus, the hydroxylation rate would increase proportional with the growing concentrations of TMP, meaning these reactions become more dominant. On the other hand at low TMP concentrations the pathway starting with demethylation would be much faster than the hydroxylation pathway and therefore dominates the TMP transformation.
A third possibility is a substrate induced adaption at higher TMP concentrations promoting i) the growth of bacteria involved in the TMP transformation by hydroxylation or ii) the expression of the corresponding enzymes. An induced bacterial growth scenario is considered unlikely, since a lag-phase in TMP removal would be expected to occur in the high spike experiment (Fig. 2a), which was not observed. However it cannot be excluded that an induced enzyme expression of the existing community might be playing a role. Further investigation could help to elucidate which scenarios are more likely, for example toxicity studies, an examination of enzyme kinetics or gene expression during the incubation experiments. These were however not possible within the scope of this study.
In the experiment where an elevated concentration of 500 μg/L 4-desmethyl-TMP was amended to the bioreactor containing a highly diluted sludge (20:1), a fast removal was observed, comparable to the less diluted sludge with a low TMP spike (compare Fig. 2b and S8a in the Supplementary data). Thus, regardless of the effect being kinetic or based on toxicity, obviously the O-demethylation reaction is impacted the most by the higher concentration of TMP.
3.4. Comparing kinetics and transformation pathways in the laboratory and the SBR
3.4.1. Comparing the trimethoprim degradation kinetics between laboratory- and pilot-scale
In the on-site SBR, where the TMP concentration is low and the sludge concentration is high, it was expected that TMP transformation would occur according to Fig. 2b (low spiking level, 5 μg/L, low dilution with influent wastewater) or the batch mode-experiment at 1 μg/L (Supplementary data Fig. S16). To compare this with the observed removal in the pilot reactor, a modelling approach was used. Since studies of the anoxic removal of TMP have found that it has rate constants comparable to, or lower than those under aerobic conditions (Su et al., 2015, Burke et al., 2014), two modelling scenarios were applied: one with similar removal under aerobic and anoxic conditions and one with negligible removal under anoxic conditions. Biological degradation in the SBR was modelled at a fixed influent concentration by iterating Eq. (1) over 20 consecutive batches with a duration of 3 h, a suspended solids concentration of 3.1 gSS/L as measured in the SBR, and the kbiol value obtained from the batch-mode experiment (i.e. 4.0 L/(gSS∙d), Table 1). For the full equations, please refer to the Supplementary Data. Based on the biological degradation model, the predicted TMP removal in the SBR is 88% for the scenario with no anoxic removal and 94% for the scenario with comparable aerobic and anoxic removal rate constants. Both removal scenarios are in good agreement with the average TMP removal of >83% measured in the SBR during the operational period. Thus, the good prediction of the model indicates that the laboratory experiment with the low spiking level of 5 μg/L using only 1:1 diluted sludge with influent wastewater (with an estimated kbiol of 3 L/(gSS∙d)) would provide the best comparability when modelling the SBR with influent TMP concentrations in the range of 150 ng/L.
3.4.2. Occurrence of aerobic TPs in the on-site SBR
To compare the degradation pathway found in lab-scale experiments with the SBR, the TPs present in the effluent of the SBR were measured. The aerobic/anoxic SBR was fed with municipal wastewater containing 100–150 ng/L TMP (Fig. 1). Using sensitive analytical methods based on detection via LC–tandem MS, the SBR effluent was analysed for the presence of all TPs observed in the lab-scale reactors reported in the previous section. The TP, 4-desmethyl-TMP was detected only in a few 3-day composite samples of SBR effluent with concentrations up to 14 ng/L. However, in most cases this TP was not detected in the SBR effluent above the LOQ of 10 ng/L. The TP is an intermediate in the transformation pathway (Scheme 1b) with a low steady-state concentration during the laboratory experiments (Fig. 2b). This might explain its low concentrations and sporadic detection in the SBR effluent despite a consistent removal of TMP during the same period. On the other hand, 4-desmethyl-TMP is also a human metabolite of TMP (Sigel et al., 1973). To confirm that 4-desmethyl-TMP is indeed formed from TMP in the SBR, the reactor was amended with 2.4 μg TMP/reactor (200 ng/L) at the start of every cycle for a period of 12 h (equivalent to the HRT). This led to an elevated concentration of 110 ng/L 4-desmethyl-TMP. This was clear evidence that the initial demethylation of the transformation pathway observed in the lab-scale experiments was also occurring in the on-site SBR.
However, under sterile and aerobic conditions 4-desmethyl-TMP was found to be unstable, since it was oxidized and hydrolysed (for details please refer to the Supplementary data). These abiotic reactions were found to involve oxidation and the subsequent addition of nucleophiles. Since the wastewater matrix contains a high number of nucleophiles, a large variety of addition products could probably be formed after the oxidation of 4-desmethyl-TMP. Similar additions of nucleophiles during wastewater treatment were postulated for codeinone (α,β-unsaturated ketone) an unstable TP of the opiate analgesic codeine (Wick et al., 2011).
TP292 and 290 could not be detected in effluent of the SBR, most likely due to their low steady-state concentration, as already observed in the lab-scale experiments. The quantitative analysis of DAPC, the final TP, was challenging due to its high polarity and low molecular mass. Therefore, a pre-concentration step via SPE was added prior to its detection in SBR influent and effluent. DAPC could be identified in the effluent of the on-site SBR in a 3-day composite sample by its MS2 fragmentation (please refer to Supplementary data Fig. S18). For quantification the standard addition method was used. In a separate 3-day composite sample of the SBR effluent, taken several months later, 61 ng/L DAPC (TMP < 10 ng/L) was detected (see Supplementary data Fig. S19), while it was not found in the corresponding influent containing 221 ng/L of TMP. The detected amount of DAPC accounts for 52% of the attenuated TMP. Considering the results obtained so far, it is likely that the remaining dissipation of TMP is caused by i) nucleophilic addition of sludge constituents to 4-desmethyl-TMP leading to an array of addition products, ii) a further transformation of DAPC to unknown TPs.
The detection of 4-desmethyl-TMP and DAPC in the effluent of the SBR supports the hypothesis that the degradation pathway (Scheme 1b) found in the lab-scale reactors is an important removal pathway of TMP, occurring also in the SBR. Since neither TP306 nor TP324 were detected in the SBR effluent, the pathway (initiated by hydroxylation) detected predominantly at higher spike concentrations, plays obviously no or only a very minor role for the SBR. The variability of TMP removal in the SBR and in municipal WWTPs (Göbel et al., 2005, Batt et al., 2006) is most likely caused by its capability to enable the first demethylation step forming 4-desmethyl-TMP that is rapidly transformed to TP292, TP290 and DAPC.
Previous reports have found hydroxylation (Eichhorn et al., 2005) or hydroxylation followed by catechol ring cleavage (Yi et al., 2012), to be dominant removal processes of TMP. However, this is the first study to our knowledge to show a different transformation pathway of TMP occurring in a nitrifying/denitrifying activated sludge reactor fed with municipal wastewater. Further monitoring of TMP and the TPs found in this study, especially DAPC, in full-scale WWTP effluent will be part of follow-up studies. This will help better judge the wider environmental occurrence of the transformation pathway in different systems.
4. Conclusions
The analysis of transformation reactions in lab-scale bioreactors is a useful tool to assess the transformation of micropollutants in the environment. These findings show that the choice of the initial analyte concentration may not only impact the kinetics of removal but also the dominant reactions themselves can change. This might lead to the transformation pathway stopping at an earlier stage or different TPs becoming more dominant than what is more likely in the natural environment. Although this is shown for one compound, it could have wider implications for biodegradability testing protocols, which often rely on elevated spike concentrations to aid the analysis. This might be especially true for compounds with antibacterial properties.
The alternative reactions at different TMP concentrations might be linked to either limited turnover of specific enzymes or processes or to toxic/inhibition or enzyme activation effects of TMP to the sludge bacterial community at higher concentrations. In particular, O-demethylation of TMP was no longer the dominant reaction at high TMP concentrations. A biological analysis of the sludge that is able to carry out O-demethylation or analysis of the enzyme kinetics and how this is changed at higher concentrations was beyond the scope of this investigation. However, this is an important question for further study and may be helpful to understand the successful degradation of TMP and other micropollutants found in wastewater.
Acknowledgements
We are very thankful to Kathrin Bröder (BfG) for analytical assistance and to Carsten Prasse (UC Berkeley) for helpful discussions. We are also very grateful for the financial support from the European Research Council (ERC) through the EU-Project ATHENE (267897) and the German Federal Ministry of Education and Research (BMBF) through the JPI Water project FRAME (02WU1345A).
Footnotes
Supplementary data related to this article can be found at http://dx.doi.org/10.1016/j.watres.2015.10.026.
Appendix A. Supplementary data
The following is the supplementary data related to this article:
References
- Batt A.L., Kim S., Aga D.S. Enhanced biodegradation of iopromide and trimethoprim in nitrifying activated sludge. Environ. Sci. Technol. 2006;40:7367–7373. doi: 10.1021/es060835v. [DOI] [PubMed] [Google Scholar]
- Brenner C.G.B., Mallmann C.A., Arsand D.R., Mayer F.M., Martins A.F. Determination of sulfamethoxazole and trimethoprim and their metabolites in hospital effluent. Clean. – Soil, Air, Water. 2011;39(1):28–34. [Google Scholar]
- Brogden R.N., Carmine A.A., Heel R.C., Speight T.M., Avery G.S. Trimethoprim: a review of its antibacterial activity, pharmacokinetics and therapeutic use in urinary tract infections. Drugs. 1982;23(6):405–430. doi: 10.2165/00003495-198223060-00001. [DOI] [PubMed] [Google Scholar]
- Burke V., Richter D., Hass U., Duennbier U., Greskowiak J., Massmann G. Redox-dependent removal of 27 organic trace pollutants: compilation of results from tank aeration experiments. Environ. Earth Sci. 2014;71(8):3685–3695. [Google Scholar]
- Chen W.W., Niepel M., Sorger P.K. Classic and contemporary approaches to modeling biochemical reactions. Genes Dev. 2010;24(17):1861–1875. doi: 10.1101/gad.1945410. [DOI] [PMC free article] [PubMed] [Google Scholar]
- Collado N., Buttiglieri G., Ferrando-Climent L., Rodriguez-Mozaz S., Barceló D., Comas J., Rodriguez-Roda I. Removal of ibuprofen and its transformation products: experimental and simulation studies. Sci. Total Environ. 2012;433:296–301. doi: 10.1016/j.scitotenv.2012.06.060. [DOI] [PubMed] [Google Scholar]
- Coutu S., Rossi L., Barry D.A., Rudaz S., Vernaz N. Temporal variability of antibiotics fluxes in wastewater and contribution from hospitals. PLOS One. 2013;8(1):e53592. doi: 10.1371/journal.pone.0053592. [DOI] [PMC free article] [PubMed] [Google Scholar]
- Eichhorn P., Ferguson P.L., Pérez S., Aga D.S. Application of ion trap-MS with H/D exchange and QqTOF-MS in the identification of microbial degradates of trimethoprim in nitrifying activated sludge. Anal. Chem. 2005;77:4176–4184. doi: 10.1021/ac050141p. [DOI] [PubMed] [Google Scholar]
- Eggen R.I.L., Hollender J., Joss A., Schärer M., Stamm C. Reducing the discharge of micropollutants in the aquatic environment: the benefits of upgrading wastewater treatment plants. Environ. Sci. Technol. 2014;48:7683–7689. doi: 10.1021/es500907n. [DOI] [PubMed] [Google Scholar]
- Göbel A., McArdell C.S., Joss A., Siegrist H., Giger W. Fate of sulfonamides, macrolides, and trimethoprim in different wastewater treatment technologies. Sci. Total Environ. 2007;372:361–371. doi: 10.1016/j.scitotenv.2006.07.039. [DOI] [PubMed] [Google Scholar]
- Göbel A., Thomsen A., McArdell C.S., Joss A., Giger W. Occurrence and sorption behavior of sulfonamides, macrolides, and trimethoprim in activated sludge treatment. Environ. Sci. Technol. 2005;39(11):3981–3989. doi: 10.1021/es048550a. [DOI] [PubMed] [Google Scholar]
- Halling-Sørensen B., Lützhøft H.C.H., Andersen H.R., Ingerslev F. Environmental risk assessment of antibiotics: comparison of mecillinam, trimethoprim and ciprofloxacin. J. Antimicrob. Chemother. 2000;46:53–58. [PubMed] [Google Scholar]
- Hillenbrand T., Tettenborn F., Menger-Krug E., Marscheider-Weidemann F., Fuchs S., Toshovski S., Kittlaus S., Metzger S., Tjoeng I., Wermter P., Kersting M., Abegglen C. German Environmental Agency (UBA); Dessau: 2015. Measures to Reduce Micropollutant Emissions to Water. Summary, Texte 87/2014. [Google Scholar]
- Houston P.L. Dover Publ; Mineola, New York: 2006. Chemical Kinetics and Reaction Dynamics. [Google Scholar]
- Joss A., Zabczynski S., Göbel A., Hoffmann B., Löffler D., McArdell C.S., Ternes T.A., Thomsen A., Siegrist H. Biological degradation of pharmaceuticals in municipal wastewater treatment: proposing a classification scheme. Water Res. 2006;40(8):1686–1696. doi: 10.1016/j.watres.2006.02.014. [DOI] [PubMed] [Google Scholar]
- Kovalova L., Siegrist H., Singer H., Wittmer A., McArdell C.S. Hospital wastewater treatment by membrane bioreactor: performance and efficiency for organic micropollutant elimination. Environ. Sci. Technol. 2012;46(3):1536–1545. doi: 10.1021/es203495d. [DOI] [PubMed] [Google Scholar]
- Le-Minh N., Khan S.J., Drewes J.E., Stuetz R.M. Fate of antibiotics during municipal water recycling treatment processes. Water Res. 2010;44(15):4295–4323. doi: 10.1016/j.watres.2010.06.020. [DOI] [PubMed] [Google Scholar]
- Lindberg R.H., Olofsson U., Rendahl P., Johansson M.I., Tysklind M., Andersson B.A.V. Behavior of fluoroquinolones and trimethoprim during mechanical, chemical, and active sludge treatment of sewage water and digestion of sludge. Environ. Sci. Technol. 2006;40(3):1042–1048. doi: 10.1021/es0516211. [DOI] [PubMed] [Google Scholar]
- Luo Y., Guo W., Ngo H.H., Nghiem L.D., Hai F.I., Zhang J., Liang S., Wang X.C. A review on the occurrence of micropollutants in the aquatic environment and their fate and removal during wastewater treatment. Sci. Total Environ. 2014;473–474(0):619–641. doi: 10.1016/j.scitotenv.2013.12.065. [DOI] [PubMed] [Google Scholar]
- Marti E., Variatza E., Luis Balcazar J. The role of aquatic ecosystems as reservoirs of antibiotic resistance. Trends Microbiol. 2014;22(1):36–41. doi: 10.1016/j.tim.2013.11.001. [DOI] [PubMed] [Google Scholar]
- Metcalfe C.D., Chu S., Judt C., Li H., Oakes K.D., Servos M.R., Andrews D.M. Antidepressants and their metabolites in municipal wastewater, and downstream exposure in an urban watershed. Environ. Toxicol. Chem. 2010;29:79–89. doi: 10.1002/etc.27. [DOI] [PubMed] [Google Scholar]
- Michael I., Hapeshi E., Osorio V., Perez S., Petrovic M., Zapata A., Malato S., Barceló D., Fatta-Kassinos D. Solar photocatalytic treatment of trimethoprim in four environmental matrices at a pilot scale: transformation products and ecotoxicity evaluation. Sci. Total Environ. 2012;430:167–173. doi: 10.1016/j.scitotenv.2012.05.003. [DOI] [PubMed] [Google Scholar]
- Murata A., Takada H., Mutoh K., Hosoda H., Harada A., Nakada N. Nationwide monitoring of selected antibiotics: distribution and sources of sulfonamides, trimethoprim, and macrolides in Japanese rivers. Sci. Total Environ. 2011;409(24):5305–5312. doi: 10.1016/j.scitotenv.2011.09.014. [DOI] [PubMed] [Google Scholar]
- Petrie B., Barden R., Kasprzyk-Hordern B. A review on emerging contaminants in wastewaters and the environment: current knowledge, understudied areas and recommendations for future monitoring. Water Res. 2015;72:3–27. doi: 10.1016/j.watres.2014.08.053. [DOI] [PubMed] [Google Scholar]
- Radjenović J., Petrović M., Barceló D. Fate and distribution of pharmaceuticals in wastewater and sewage sludge of the conventional activated sludge (CAS) and advanced membrane bioreactor (MBR) treatment. Water Res. 2009;43:831–841. doi: 10.1016/j.watres.2008.11.043. [DOI] [PubMed] [Google Scholar]
- Roberts P.H., Thomas K.V. The occurrence of selected pharmaceuticals in wastewater effluent and surface waters of the lower Tyne catchment. Sci. Total Environ. 2006;356(1–3):143–153. doi: 10.1016/j.scitotenv.2005.04.031. [DOI] [PubMed] [Google Scholar]
- Sengupta A., Lyons J.M., Smith D.J., Drewes J.E., Snyder S.A., Heil A., Maruya K.A. The occurrence and fate of chemicals of emerging concern in coastal urban rivers receiving discharge of treated municipal wastewater effluent. Environ. Toxicol. Chem. 2014;33(2):350–358. doi: 10.1002/etc.2457. [DOI] [PubMed] [Google Scholar]
- Sigel C.W., Kunin C.M., Grace M.E., Nichol C.A. Metabolism of trimethoprim in man and measurement of a new metabolite: a new fluorescence assay. J. Infect. Dis. 1973;128(Supplement 3):S580–S583. doi: 10.1093/infdis/128.supplement_3.s580. [DOI] [PubMed] [Google Scholar]
- Su L., Aga D., Chandran K., Khunjar W.O. Factors impacting biotransformation kinetics of trace organic compounds in lab-scale activated sludge systems performing nitrification and denitrification. J. Hazard. Mater. 2015;282:116–124. doi: 10.1016/j.jhazmat.2014.08.007. [DOI] [PubMed] [Google Scholar]
- Schwarzenbach R.P., Gschwend P.M., Imboden D.M. John Wiley & Sons, Inc.; Hoboken, New Jersey: 2005. Environmental Organic Chemistry. pp. 687–773. [Google Scholar]
- Wick A., Fink G., Joss A., Siegrist H., Ternes T.A. Fate of beta blockers and psycho-active drugs in conventional wastewater treatment. Water Res. 2009;43:1060–1074. doi: 10.1016/j.watres.2008.11.031. [DOI] [PubMed] [Google Scholar]
- Wick A., Wagner M., Ternes T.A. Elucidation of the transformation pathway of the opium alkaloid codeine in biological wastewater treatment. Environ. Sci. Technol. 2011;45:3374–3385. doi: 10.1021/es103489x. [DOI] [PubMed] [Google Scholar]
- Yi T., Barr W., Harper W.F. Electron density-based transformation of trimethoprim during biological wastewater treatment. Water Sci. Technol. 2012;65(4):689–696. doi: 10.2166/wst.2012.917. [DOI] [PubMed] [Google Scholar]
Associated Data
This section collects any data citations, data availability statements, or supplementary materials included in this article.