

Abstract
Maturation of human immunodeficiency virus (HIV) depends on the processing of Gag and Pol polyproteins by the viral protease, making this enzyme a prime target for anti-HIV therapy. Among the protease substrates, the nucleocapsid-p1 (NC-p1) sequence is the least homologous, and its cleavage is the rate-determining step in viral maturation. In the other substrates of HIV-1 protease, P1 is usually either a hydrophobic or an aromatic residue, and P2 is usually a branched residue. NC-p1, however, contains Asn at P1 and Ala at P2. In response to the V82A drug-resistant protease mutation, the P2 alanine of NC-p1 mutates to valine (AP2V). To provide a structural rationale for HIV-1 protease binding to the NC-p1 cleavage site, we solved the crystal structures of inactive (D25N) WT and V82A HIV-1 proteases in complex with their respective WT and AP2V mutant NC-p1 substrates. Overall, the WT NC-p1 peptide binds HIV-1 protease less optimally than the AP2V mutant, as indicated by the presence of fewer hydrogen bonds and fewer van der Waals contacts. AlaP2 does not fill the P2 pocket completely; PheP1′ makes van der Waals interactions with Val82 that are lost with the V82A protease mutation. This loss is compensated by the AP2V mutation, which reorients the peptide to a conformation more similar to that observed in other substrate-protease complexes. Thus, the mutant substrate not only binds the mutant protease more optimally but also reveals the interdependency between the P1′ and P2 substrate sites. This structural interdependency results from coevolution of the substrate with the viral protease.
Human immunodeficiency virus type 1 (HIV-1) matures after the viral protease processes (35) the Gag and Pol polyproteins at 10 substrate locations (3, 15). Therefore, inhibition of HIV-1 protease represents an important avenue for antiviral therapy (13, 48). The substrate sequences cleaved by the protease are nonhomologous (3), with the sequence of the nucleocapsid-p1 (NC-p1) substrate being the most different. In spite of the poor sequence homology among the substrate sites, a series of substrate-protease crystal structures led us to hypothesize that substrate specificity in HIV-1 protease results from the enzyme's recognizing an asymmetric shape (or envelope) rather than a particular amino acid sequence (40). This shape results from the conformation that a particular substrate sequence can adopt, implying that an interdependency necessarily exists among the different substrate residue sites.
All of the protease inhibitors whose designs were structure based bind competitively (8, 18, 28, 52, 53) at the active site. Since these inhibitors bind at the same site as the substrates, many protease residues contact both substrates and inhibitors. Drug resistance, which often develops in the presence of therapeutic protease inhibitors, results from high viral turnover, the infidelity of the viral reverse transcriptase (16, 42, 43), and selective pressure on the virus. With drug resistance, the protease no longer binds as tightly to inhibitors but retains the ability to recognize and cleave its substrate sites.
The first drug-resistant mutation that often occurs in patients, V82A (47), is frequently associated with indinavir or ritonavir therapy (5, 9, 11, 30). Our previous studies have shown that V82A is a prime site for drug resistance to occur, as the valine at residue 82 is not critical for substrate recognition but does extensively contact many of the commonly used inhibitors (39). However, the apparent coevolution of the NC-p1 cleavage site (AP2V) with the V82A mutation in the protease (1, 10, 20, 55) implies that Val82 plays an important role in the protease's recognition of the NC-p1 substrate, a role that is lost when the V82A mutation occurs.
Within the viral context, the NC-p1 cleavage site is the slowest (50), final (37, 54), and, therefore, rate-determining site in HIV-1 Gag to be processed by the viral protease (6, 37). NC-p1 has a polar Asn at the P1 position, while a hydrophobic or aromatic residue is found at the same location in the other substrate sequences. An Ala occupies the P2 position of the NC-p1 substrate, while a branched side chain (14) exists at P2 in the other substrate sequences. The rate and order in which NC-p1 is cleaved may be dictated by its unusual sequence as well as by the location of this site within the Gag polyprotein.
In several studies of drug-experienced patient viral sequences, the NC-p1 substrate cleavage site has been seen to mutate (1, 6, 10, 24, 44, 55). The most frequently observed change occurs at P2, where the alanine mutates to a valine in viral sequences that also contain the V82A drug-resistant protease mutation. Selection for a valine at this site makes sense as valine is the wild-type (WT) residue at P2 in another substrate sequence, the capsid-p2 cleavage site. In fact, the WT HIV-1 protease cleaves AP2V in the NC-p1 cleavage site more efficiently than it cleaves the WT NC-p1 sequence (12).
The present study focuses on elucidating the structural rationale for HIV-1 protease recognition of the NC-p1 cleavage site. We determined the crystal structures of both the WT and V82A HIV-1 proteases in complex with their respective NC-p1 substrates. As seen in our previous studies (40), there is an interdependency between the substrate subsites throughout the cleavage site sequence that allows for the sequence to be recognized as a substrate sequence by HIV-1 protease.
MATERIALS AND METHODS
Nomenclature.
HIV-1 protease variants (WT or V82A), the nucleocapsid-p1 (NC-p1) WT substrate, and its AP2V mutant substrate will be distinguished throughout this article by subscript and superscript acronyms. For example, WTNC-p1WT denotes the WT substrate NC-p1 in complex with the WT protease, and AP2VNC-p1V82A denotes the AP2V mutant substrate in complex with the V82A mutant protease.
Substrate peptides.
Two decameric peptides, WTNC-p1 (P5 to P5′: ERQAN*FLGKI) and AP2VNC-p1 (P4 to P6′: RQVN*FLGKIN), with sequences corresponding to the NC-p1 substrate cleavage site within the Gag polyprotein, were chosen as previously described (40). The slight difference in the regions of the cleavage sites that were crystallized occurred because the AP2VNC-p1 peptide (P5 to P5′: ERQVN*FLGKI) was not very soluble, whereas the decameric peptide (P4 to P6′: RQVN*FLGKIN) was. Both peptides were purchased from Quality Controlled Biochemicals Inc., Hopkinton, Mass.
Mutagenesis, protein purification, and crystallization.
The protease was expressed from a synthetic gene optimized for Escherichia coli codon usage with Q7K to prevent autoproteolysis (45). This gene was used as the starting template for mutagenesis to introduce the D25N (to prevent the protease from cleaving its substrates) and V82A substitutions. Mutations were made by using a QuickChange site-directed mutagenesis kit (Stratagene, La Jolla, Calif.).
Protein expression, isolation, and purification were carried out as previously described (17). The purified protease, in 50% acetic acid, was then refolded by rapid 10-fold dilution into a mixture of 0.05 M sodium acetate (pH 5.5), 10% glycerol, 5% ethylene glycol, and 5 mM dithiothreitol (refolding buffer). The diluted protein was concentrated on an Amicon ultrafiltration cell and dialyzed to remove any residual acetic acid. Protease used for crystallization was further purified by using a Pharmacia Superdex 75 fast-performance liquid chromatography column equilibrated with refolding buffer.
Crystals were grown by the hanging drop, vapor diffusion method as previously described (38, 39, 49). Stock solutions (25 mM) of substrate peptides used for cocrystallization were dissolved in refolding buffer rather than in dimethyl sulfoxide. The protein concentration was approximately 1 mg ml−1. Small crystals started appearing after 6 to 8 weeks, with the longest length between 0.1 and 0.2 mm.
Data collection.
Crystals chosen for data collection were flash frozen in a nitrogen stream. X-ray data on these cryocooled crystals were collected on our in-house Rigaku X-ray generator with an R-axis IV image plate system. Approximately 200 5-min frames were collected per crystal with 1-degree oscillations and no overlap between frames. The frames were later integrated and scaled by using the programs DENZO and ScalePack, respectively (29, 34). The WTNC-p1WT and AP2VNC-p1V82A complexes diffracted up to 2.1 and 2.0 Å, respectively. Complete data collection statistics are listed in Table 1.
TABLE 1.
Crystallographic statistics for the two NC-p1 complexes
| Variable | WTNC-p1WT | AP2VNC-p1V82A |
|---|---|---|
| Substrate | ERQAN*FLGKI | RQVN*FLGKIN |
| Data collection | ||
| Space group | P212121 | P212121 |
| a (Å) | 51.1 | 50.8 |
| b (Å) | 57.7 | 57.3 |
| c (Å) | 61.5 | 60.9 |
| Z | 4 | 4 |
| Temperature (°C) | −80 | −80 |
| Resolution (Å) | 2.1 | 2.0 |
| Total number of reflections | 38149 | 80252 |
| Number of unique reflections | 10450 | 12492 |
| Rmerge (%) | 9.2 | 7.5 |
| Completeness (%) | 94.1 | 99.7 |
| I/σI | 4.5 | 9 |
| Crystallographic refinement | ||
| R value (%) | 20.6 | 19.5 |
| Rfree (%) | 23.3 | 23.1 |
| Sigma cutoff | 0 | 0 |
| RMSDa in: | ||
| Bond lengths (Å) | 0.004 | 0.005 |
| Bond angles (°) | 1.5 | 1.3 |
RMSD, root mean square deviation.
Structure solution and crystallographic refinement.
The CCP4i interface to the CCP4 suite and related software modules (4) was used for most of the operations described in this section. The molecular replacement package AMoRe (33) was used to solve the structures. X-ray data within 8.0 to 3.0 Å were used for structure solution by employing a Patterson radius of 25 Å. An inhibitor-protease complex obtained from the Protein Data Bank (PDB code 1MTR) (27) was used as the search model. The molecular replacement solutions had typical correlation function and R values of 78 to 81 and 29 to 31%, respectively. After structure solutions were obtained, Refmac5 (32) was used to perform a rigid body refinement of 25 cycles on data to 3.0 Å. Although the R values for both complexes decreased slightly, the free R dropped considerably to just above 30%. ARP/wARP (31) was used to improve the initial phases. Graphical rebuilding was performed with CHAIN (46), and the substrate peptides were modeled. The real space refinement package RSREF (2) was used to adjust the model to fit the electron density maps. Repeated rounds of Refmac5 and manual rebuilding were performed until the refinement converged. The final refinement statistics are also listed in Table 1.
RESULTS
Overall structure of the complexes.
Two decameric substrate peptides corresponding to the Gag polyprotein cleavage sites of NC-p1 (ERQAN*FLGKI) and its AP2V mutant (RQVN*FLGKIN) were crystallized in complex with inactive (D25N) variants of WT and drug-resistant HIV-1 protease having the V82A mutation (referred to as WTNC-p1WT and AP2VNC-p1V82A complexes, respectively). Although the peptides used for crystallization span a slightly different region of the cleavage site (P5 to P5′ and P4 to P6′), these differences are likely to have minimal or no effect on the bound conformation of the substrate. From our previous experience with to determine substrate complexes with HIV protease (38, 39, 49), the P5 and P5′ residues usually have no contact with the protease and are often disordered in the electron density. Thus, the presence or absence of P5 or P6′ is unlikely to impact how the substrate is packed in the active site. The WTNC-p1WT and AP2VNC-p1V82A complexes were refined to respective resolutions of 2.1 and 2.0 Å. Their crystallographic statistics are listed in Table 1. Eight substrate residues (P4 to P4′) in the WTNC-p1WT complex and all 10 substrate residues (P4 to P6′) in the AP2VNC-p1V82A complex were identified from the electron density maps. The side chains of GlnP3 in both of these complexes are disordered. Otherwise, residues at P2 to P3′ were unambiguously located within the electron density. The WTNC-p1WT complex has larger temperature factors than the AP2VNC-p1V82A complex, with average overall temperature factors of 40 and 27 Å2, respectively. The higher temperature factors in the WTNC-p1WT complex could be due to increased thermal motions, possibly resulting from a more dynamic fit between the protein and substrate.
As observed in other HIV-1 protease-substrate complexes (40, 51), the substrates exist in an extended β-strand conformation (Fig. 1). However, a difference between the two complexes is observed in the φ and ψ angles for the P1 and P1′ residues that flank the scissile peptide bond (Fig. 1). The φ and ψ angles for the WTNC-p1WT complex are −60° and 34°, respectively, for P1 and −50° and 152°, respectively, for P1′, whereas for the AP2VNC-p1V82A complex, they are −72° and 87°, respectively, for P1 and −102° and 143°, respectively, for P1′. These angles are still in the “generally allowed β-strand region” of the Ramachandran plot (41). Significant shifts are seen in the ψ angle of P1 (53o) and the φ angle of P1′ (52o), resulting in a large change in the orientation of the P1 carbonyl oxygen (Fig. 1).
FIG. 1.

Conformation of the NC-p1 substrates. Stereo diagram of the superposition of the WT (cyan) and AP2V (magenta) variants of NC-p1 peptides. An arrow indicates the difference in conformation of the scissile bonds between the two structures. The superposition was based on structurally conserved parts of the respective protease structures. Disordered side chains, whose conformation could not be resolved in the electron density, have their names listed in parentheses.
Double difference plots were calculated (39) in order to elucidate regions where changes have occurred between the α-carbon backbones of the WTNC-p1WT and AP2VNC-p1V82A complexes (Fig. 2a). Double difference plots allow for comparison of two complexes without superimposing them and, thus, are unbiased by which residues are chosen for the superposition. To compute these plots, the distances between all the Cα atoms within each of the complexes are calculated, and the difference in these Cα-Cα distances between the two complexes is mapped as a contour plot. The contour plot indicates that the P1 loops (Gly78-Asn83) in the two monomers are more than 1Å farther apart in the WTNC-p1WT complex than in the AP2VNC-p1V82A complex (Fig. 2a, box A). Similarly, the distances between the P1 loops and the flaps within the monomers are larger in the WTNC-p1WT complex (Fig. 2a, boxes B1 and B2). These two observations suggest that the P1 loops in the AP2VNC-p1V82A complex have moved closer to each other in response to amino acid modifications at position 82 and at P2 in the substrate (Fig. 3a). Calculation of the shape complementarity (21) between the two substrates and their respective proteases shows that the complementarity is much better for the AP2VNC-p1V82A complex (0.71) than for the WTNC-p1WT complex (0.58). Thus, the AP2V substrate appears to fit more tightly within the V82A HIV-1 protease than the WT substrate within its protease.
FIG. 2.

Double difference plots. Relative shifts in the V82A complexes in reference to the corresponding WT complexes with NC-p1 (a), CA-p2 (b), and p1-p6 (c). Double difference plots contour differences in internal Cα-Cα distances between two complexes. Each contour line represents a deviation by 0.25 Å. Black, green, blue, and red distinguish the contour ranges −1.0 Å and below, −1.0 to −0.5 Å, 0.5 to 1.0 Å, and 1 Å and above, respectively. In panel a, box A corresponds to conformational changes between the P1 loops (Gly78-Asn83) from each of the two monomers, and boxes B1 and B2 correspond to the conformational changes between the P1 loop with respect to the flap (Ile50) within each of the two monomers. All of the boxed regions emphasize internal regions of the protease whose relative conformation has changed by more than 1.0 Å between the two complexes.
FIG. 3.

Superposition of WT and V82A complexes. (a) Stereo diagram of the superimposed active site residues in the WTNC-p1WT (in gray and cyan) and AP2VNC-p1V82A (in magenta and purple) complexes. Protease residues within 4.2Å of the substrate are shown in ball-and-stick representation, and residue 82 is highlighted in yellow. The substrate mutation site (P2) is circled, and regions exhibiting large structural changes are indicated with arrows. Similarly, panels b and c show the superposition of CA-p2 and p1-p6, respectively, in complex with the WT and V82A protease variants. Note that there are virtually no conformational changes seen between the WT and V82A complexes in these two complexes.
We have previously determined the crystal structures of the WT and V82A protease variants with three other Gag polyprotein substrates: MA-CA, CA-p2, and p1-p6 (39, 40). Based on their crystallographic statistics, the latter two were chosen for double difference distance analysis. Only minor changes were previously observed between these WT and V82A variant structures (Fig. 2b and c and Fig. 3b and c) (39). The previous study, which also analyzed WT and V82A variant protease complexes with two protease inhibitors (saquinavir and ritonavir) approved by the Food and Drug Administration, found that Val82 is more crucial for inhibitor binding than for substrate recognition. However, the large structural deviations we find in the present study between the WTNC-p1WT and AP2VNC-p1V82A complexes, along with the coevolution of AP2V, implicate Val82 as important for the recognition of the NC-p1 cleavage site.
Hydrogen bonds.
All of the substrate complexes of HIV-1 protease show an extensive network of 12 to 18 hydrogen bonds between the proteases and their respective substrates. This network also exists in the two NC-p1 substrate-protease structures (Table 2). Three hydrogen bonds seen in the AP2VNC-p1V82A structure but not in the WTNC-p1WT complex were compensated by two new hydrogen bonds in the latter. However, the lengths of the hydrogen bonds conserved between the two complexes differ by 0.2 to 0.8 Å, with the hydrogen bonds in the WTNC-p1WT complex almost always being longer. The lengths of the conserved hydrogen bonds in the AP2VNC-p1V82A complex agree well with the average hydrogen bonding distances for corresponding interactions in the other substrate-protease complexes (40) (39) (Table 2). Only two hydrogen bonds in the AP2VNC-p1V82A complex are longer by 0.1 Å, and six others are shorter by 0.2 Å than the average distance. In the WTNC-p1WT complex, on the other hand, the hydrogen bond lengths are generally longer by 0.2 to 0.8 Å from the average hydrogen bond lengths found in the other nine protease-substrate structures. Rearrangement of the φ and ψ angels near the scissile bond in the AP2VNC-p1V82A complex (Fig. 1) may be attributed to improved hydrogen bonding in that structure relative to the WTNC-p1WT complex.
TABLE 2.
Substrate-protease hydrogen bonds formed by the two NC-p1 substrates
| Substrate atom | Protein atom | Length (Å) of hydrogen bond
|
D1 − D2a | Average bond length (Å)b | |
|---|---|---|---|---|---|
| WTNC-p1WT (D1) | AP2VNC-p1V82A (D2) | ||||
| AlaP4 O | Gly48 N | 3.2 | 3 | + | 3 |
| AlaP4 N | Asp30 OD2 | 2.9 | + | ||
| AlaP3 N | Asp29 OD2 | 3.5 | 3.3 | + | 2.9 |
| AlaP3 O | Asp29 N | 3.6 | 2.8 | + | 3 |
| Ala/ValP2 N | Gly48 O | 3.2 | 2.8 | + | 2.9 |
| AsnP1 N | Gly27 O | 3.2 | 2.8 | + | 2.8 |
| AsnP1 ND2 | Gly27 O | 3.5 | + | ||
| AsnP1 O | Asn25 ND2 | 3.2 | 2.5 | + | 2.7 |
| LeuP2′ N | Gly27′ O | 3.2 | 2.9 | + | 3 |
| LeuP2′ O | Asp29′ N | 3.1 | 2.9 | + | 3.2 |
| LeuP2′ O | Asp29′ OD2 | 3.6 | − | ||
| GlyP3′ N | Gly48′ O | 3.1 | 2.8 | + | 2.8 |
| GlyP3′ O | Gly48′ N | 3.1 | 2.8 | + | 3 |
| GlyP3′ O | Asp30′ OD2 | 3.3 | + | ||
| AlaP4′ N | Asp29′ OD2 | 3.6 | 3 | + | 2.9 |
| AlaP4′ N | Asp30′ OD2 | 3.5 | − | ||
| AlaP4′ O | Asp30′ OD2 | 2.4 | − | ||
| AlaP5′ N | Asp30′ OD2 | 3.3 | |||
| AlaP6′ N | Met46′ O | 2.5 | |||
| AlaP6′ O | Met46′ N | 2.8 | |||
+, hydrogen bond is longer in the WTNC-p1WT complex than in the AP2VNC-p1V82A complex; −, hydrogen bond is shorter in the WTNC-p1WT complex than in the AP2VNC-p1V82A complex. Note that if no distance is listed for a particular interaction, it is because that distance is well beyond hydrogen bonding distance.
In general, the hydrogen bonds between the substrates and HIV-1 protease involve the peptide backbones (40, 51). This is also the case in the NC-p1 complexes, where only one substrate side chain is involved in hydrogen bonds. AsnP1 ND2 makes a weak hydrogen bond (3.5 Å) with Gly27 O in the AP2VNC-p1V82A complex. This is the only substrate complex structure where a hydrogen bond is observed between the protease and the side chain of P1. This hydrogen bond, however, is absent in the WTNC-p1WT structure. Although the side chains of ArgP4, GlnP3, and LysP4′ could possibly be making hydrogen bonds, they are disordered in both complexes and so cannot be observed. Hence, apart from the lone and weak AsnP1 ND2-Gly27 O hydrogen bond, there appears to be no stable side chain hydrogen bond in either complex.
In addition to direct substrate-protease hydrogen bonds, water-mediated hydrogen bonds were also examined, as they can be relevant in rational drug design (22). Out of the five water sites conserved among HIV-1 protease complexes (23, 25, 40), only four are observed in the WTNC-p1WT complex (Fig. 4). However, all five of the water molecules are found in the AP2VNC-p1V82A complex. The water molecule that is absent in the WTNC-p1WT complex (Fig. 4, W3) directly mediates substrate backbone (GlnP3 O) with the protease (Gly27 O, Asp29 OD1, and Arg8 NE). Absence of this water bridge, in the WTNC-p1WT complex may be a direct consequence of the poor substrate-protease hydrogen bonding.
FIG. 4.

Variations in the substrate-protease hydrogen bonds between the WTNC-p1WT and AP2VNC-p1V82A complexes. In the superimposed active site regions of the WTNC-p1WT (gray and cyan) and the AP2VNC-p1V82A (magenta and purple) complexes, only those side chains that form protease-substrate hydrogen bonds are explicitly shown (Asn 25, 25′; Asp29, 29′; Asp30, 30′; and AsnP1). Water molecules are shown with van der Waals surfaces. The AP2VNC-p1V82A complex forms additional hydrogen bonds compared with the WTNC-p1WT complex. These are highlighted with dotted yellow lines (Tables 2 and 3).
In addition to the five conserved water molecules, three other water molecules stabilize the AP2VNC-p1V82A complex. The side chain of AsnP1 forms a hydrogen bond with W2 (Fig. 4 and Table 3), which itself forms a hydrogen bond with the conserved W3. W7 mediates interactions between the backbone atoms of Gly48′ (N) and LysP4′ (O) in the AP2VNC-p1V82A complex. The third water site, W8, bridges the side chain oxygens of Asp30′ with IleP5′N. Thus, these three additional water molecules appear to further stabilize the AP2VNC-p1V82A complex, whereas the absence of the W3 water site may be indicative of the higher level of disorder in the WTNC-p1WT complex.
TABLE 3.
Water-bridging network involving substrates and protease
| Water site |
WTNC-p1WT
|
AP2VNC-p1V82A
|
||||
|---|---|---|---|---|---|---|
| Substrate atom(s) | Water | Protein atom(s) | Substrate atom(s) | Water | Protein atom(s) | |
| W1 | Ala P2 O | Wat25 | Ile50 N | ValP2 O | Wat33 | Ile50 N |
| Phe P1′ O | Ile50′ N | PheP1′ O | Ile50′ N | |||
| W2 | Disordered | AsnP1 ND2 | Wat93 | Arg8′ NE | ||
| Wat27 | ||||||
| W3 | Disordered | GlnP3 Oa | Wat27 | Gly27 O | ||
| Asp29 OD1 | ||||||
| Arg8′ NE | ||||||
| Wat93, Wat4 | ||||||
| W4 | Wat6 | Thr26 O | Wat4 | Thr26 O | ||
| Asp29 OD1 | Asp29 OD1 | |||||
| Arg87 NE | Arg87 NE | |||||
| Wat27 | ||||||
| W5 | LeuP2′ O | Wat9 | Gly27′ O | LeuP2′ O | Wat55 | Gly27′ O |
| Asp29′ OD1 | Asp29′ OD1 | |||||
| Wat1 | Arg8 NE | |||||
| Wat9 | ||||||
| W6 | Wat1 | Thr26′ O | Wat9 | Thr26′ O | ||
| Arg87′ NE | Asp29′ OD1 | |||||
| Wat9 | Arg87′ NE | |||||
| Wat55 | ||||||
| W7 | LysP4′ Oa | Wat112 | Gly48′ N | |||
| W8 | IleP5′ Na | Wat50 | Asp30′ OD1 and OD2 | |||
These residues are currently modeled as alanines due to lack of electron density.
van der Waals interactions.
Both V82A and AP2V mutations involve changes in the size of their hydrophobic side chains. A detailed examination of the substrate residues P2 to P2′ (GlnP3 is disordered in both complexes and GlyP3 has no side chain) reveals several rearrangements in packing between the two complexes. At residue 82, the site of the protease mutation, packing between PheP1′ and residue 82 is lost with the V82A mutation (Fig. 5a and Table 4). For each substrate residue, the closest van der Waals contact made by each atom in that residue with the protease atoms was measured, and an average contact distance was calculated for the residue. PheP1′, which makes four additional van der Waals contacts to Gly27′, Leu23, Pro81, and Val82 in the WTNC-p1WT complex is an average of 0.3Å closer relative to its contact distance in the AP2VNC-p1V82A complex. The remaining substrate side chains within P2 to P2′, AsnP1, ValP2, and LeuP2′, are significantly closer to the protease in the AP2VNC-p1V82A complex by 0.5, 0.4, and 0.4 Å, respectively (Fig. 5b and c and Table 4), and make 14, 7, and 10 additional van der Waals contacts, respectively. These additional contacts occur because of a change in the conformation of AsnP1 (Fig. 1) that enables it to fit within the pocket formed by Gly27, Pro81′, and Asn25′ (Fig. 5c). LeuP2′ also changes conformation (Fig. 1) and forms closer van der Waals contacts with Gly27′, Ala28′, and Asp30′ (Fig. 5c). The two added methyl groups in ValP2 allow it to make new contacts with Val32 CG2 and Ile50 CD. (However, in the WTNC-p1WT complex, the side chain of Ile50 is disordered in the electron density map.) However, no change is seen in the conformation of residues Val32, Ile47, and Ile84′, which line the corresponding P2 pocket (Fig. 3a). Thus, except for the PheP1′ Val82 interaction, the overall van der Waals packing in the AP2VNC-p1V82A complex is better than in the WTNC-p1WT complex. The loss of contact from the V82A mutation is compensated by the gain of contacts throughout the AP2VNC-p1V82A complex due to the AP2V substitution, implicating a subtle balance of interdependency between the different residues within the substrate. These results support the previous observation that the P2 substrate site for HIV-1 protease is preferentially a β-branched amino acid (14) and, in particular, a valine (7).
FIG. 5.
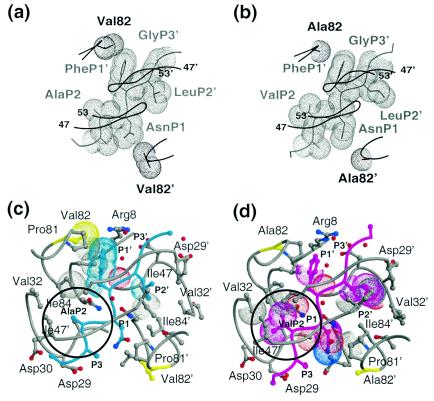
Variations in the substrate-protease van der Waals interactions between the WTNC-p1WT and AP2VNC-p1V82A complexes. van der Waals surfaces of protease residue 82, viewed down the dimer twofold axis, and neighboring atoms of the corresponding NC-p1 substrate: (a) WTNC-p1WT complex (note that Val82 contacts PheP1′) and (b) AP2VNC-p1V82A complex (note that no contact is made between Ala82 and the substrate). Substrates and proteases are distinguished in gray and black, respectively. A Cα trace of the overlying flaps is also shown. (c) Active site residues in the WTNC-p1WT. The protease is shown in gray and the substrate in cyan. Protease residues within 4.2Å of the substrate are shown in ball-and-stick representation, and residue 82 is highlighted in yellow. van der Waals contacts that are lost compared with the AP2VNC-p1V82A complex are highlighted with dotted surfaces and the P2 site is circled. (d) Active site residues in the AP2VNC-p1V82A. The protease is shown in gray, and the substrate is shown in magenta; protease residues within 4.2Å of the substrate are shown in ball-and-stick representation, and residue 82 is highlighted in yellow. van der Waals contacts that are lost compared with the WTNC-p1WT complex are highlighted with dotted surfaces, and the P2 site is circled.
TABLE 4.
Total number of van der Waals contacts among substrate residues between P2-P2′ and HIV-1 protease
| Substrate residue | No. of contacts
|
|
|---|---|---|
| WTNC-p1WT | AP2VNC-p1V82A | |
| Ala/ValP2 | 10 | 24 |
| AsnP1 | 19 | 26 |
| PheP1′ | 29 | 25 |
| LeuP2′ | 28 | 34 |
DISCUSSION
The NC-p1 cleavage site is the rate-determining step in the processing of the Gag polyprotein (7, 37, 54). The amino acid sequence of this site, with an Asn at P1 and an Ala at P2, is also the least homologous compared with the other HIV-1 protease substrates sites, which have hydrophobic residues at P1 and branched residues at P2. If either P1 or P2 is replaced with Phe, Leu, Met, and Tyr or with Val, respectively, the site is cleaved more efficiently (36). Peptide library screens find that the P2 site within NC-p1 is preferentially a Val (7). However, these substitutions are not seen in WT virus, implying that a more efficient and presumably premature cleavage of this site may be detrimental to viral maturation (19, 26, 36).
The NC-p1 cleavage site has been seen to coevolve in response to the V82A drug-resistant mutation in HIV-1 protease, with the Ala residue at P2 mutating to a Val (1, 10, 20, 55). Previous studies on the kinetics of substrate cleavage have shown that this mutation results in the substrate's being cleaved 2.1 times more efficiently (ratios of kcat/Km [mutant substrate/WT substrate]) for the V82A protease variant and 2.6 times more efficiently for WT HIV-1 protease (12). However, despite the enzymatic advantage, the AP2V mutation is not observed in sequences of the WT virus. In this study we have determined the crystal structures of two NC-p1 substrate complexes, the WTNC-p1WT complex and the AP2VNC-p1V82A complex, in order to understand the structural basis for this coevolution. Residue 82 is not in direct van der Waals contact with the P2 site of the substrate, so the coevolution is not as simple as a decrease in the size of one residue corresponding to an increase in the size of a neighboring residue. However, unlike what we have observed in other substrate complexes (CA-p2, MA-CA, and p1-p6), where the substrates make no or minimal contact with Val82 (39), in the WTNC-p1WT complex Val82 does make contact with both AsnP1 and PheP1′. Thus, in comparison with the other WT substrate complexes, residue 82 appears to be more important for recognition of the NC-p1 substrate cleavage site, and when the drug-resistant V82A mutation occurs, the interactions at P1 and P1′ are perturbed.
The question remains of why the loss of contact at P1 and P1′ would affect the residue at P2. Compared with the other substrate complexes where the P2 residue usually makes van der Waals contacts with protease residues in its surrounding pocket, in the WTNC-p1WT complex, the Ala at P2 is unable to do so. In addition, the hydrogen bonds in the WTNC-p1WT complex (Table 2) between the substrate and the protease are longer than those observed in other substrate complexes. The lack of interactions at the P2 site and the lengthening of the hydrogen bonds possibly indicate that NC-p1 binds in the active site of HIV-1 protease less optimally than in the other substrate cleavage sites.
In the AP2VNC-p1V82A complex, the PheP1′ and, to a lesser extent, the AsnP1 lose contact with residue 82. This loss of contact at residue 82 would probably cause the NC-p1 substrate to fit even more poorly within the active site of HIV-1 protease. However, the Val substitution at P2 fills the protease pocket, allowing van der Waals interactions to occur with the surrounding protease residues, thereby apparently stabilizing the conformation of the substrate within the active site. Additional evidence of stabilization is demonstrated in the hydrogen bonding pattern in the AP2VNC-p1V82A complex, which is more comparable, in terms of both the greater numbers of hydrogen bonds and shorter hydrogen bonding distances, to those seen in other substrate complexes (Table 2) than it is to the WTNC-p1WT complex. The ValP2, therefore, appears to compensate for the V82A mutation by restabilizing the NC-p1 substrate site through alternative interactions within the active site cavity. This suggests that for optimal HIV-1 protease recognition of the NC-p1 substrate site, a possible interdependency exists between the P1′ and P2 positions. This interdependency thereby accounts for the seemingly unusual coevolution of the NC-p1 substrate site (AP2V) with the V82A drug-resistant mutation within HIV-1 protease. This coevolution is necessary as the HIV-1 protease drug resistant mutation, V82A, directly impacts the recognition and cleavage of the NC-p1 site, a rate-determining step in viral maturation.
Acknowledgments
We thank Claire Baldwin for assisting with editorial advice. We also acknowledge Balaji Bhyravbhatla and Luca Leon for technical support and Mohan Somasundaran and Jared Auclair for useful discussions. We thank Ronald Swanstrom for critical discussions.
This research was supported by the National Institutes of Health (grant R01-GM64347).
REFERENCES
- 1.Bally, F., R. Martinez, S. Peters, P. Sudre, and A. Telenti. 2000. Polymorphism of HIV-1 type 1 Gag p7/p1 and p1/p6 cleavage sites: clinical significance and implications for resistance to protease inhibitors. AIDS Res. Hum. Retrovir. 16:1209-1213. [DOI] [PubMed] [Google Scholar]
- 2.Chapman, M. S. 1995. Restrained real-space macromolecular refinement using a new resolution-dependent electron density function. Acta Crystallogr. Sect. D 51:69-80.15299337 [Google Scholar]
- 3.Chou, K.-C., A. G. Tomasselli, I. M. Reardon, and R. L. Heinrikson. 1996. Predicting human immunodeficiency virus protease cleavage sites in proteins by a discriminant function method. Proteins 24:51-72. [DOI] [PubMed] [Google Scholar]
- 4.Collaborative Computational Project, Number 4. 1994. The CCP4 suite: programs for protein crystallography. Acta Crystallogr. Sect. D 50:760-763. [DOI] [PubMed] [Google Scholar]
- 5.Condra, J. H., W. A. Schleif, O. M. Blahy, L. J. Gabryelski, D. J. Graham, J. C. Quintero, A. Rhodes, H. L. Robbins, E. Roth, M. Shivaprakash, D. Titus, T. Yang, H. Teppler, K. E. Squires, P. J. Deutsch, and E. Emini. 1995. In vivo emergence of HIV-1 variants resistant to multiple protease inhibitors. Nature 374:569-571. [DOI] [PubMed] [Google Scholar]
- 6.Cote, H. C. F., Z. L. Brumme, and P. R. Harrigan. 2001. Human immunodeficiency virus type 1 protease cleavage site mutations associated with protease inhibitor cross-resistance selected by indinavir, ritonavir, and/or saquinavir. J. Virol. 75:589-594. [DOI] [PMC free article] [PubMed] [Google Scholar]
- 7.Dauber, D. S., R. Ziermann, N. Parkin, D. J. Maly, S. Mahrus, J. L. Harris, J. A. Ellman, C. Petropoulos, and C. S. Craik. 2002. Altered substrate specificity of drug-resistant human immunodeficiency virus type 1 protease. J. Virol. 76:1359-1368. [DOI] [PMC free article] [PubMed] [Google Scholar]
- 8.Debouck, C. 1992. The HIV-1 protease as a therapeutic target for AIDS. AIDS Res. Hum. Retrovir. 8:153-164. [DOI] [PubMed] [Google Scholar]
- 9.Deeks, S. G., R. M. Grant, G. W. Beatty, C. Horton, J. Detmer, and S. Eastman. 1998. Activity of a ritonavir plus saquinavir-containing regimen in patients with virologic evidence of indinavir or ritonavir failure. AIDS Res. Hum. Retrovir. 12:F97-F102. [DOI] [PubMed] [Google Scholar]
- 10.Doyon, L., G. Croteau, D. Thibeault, F. Poulin, L. Pilote, and D. Lamarre. 1996. Second locus involved in human immunodeficiency virus type 1 resistance to protease inhibitors. J. Virol. 70:3763-3769. [DOI] [PMC free article] [PubMed] [Google Scholar]
- 11.Eastman, P. S., J. Mittler, R. Kelso, C. Gee, E. Boyer, J. Kolberg, M. Urdea, J. M. Leonard, D. W. Norbeck, H. Mo, and M. Markowitz. 1998. Genotypic changes in human immunodeficiency virus type 1 associated with loss of suppression of plasma viral RNA levels in subjects treated with ritonavir (Norvir) monotherapy. J. Virol. 72:5154-5164. [DOI] [PMC free article] [PubMed] [Google Scholar]
- 12.Feher, A., I. T. Weber, P. Bagossi, P. Baross, B. Mahalingam, J. M. Louis, T. D. Copeland, I. Y. Yorshin, R. W. Harrison, and J. Tozser. 2002. Effect of sequence polymorphism and drug resistance on two HIV-1 Gag processing sites. J. Biochem. 269:4114-4120. [DOI] [PubMed] [Google Scholar]
- 13.Forstenlehner, M. 2000. AIDS: new FDA-approved agents. Pharm. Unserer Zeit. 29:58. [PubMed] [Google Scholar]
- 14.Griffiths, J. T., L. H. Phylip, J. Konvalinka, P. Strop, A. Gustchina, A. Wlodawer, R. J. Davenport, R. Briggs, B. M. Dunn, and J. Kay. 1992. Different requirements for productive interaction between the active site of HIV-1 proteinase and substrates containing -hydrophobic*hydrophobic- or -aromatic*pro- cleavage sites. Biochemistry 31:5193-5200. [DOI] [PubMed] [Google Scholar]
- 15.Henderson, L. E., T. D. Copeland, R. C. Sowder, A. M. Schultz, and S. Oraszlan. 1988. Human retroviruses, cancer and AIDS: approaches to prevention and therapy. Alan R. Liss, New York, N.Y.
- 16.Ji, J. P., and L. A. Loeb. 1992. Fidelity of HIV-1 reverse transcriptase copying RNA in vitro. Biochemistry 31:954-958. [DOI] [PubMed] [Google Scholar]
- 17.King, N. M., L. Melnick, M. Prabu-Jeyabalan, E. A. Nalivaika, S.-S. Yang, Y. Gao, X. Nie, C. Zepp, D. L. Heefner, and C. A. Schiffer. 2002. Lack of synergy for inhibitors targeting a multi-drug-resistant HIV-1 protease. Protein Sci. 11:418-429. [DOI] [PMC free article] [PubMed] [Google Scholar]
- 18.Kohl, N. E., E. A. Emini, W. A. Schleif, L. J. Davis, J. C. Heimbach, R. A. Dixon, E. M. Scolnick, and I. S. Sigal. 1988. Active human immunodeficiency virus protease is required for viral infectivity. Proc. Natl. Acad. Sci. USA 85:4686-4690. [DOI] [PMC free article] [PubMed] [Google Scholar]
- 19.Krausslich, J.-G., M. Facke, A.-M. Heuser, J. Konvalinka, and H. Zentgraf. 1995. The spacer peptide between human immunodeficiency virus type 1 capsid and nucleocapsid proteins is essential for ordered assembly and viral infectivity. J. Virol. 69:3407-3419. [DOI] [PMC free article] [PubMed] [Google Scholar]
- 20.La Seta Catamancio, S., M. P. De Pasquale, P. Citterio, S. Kurtagic, M. Galli, and S. Rusconi. 2001. In vitro evolution of the human immunodeficiency virus type 1 Gag-protease region and maintenance of reverse transcriptase resistance following prolonged drug exposure. J. Clin. Microbiol. 39:1124-1129. [DOI] [PMC free article] [PubMed] [Google Scholar]
- 21.Lawrence, M. G., and P. M. Colman. 1993. Shape complementarity at protein/protein interfaces. J. Mol. Biol. 234:946-950. [DOI] [PubMed] [Google Scholar]
- 22.Li, Z., and T. Lazaridis. 2003. Thermodynamic contributions of the ordered water molecule in HIV-1 protease. J. Am. Chem. Soc. 125:6636-6637. [DOI] [PubMed] [Google Scholar]
- 23.Madhusudhan, M. S., and S. Vishveshwara. 2001. Deducing hydration sites of a protein from molecular dynamics simulations. J. Biomol. Struct. Dyn. 19:105-114. [DOI] [PubMed] [Google Scholar]
- 24.Maguire, M. F., S. MacManus, P. Griffin, C. Guinea, W. Harris, N. Richards, J. Wolfram, M. Tisdale, W. Snowden, and J. P. Kleim. 2001. Interaction of HIV-1 protease and gag gene mutations in response to amprenavir-selective pressure exerted in amprenavir-treated subjects: contribution of Gag p6 changes L449F and P453L. Antivir. Ther. 6(Suppl. 1):48. [Google Scholar]
- 25.Mahalingam, B., J. M. Louis, J. Hung, R. W. Harrision, and I. T. Weber. 2001. Structural implications of drug-resistant mutants of HIV-1 protease: high-resolution crystal structures of the mutant protease/substrate analogue complexes. Proteins 43:455-464. [DOI] [PubMed] [Google Scholar]
- 26.Mammano, F., C. Petit, and F. Clavel. 1998. Resistance-associated loss of viral fitness in human immunodeficiency virus type 1: phenotypic analysis of protease and Gag coevolution in protease inhibitor-treated patients. J. Virol. 72:7632-7637. [DOI] [PMC free article] [PubMed] [Google Scholar]
- 27.Martin, J. L., J. Begun, A. Schindeler, W. A. Wickramasinghe, D. Alewood, P. F. Alewood, D. A. Bergman, R. I. Brinkworth, G. Abbenante, D. R. March, R. C. Reid, and D. P. Fairlie. 1999. Molecular recognition of macrocyclic peptidomimetic inhibitors by HIV-1 protease. Biochemistry 38:7978-7988. [DOI] [PubMed] [Google Scholar]
- 28.McDonald, C. K., and D. R. Kuritzkes. 1997. Human immunodeficiency virus type 1 protease inhibitors. Arch. Intern. Med. 157:951-959. [PubMed] [Google Scholar]
- 29.Minor, W. 1993. XDISPLAYF program. Purdue University, West Lafayette, Ind.
- 30.Molla, A., M. Korneyeva, Q. Gao, S. Vasavanonda, P. Schipper, H. Mo, M. Markowitz, T. Chernyavskiy, P. Niu, N. Lyons, A. Hsu, G. Granneman, D. Ho, C. Boucher, J. Leonard, D. Norbeck, and D. Kempf. 1996. Ordered accumulation of mutations in HIV protease confers resistance to ritonavir. Nat. Med. 2:760-766. [DOI] [PubMed] [Google Scholar]
- 31.Morris, R. J., A. Perrakis, and V. S. Lamzin. 2002. ARP/wARP's model-building algorithms. I. The main chain. Acta Crystallogr. Sect. D 58:968-975. [DOI] [PubMed] [Google Scholar]
- 32.Murshudov, G. N., A. A. Vagin, and E. J. Dodson. 1997. Refinement of macromolecular structures by the maximum-likelihood method. Acta Crystallogr. Sect. D 53:240-255. [DOI] [PubMed] [Google Scholar]
- 33.Navaza, J. 1994. AMoRe: an automated package for molecular replacement. Acta Crystallogr. Sect. D 50:157-163. [Google Scholar]
- 34.Otwinowski, Z., and W. Minor. 1997. Processing of X-ray diffraction data collected in oscillation mode. Methods Enzymol. 276:307-326. [DOI] [PubMed] [Google Scholar]
- 35.Peng, C., B. K. Ho, T. W. Chang, and N. T. Chang. 1989. Role of human immunodeficiency virus type 1-specific protease in core protein maturation and viral infectivity. J. Virol. 63:2550-2556. [DOI] [PMC free article] [PubMed] [Google Scholar]
- 36.Pettit, S. C., G. J. Henderson, C. A. Schiffer, and R. Swanstrom. 2002. Replacement of the P1 amino acid of human immunodeficiency virus type 1 Gag processing sites can inhibit or enhance the rate of cleavage by the viral protease. J. Virol. 76:10226-10233. [DOI] [PMC free article] [PubMed] [Google Scholar]
- 37.Pettit, S. C., N. Sheng, R. Tritch, S. Erickson-Vitanen, and R. Swanstrom. 1998. The regulation of sequential processing of HIV-1 Gag by the viral protease. Adv. Exp. Med. Biol. 436:15-25. [DOI] [PubMed] [Google Scholar]
- 38.Prabu-Jeyabalan, M., E. Nalivaika, and C. A. Schiffer. 2000. How does a symmetric dimer recognize an asymmetric substrate? A substrate complex of HIV-1 protease. J. Mol. Biol. 301:1207-1220. [DOI] [PubMed] [Google Scholar]
- 39.Prabu-Jeyabalan, M., E. A. Nalivaika, N. M. King, and C. A. Schiffer. 2003. Viability of a drug-resistant human immunodeficiency virus type 1 protease variant: structural insights for better antiviral therapy. J. Virol. 77:1306-1315. [DOI] [PMC free article] [PubMed] [Google Scholar]
- 40.Prabu-Jeyabalan, M., E. A. Nalivaika, and C. A. Schiffer. 2002. Substrate shape determines specificity of recognition for HIV-1 protease: analysis of crystal structures of six substrate complexes. Structure 10:369-381. [DOI] [PubMed] [Google Scholar]
- 41.Ramachandran, G. N., and V. Sasisekharan. 1968. Conformation of polypeptides and proteins. Adv. Protein Chem. 23:283-438. [DOI] [PubMed] [Google Scholar]
- 42.Roberts, J. D., K. Bebenek, and T. A. Kunkel. 1988. The accuracy of reverse transcriptase from HIV-1. Science 242:1171-1173. [DOI] [PubMed] [Google Scholar]
- 43.Roberts, J. D., B. D. Preston, L. A. Johnston, A. Soni, L. A. Loeb, and T. A. Kunkel. 1989. Fidelity of two retroviral reverse transcriptases during DNA-dependent DNA synthesis in vitro. Mol. Cell. Biol. 9:469-476. [DOI] [PMC free article] [PubMed] [Google Scholar]
- 44.Robinson, L. H., R. E. Myers, B. W. Snowden, M. Tisdale, and E. D. Blair. 2000. HIV type 1 protease cleavage site mutations and viral fitness: implications for drug susceptibility phenotyping assays. AIDS Res. Hum. Retrovir. 16:1149-1156. [DOI] [PubMed] [Google Scholar]
- 45.Rose, J. R., R. Salto, and C. S. Craik. 1993. Regulation of autoproteolysis of the HIV-1 and HIV-2 proteases with engineered amino acid substitutions. J. Biol. Chem. 268:11939-11945. [PubMed] [Google Scholar]
- 46.Sack, J. S. 1988. CHAIN: a crystallographic modeling program. J. Mol. Graph. 6:224-225. [DOI] [PubMed] [Google Scholar]
- 47.Shafer, R. W., D. Stevenson, and B. Chan. 1999. Human immunodeficiency virus reverse transcriptase and protease sequence database. Nucleic Acids Res. 27:348-352. [DOI] [PMC free article] [PubMed] [Google Scholar]
- 48.Temesgen, Z. 2001. Current status of antiretroviral therapies. Expert Opin. Pharmacother. 2:1239-1246. [DOI] [PubMed] [Google Scholar]
- 49.Thanki, N., J. K. Rao, S. I. Foundling, W. J. Howe, J. B. Moon, J. O. Hui, A. G. Tomasselli, R. L. Heinrikson, S. Thaisrivongs, and A. Wlodawer. 1992. Crystal structure of a complex of HIV-1 protease with a dihydroxyethylene-containing inhibitor: comparisons with molecular modeling. Protein Sci. 1:1061-1072. [DOI] [PMC free article] [PubMed] [Google Scholar]
- 50.Tözsér, J., I. Blaha, T. D. Copeland, E. M. Wondrak, and S. Oroszlan. 1991. Comparison of the HIV- and HIV-2 proteinases using oligopeptide substrate representing cleavage sites in Gag and Gag-Pol polyproteins. FEBS Lett. 281:77-80. [DOI] [PubMed] [Google Scholar]
- 51.Weber, I. T., J. Wu, J. Adomat, R. W. Harrison, A. R. Kimmel, E. M. Wondrak, and J. M. Louis. 1997. Crystallographic analysis of human immunodeficiency virus 1 protease with an analog of the conserved CA-p2 substrate—interactions with frequently occurring glutamic acid residue at P2′ position of substrates. Eur. J. Biochem. 249:523-530. [DOI] [PubMed] [Google Scholar]
- 52.Wlodawer, A., and J. W. Erickson. 1993. Structure-based inhibitors of HIV-1 protease. Annu. Rev. Biochem. 62:543-585. [DOI] [PubMed] [Google Scholar]
- 53.Wlodawer, A., and A. Gustchina. 2000. Structural and biochemical studies of retroviral proteases. Biochim. Biophys. Acta 1477:16-34. [DOI] [PubMed] [Google Scholar]
- 54.Zhang, Y., H. Qian, Z. Love, and E. Barklis. 1998. Analysis of the assembly function of the human immunodeficiency virus type 1 Gag protein nucleocapsid domain. J. Virol. 72:1782-1789. [DOI] [PMC free article] [PubMed] [Google Scholar]
- 55.Zhang, Y. M., H. Imamichi, T. Imamichi, H. C. Lane, J. Falloon, M. B. Vasudevachari, and N. P. Salzman. 1997. Drug resistance during indinavir therapy is caused by mutations in the protease gene and in its Gag substrate cleavage sites. J. Virol. 71:6662-6670. [DOI] [PMC free article] [PubMed] [Google Scholar]