

Abstract
During herpes simplex virus type 1 (HSV-1) latency, only one region of the viral genome is actively transcribed: the region encoding the latency-associated transcript (LAT). A previous study demonstrated that during latency the LAT promoter is hyperacetylated at histone H3 (K9, K14) relative to lytic genes examined. In the present study, we examine the acetylation profile of regions downstream of the LAT promoter during a latent infection of murine dorsal root ganglia. These analyses revealed the following: (i) the region of the genome containing the 5′ exon of the LAT primary transcript was at least as enriched in acetylated H3 as the LAT promoter, and (ii) the region of hyperacetylation does not extend to the ICP0 promoter. In order to assess the contribution of LAT transcription to the acetylation of the 5′ exon region, the acetylation profile of KOS/29, a recombinant with a deletion of the LAT promoter, was examined. The region containing the 5′ exon of KOS/29 was hyperacetylated relative to lytic gene regions in the absence of detectable LAT transcription. These results indicate that the region containing the 5′ exon of LAT, known to contain enhancer activities and to be critical for induced reactivation (rcr), exists in a chromatin structure during latency that is distinct from other lytic gene regions. This result suggests a role for the 5′ exon LAT enhancer region as a cis-acting regulator of transcription that maintains a transcriptionally permissive chromatin domain in the HSV-1 latent episome.
Herpes simplex virus type 1 (HSV-1) establishes latent infections in sensory neurons as a circular episome associated with histones (8, 28, 37). Active transcription occurs from only one region of this episome: the region encoding the latency-associated transcript (LAT) (40, 42). The LAT region carries an 8.3-kb polyadenylated RNA that is spliced to yield a 2.0-kb stable intron that accumulates abundantly in a subset of the sensory neurons (10, 27, 41). This 2.0-kb intron can be alternatively spliced in some neurons to yield a 1.5-kb intron (38, 48). While the LAT region has not been shown to encode any proteins, this region has been implicated in a number of pathogenic functions, including neuronal survival and antiapoptosis (32, 45), virulence (34, 45), suppression of latent transcription (5), establishment of latency (35, 46), and reactivation from latency (14, 22). Whether this region mediates these different functions through one or more distinct genetic elements remains to be determined, but evidence for the existence of multiple promoters attests to the transcriptional complexity of this region (9, 13, 31, 33). A striking feature of HSV-1 latency is the general suppression of lytic transcription, and this suppression seems to correlate with the association of certain histones with specific tail modifications (20).
Cellular chromatin is known to be separated into regions that range from permissive to nonpermissive for polymerase II-mediated transcription, with pericentric heterochromatin being the most nonpermissive and actively transcribed euchromatin being the most transcriptionally permissive. The histone compositions of these two types of chromatin tend to vary greatly with respect to the posttranslational modifications present (for a review, see reference 17). Acetylation is one type of posttranslational modification that can be present at specific histone amino acid residues, and acetylation of lysines 9 and 14 of histone H3 is typically enriched in transcriptionally permissive chromatin, whereas nonpermissive chromatin tends to be underenriched in this modification. During latency, transcriptionally silent regions of the HSV-1 genome are associated with relatively little of the histone H3 acetylated at lysines 9 and 14 (K9, K14) compared with the LAT promoter, which is significantly enriched in this specifically modified histone (20). This observation suggested an organization of the latent HSV-1 genome into distinct transcriptional domains that are organized at the chromatin level, analogous to the organization of euchromatic and heterochromatic domains in cellular chromosomes. In this model, the LAT region would encompass a transcriptionally permissive domain associated with modified histones typical of euchromatin, while the lytic gene regions would be contained within transcriptionally nonpermissive domains, similar to cellular heterochromatin. In order to begin dissecting the regulatory apparatus responsible for the existence of these domains, it was first necessary to determine their extents. It was previously shown that the LAT promoter was enriched in acetyl-histone H3 (K9, K14) and that UL54 (ICP27) was underenriched in this modification. While UL54 provided an upstream boundary, it was not clear how far downstream of the LAT promoter the transcriptionally permissive domain extended. Since several models of the LAT's involvement in facilitating establishment of latency and reactivation suggest that transcription of LAT maintains ICP0 in a transcriptionally “open” or accessible state, we wished to determine whether the region of histone H3 hyperacetylation that encompasses the LAT promoter region extends to the ICP0 promoter. Using chromatin immunoprecipitation (ChIP) assays, we demonstrate that the region of hyperacetylation extends from the LAT promoter through the region containing the LAT 5′ exon but that the ICP0 promoter is underenriched in acetyl-histone H3 (K9, K14). This result indicates that the transcriptionally permissive chromatin domain terminates 3′ to the region containing the 5′ exon and does not include the ICP0 promoter.
Since the region downstream of the LAT promoter (5′ exon) has been proposed to be a regulator and/or enhancer of latent transcription (2, 24) and has been shown to be critical for induced reactivation (reactivation critical region, or rcr) (3, 16), we sought to determine whether its enrichment in acetyl-histone H3 (K9, K14) was simply a consequence of abundant LAT transcription in this region during latency. The acetylation profile of KOS/29, a recombinant containing a 202-bp deletion of the core LAT promoter, revealed that the region containing the 5′ exon remained highly enriched in acetyl-histone H3 (K9, K14) even in the absence of detectable LAT transcription during a latent infection of murine dorsal root ganglia (DRG). This finding suggests that the localization of acetyl-histone H3 (K9, K14) to the LAT 5′ exon region is independent of active transcription and suggests that other factors are responsible for maintaining this transcriptionally permissive chromatin domain. The fact that the 5′ exon was previously shown to have enhancer activity suggests that this element may be a key cis-acting regulator of chromatin structure that maintains a transcriptionally permissive domain.
MATERIALS AND METHODS
Viruses and cells.
A low-passage stock of HSV-1 strain KOS/M was prepared from a master stock obtained from Jack Stevens. A low-passage stock of HSV-1 recombinant strain KOS/29, which contains a 202-bp PstI-PstI deletion of the core LAT promoter previously described, was prepared from a master stock obtained from Lawrence Feldman (9). The virus was amplified and titrated on rabbit skin cells by using Eagle's minimal essential medium (Invitrogen-Life Technologies, Carlsbad, Calif.) supplemented with 5% calf serum (Life Technologies), 292 μg of l-glutamine/ml, and antibiotics (250 U of penicillin/ml and 250 μg of streptomycin/ml).
Mouse infections.
Four- to 6-week-old female Swiss Webster mice were anesthetized by halothane inhalation and pretreated with 0.05 ml of a 10% (wt/vol in water) sterile saline solution injected under each rear footpad. At 4 to 5 h after pretreatment, the mice were anesthetized by intramuscular injection of 0.010 to 0.020 ml of a cocktail of acepromazine (2.5 to 3.75 mg/kg of body weight), xylazine (7.5 to 11.5 mg/kg), and ketamine (30 to 45 mg/kg) and infected bilaterally on the rear footpads with 1 × 10⁵ PFU/mouse. The keratinized epithelium was lightly abraded with an emery board, and the inoculum was applied to the feet in a volume of 50 μl/mouse. The inoculum was spread over the surface of the footpad with the side of the pipette tip, and the virus was allowed to adsorb for 30 to 45 min while the mice remained under anesthesia on their backs. Mice were sacrificed at >28 days postinfection for latent studies. Care was taken to ensure that the ganglia were removed and processed as quickly as possible postmortem (between 3 and 5 min per mouse).
ChIP.
ChIP assays were performed as previously described (20) with minor modification. Briefly, steps were as follows. All solutions used prior to the collection of chromatin-antibody complexes contained protease inhibitors at the following concentrations: for aprotinin (U.S. Biochemicals), 15 μg/ml; for leupeptin (U.S. Biochemicals), 1 μg/ml; and for phenylmethylsulfonyl fluoride (Sigma), 10 μg/ml. All steps were performed at 4°C unless noted otherwise. DRG were removed from mice at a minimum of 28 days postinfection and homogenized in ice-cold phosphate-buffered saline. Formaldehyde (final concentration, 1% [vol/vol]) was added to the homogenate to cross-link chromatin, and samples were incubated at room temperature for 10 min with shaking. Cross-linking was arrested by adding glycine (final concentration, 0.125 M), and the homogenate was incubated for an additional 5 min at room temperature with shaking. The homogenate was then pelleted, washed three times with phosphate-buffered saline, resuspended in sodium dodecyl sulfate lysis buffer (Upstate Biotechnology), and incubated for a minimum of 10 min on ice.
The cell lysate was sonicated to shear the chromatin into a population of fragments with a median size range of 500 to 1,000 bp as determined by agarose gel electrophoresis. The sheared chromatin was diluted by the addition of 10 volumes of ice-cold ChIP dilution buffer (Upstate Biotechnology) and incubated with salmon sperm DNA-protein A-agarose (50%) slurry (Upstate Biotechnology) for 2 h to reduce nonspecific binding. Beads were pelleted by centrifugation, and the supernatant was incubated with anti-acetyl-histone H3 (K9, K14) (Upstate Biotechnology) at a concentration of 5 μl/ml overnight with shaking.
Chromatin-antibody complexes were collected by incubation with salmon sperm DNA-protein A-agarose (50%) slurry and subsequent collection of beads by centrifugation. Bead pellets were washed one time each in low-salt, high-salt, and LiCl immune complex wash buffers, followed by two washes with Tris-EDTA buffer (all from Upstate Biotechnology). Antibody-chromatin complexes were eluted from beads by incubation with freshly made, preheated (65°C) elution buffer (0.1% sodium dodecyl sulfate, 0.1 M NaHCO3). NaCl was added to eluates (final concentration, 0.2 M), and they were incubated at 65°C for 4 h. The eluates were then treated with RNase A and proteinase K, and the DNA was purified by using a Qiaquick PCR purification kit (QIAGEN).
Real-time PCR analysis.
Real-time PCR was performed using TaqMan universal PCR master mix, No AmpErase uracil N-glycolase (Applied Biosystems), and target-specific primers and TaqMan dye-labeled probe designed and generated by Applied Biosystems (Assays by Design part no. 4331348) in concentrations recommended by the supplier. Primer and probe sequences are listed in Table 1. All real-time PCRs were performed and analyzed using ABI Prism 7000 or 7700 sequence detection systems (Applied Biosystems) (ICBR Protein Chemistry Core Facility, University of Florida). Cycle conditions used were as follows: 50°C for 2 min (1 cycle); 95°C for 10 min (1 cycle); and then 95°C for 15 s followed by 60°C for 1 min (45 cycles). Threshold values used for PCR analysis were set within the linear range of PCR target amplification.
TABLE 1.
Real-time PCR primers and probes
| DNA target | Sequence | Accession no. (nucleotide no.) |
|---|---|---|
| UL54 (ICP27) | 5′ GCC CGT CTC GTC CAG AAG 3′ (forward) | X14112.1 (113945-114034) |
| 5′ GCG CTG GTT GAG GAT CGT T 3′ (reverse) | ||
| 5′ CAG CAC CCA GAC GCC 3′ (probe) | ||
| LAT promoter (LAP1) | 5′ CAA TAA CAA CCC CAA CGG AAA GC 3′ (forward) | X14112.1 (118263-118350) |
| 5′ TCC ACT TCC CGT CCT TCC AT 3′ (reverse) | ||
| 5′ TCC CCT CGG TTG TTC C 3′ (probe) | ||
| 5′ LAT exon | 5′ GGC TCC ATC GCC TTT CCT 3′ (forward) | X14112.1 (119326-119397) |
| 5′ AAG GGA GGG AGG AGG GTA CTG 3′ (reverse) | ||
| 5′ TCT CGC TTC TCC CC 3′ (probe) | ||
| ICP0 promoter | 5′ CCG CCG ACG CAA CAG 3′ (forward) | X14112.1 (124494-124578) |
| 5′ GTT CCG GGT ATG GTA ATG AGT TTC T 3′ (reverse) | ||
| 5′ CTT CCC GCC TTC CC 3′ (probe) | ||
| HSV DNA Pol | 5′ AGA GGG ACA TCC AGG ACT TTG T 3′ (forward) | X14112.1 (65880-65953) |
| 5′ CAG GCG CTT GTT GGT GTA C 3′ (reverse) | ||
| 5′ ACC GCC GAA CTG AGC A 3′ (probe) | ||
| Mouse Xist | 5′ GCT CTT AAA CTG AGT GGG TGT TCA 3′ (forward) | M97167.1 (862-930) |
| 5′ GTA TCA CGC AGA AGC CAT AAT GG 3′ (reverse) | ||
| 5′ ACG CGG GCT CTC CA 3′ (probe) | ||
| Mouse centromere | 5′ TGG CGA GGA AAA CTG AAA AAG GT 3′ (forward) | X06899.1 (66-136) |
| 5′ TTT TCT TGC CAT ATT CCA CGT CCT A 3′ (reverse) | ||
| 5′ CAG TGG ACA TTT CTA AAT TT 3′ (probe) |
Determination of ChIP bound/input ratio.
Prior to the addition of antibody, an aliquot of sheared chromatin, which represents the preimmunoprecipitation (pre-IP) fraction, was removed and purified in a manner similar to that described above. Relative enrichment of a given DNA region was determined by comparing the amount of the DNA region present in the post-IP (bound) fraction to that present in the pre-IP (input) fraction and expressed as a bound/input ratio. All amounts are relative to a standard curve specific for the real-time primer and probe set used. Standard curves were generated by using serial dilutions of purified viral DNA, DNA purified from mouse DRG, or target-specific plasmid (Xist plasmid, a generous gift of Jeannie T. Lee). Each individual ChIP was analyzed as follows. First, duplicate or triplicate PCRs were performed using DNA purified from either the bound or the input ChIP fraction as target. Cycle thresholds (Ct) were then established within the linear range for each PCR and averaged. The average Ct for the bound fraction and the average Ct for the input fraction were then used to determine the relative quantity of target DNA in each fraction by using the equation for the standard curve specific to the primer and probe set used, and the quantity was expressed as a ratio of the relative bound quantity to the relative input quantity (bound/input ratio). Since three to four separate repetitions were performed for each ChIP experiment, the bound/input ratios of repeated experiments were averaged, and the standard deviation (SD) was determined. One-way analysis of variance (ANOVA) of the bound and input quantities was determined using by InStat version 3.0a for Macintosh computers (GraphPad Software, Inc.).
Analysis of latent DRG for LAT RNA by reverse transcription (RT)-PCR.
For each virus, eight DRG were isolated from one latently infected mouse and snap frozen in liquid nitrogen. RNA was isolated with TRIzol reagent (Gibco). Briefly, DRG were homogenized in 1.2 ml of TRIzol, and following the addition of 0.2 volume of chloroform, samples were centrifuged for phase separation. RNA was precipitated from the aqueous phase with 0.7 volume of isopropanol, followed by DNase treatment using DNA-free (Ambion) according to the manufacturer's directions. DNA was back extracted from the organic phase of the TRIzol extraction three times by using 150 μl of 0.1 M Tris, pH 8.0, and 0.1% Sarkosyl.
Reverse transcription using random hexamers was performed with Omniscript reverse transcriptase (QIAGEN) according to the manufacturer's instructions. Briefly, 20-μl reactions contained DNase-treated RNA, manufacturer-supplied buffer and deoxynucleoside triphosphate mix, 1 μM random hexamer primer, 1 U of RNase inhibitor (Ambion), and Omniscript reverse transcriptase. Reactions incubated at 37°C for 1 h, followed by 93°C inactivation for 5 min.
PCR analysis of cDNA was performed with HotStarTaq (QIAGEN) according to the manufacturer's instructions. Briefly, 50-μl reactions contained cDNA; 0.5 μM concentrations of each primer specific for either the HSV 5′ LAT exon (sense, 5′-CGG CGA CAT CCT CCC CCT AAG C-3′ [nucleotides {nt } 118888 to 119009]; antisense, 5′-GAC AGA CGA ACG AAA CAT TCC G-3′ [nt 119016 to 119037]) or the HSV LAT intron (sense, 5′-GAC ACG GAT TGG CTG GTG TAG TGG-3′ [nt 120797 to 120820]; antisense, 5′-ACG AGG GAA AAC AAT AAG GGA CGC C-3′ [nt 120877 to 120901]); manufacturer-supplied PCR buffer consisting of Tris-Cl, KCl, (NH4)2SO4, and 15 mM MgCl2; 1.25 mM (each) dGTP, dATP, dTTP, and dCTP; and 2.5 U of HotStarTaq DNA polymerase. Additionally, the following primer pair for adenine phosphoribosyltransferase was used as an internal control: sense, 5′-ACT CCA GGG GCT TCC TGT TTG-3′; and antisense, 5′-ATC CAC AAT GAC CAC TCT CTG-3′. PCRs were performed in an Ericomp Thermalcycler (San Diego, Calif.) as follows: initiation at 95°C for 15 min; 3 min each of 94, 55, and 72°C (1 cycle); and 1 min each of 94, 55, and 72°C (30 cycles). PCR products were resolved on a 7.5% acrylamide gel, stained with SYBR green, and visualized with a STORM phosphorimager (Molecular Dynamics, Sunnyvale, Calif.).
Determination of relative amounts of viral DNA in latently infected ganglia.
Real-time primer and probe sets specific to HSV-1 DNA polymerase (Pol), mouse Xist, or mouse centromere were used to perform real-time PCRs on input fractions of KOS and KOS/29 ChIPs in order to determine the relative concentrations of viral and cellular DNA in each sample. Real-time PCRs were performed in triplicate for each sample. Ct were established within the linear range for each PCR, and Ct values for triplicate reactions were averaged. Average Ct values were used to determine the relative quantities of Pol, Xist, and centromere in each input fraction by using Pol, Xist, or centromere standard curves, respectively. Relative quantities were used to generate Pol/Xist and Pol/centromere ratios for both KOS and KOS/29 pre-IP (input) fractions.
RESULTS
Analysis of the HSV-1 LAT region for histone acetylation.
ChIP analysis of the HSV-1 latent genome had indicated that the HSV-1 LAT promoter was significantly enriched in acetyl-histone H3 (K9, K14) relative to several lytic genes examined (DNA polymerase, ICP27, and ICP4), suggesting that at least a portion of the long repeat (RL) regions of the genome was hyperacetylated and in a transcriptionally permissive chromatin state (20). A previous study (20) raised the question of the acetylation status of the ICP0 promoter. The LAT is transcribed antisense to ICP0, and ICP0 has been hypothesized to play a key role during the initial stages of reactivation. One model of the LAT's involvement in reactivation is that its transcription during latency maintains ICP0 in an open structure; therefore, an initial goal of this study was to determine whether this region of hyperacetylation extended to the ICP0 promoter (Fig. 1). DRG from mice latently infected with HSV-1 strain KOS were processed for ChIP by using antisera against acetyl-histone H3 (K9, K14). Three different regions in the RL were analyzed with real-time PCR (Fig. 1B and Table 1). These results indicated that in addition to the LAT promoter, the region containing the 5′ exon is enriched in acetyl-histone H3 (K9, K14), but the ICP0 promoter is significantly (P = 0.018) hypoacetylated relative to these other regions (Fig. 2). The degree of hypoacetylation observed for the ICP0 promoter is similar in magnitude to that of UL54, which had previously been shown to exist in a hypoacetylated state during latency.
FIG. 1.
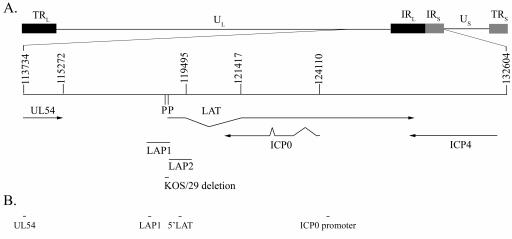
HSV-1 genomic map showing the location of regions analyzed by real-time PCR. (A) Diagram of the HSV-1 genome with an expanded diagram of the long and short internal repeats (IRL and IRS) and a portion of the unique long (UL). Numbers represent nucleotide positions as annotated in accession no. NC_001806 (human herpesvirus 1, complete genome). Also shown are selected transcripts, promoters (LAP1 and LAP2), and the region of the LAP1 promoter that is detected in KOS/29. Specifically, LAP1 (nt 118003 to 118878) (6), LAP2 (nt 118867 to 119499) (10), and the KOS/29 deletion, a 202-bp PstI-PstI (nt 118664 to 118866) (7), are shown. P, PstI restriction site. Additional sequences depicted are as follows: UL54 coding sequence (CDS) (nt 113734 to 115282), LAT intron (nt 119465 to 121417), ICP0 CDS (nt 120882 to 122485, 122622 to 123288, and 124054 to 124110), and ICP4 CDS (nt 127184 to 131128). (B) Locations analyzed by real-time PCR in the ChIP studies. Specific sequences of PCR primers and probes are indicated in Table 1. PCR primer locations are the following: for UL54, nt 113945 to 114034; for LAP1, nt 118263 to 118350; for the 5′ LAT exon, nt 119326 to 119397; and for ICP0 promoter, nt 124494 to 124578.
FIG. 2.
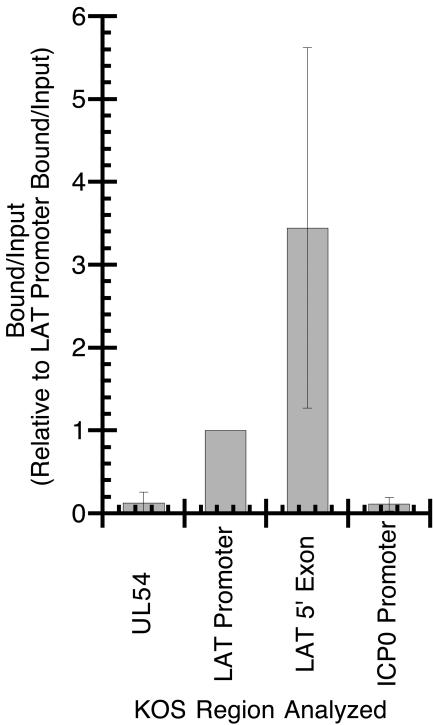
ChIP analysis of latent HSV-1 (strain KOS) DNA using antiserum specific for anti-acetyl-histone H3 (K9, K14). The relative amount of target DNA immunoprecipitated in the ChIP bound fraction was determined by using real-time PCR and expressed as the bound/input ratio as described in Materials and Methods. Bound/input ratios were generated from four separate ChIP experiments (except for UL54, which was analyzed in only three out of four of the ChIP experiments) and the average bound/input ratio for each target relative to the average bound/input ratio for the LAT promoter.
Interestingly, the mean value for the enrichment (n-fold) in acetyl-histone H3 (K9, K14) observed for the LAT 5′ exon region was approximately 3.5 times greater than that of the LAT promoter region and almost 40-fold greater than that of the ICP0 or UL54 promoter regions (Fig. 2). While the error bars clearly indicate the range of values obtained from the four independent ChIP experiments, an examination of the 5′ exon/LAT promoter ratios from the individual ChIPs (Table 2) indicates that in three out of the four experiments, the 5′ exon region was three- to sixfold more enriched than the LAT promoter. While ChIP, like any immunoprecipitation, is not a highly quantitative assay, these results seem to suggest that the 5′ exon is at least as enriched in acetyl-histone H3 (K9, K14) as the LAT promoter, and perhaps significantly more enriched.
TABLE 2.
Real-time PCR data obtained per individual ChIP experiment
| Virus and DNA target | Expt no. | Bound Ctc | Bound quantitya | Input Ct | Input quantitya | Bound/input ratiob | Bound/input ratio relative to LAT promoter bound/input ratio |
|---|---|---|---|---|---|---|---|
| KOS/M | |||||||
| LAT promoter | 36.57 | 1.0E-04 | 34.13 | 5.4E-04 | |||
| 1 | 36.77 | 8.7E-05 | 34.70 | 3.7E-04 | |||
| 36.75 | 8.8E-05 | 34.46 | 4.3E-04 | ||||
| Avg ± SD | 9.2E-05 ± 7.1E-06 | 4.5E-04 ± 8.9E-05 | 0.21 ± 0.04 | 1 ± 0.30 | |||
| 35.33 | 2.4E-04 | 34.13 | 5.4E-04 | ||||
| 2 | 35.40 | 2.3E-04 | 34.70 | 3.7E-04 | |||
| 35.46 | 2.2E-04 | 34.46 | 4.3E-04 | ||||
| Avg ± SD | 2.3E-04 ± 1.0E-05 | 4.5E-04 ± 8.9E-05 | 0.51 ± 0.10 | 1 ± 0.30 | |||
| 34.47 | 4.3E-04 | 32.72 | 1.4E-03 | ||||
| 3 | 34.29 | 4.9E-04 | 32.59 | 1.6E-03 | |||
| 35.05 | 2.9E-04 | 32.35 | 1.9E-03 | ||||
| Avg ± SD | 4.0E-04 ± 1.0E-04 | 1.6E-03 ± 2.2E-04 | 0.25 ± 0.07 | 1 ± 0.41 | |||
| 32.14 | 2.2E-03 | 31.61 | 3.1E-03 | ||||
| 4 | 31.98 | 2.4E-03 | 32.16 | 2.1E-03 | |||
| 31.72 | 2.9E-03 | 31.67 | 3.0E-03 | ||||
| Avg ± SD | 2.5E-03 ± 3.7E-04 | 2.7E-03 ± 5.4E-04 | 0.91 ± 0.22 | 1 ± 0.35 | |||
| LAT 5′ exon | 35.42 | 6.2E-04 | 34.86 | 9.1E-04 | |||
| 1 | 36.18 | 3.7E-04 | 35.00 | 8.3E-04 | |||
| ND | ND | 35.22 | 7.1E-04 | ||||
| Avg ± SD | 5.0E-04 ± 1.8E-04 | 8.2E-04 ± 9.9E-05 | 0.61 ± 0.23 | 2.96 ± 1.29 | |||
| 34.39 | 1.3E-03 | 34.86 | 9.1E-04 | ||||
| 2 | 33.51 | 2.3E-03 | 35.00 | 8.3E-04 | |||
| ND | ND | 35.22 | 7.1E-04 | ||||
| Avg ± SD | 1.8E-03 ± 7.3E-04 | 8.2E-04 ± 9.9E-05 | 2.16 ± 0.93 | 4.73 ± 2.03 | |||
| 33.64 | 2.1E-03 | 34.66 | 1.0E-03 | ||||
| 3 | 33.61 | 2.1E-03 | 34.35 | 1.3E-03 | |||
| 34.59 | 1.1E-03 | 34.49 | 1.2E-03 | ||||
| Avg ± SD | 1.8E-03 ± 5.9E-04 | 1.2E-03 ± 1.2E-04 | 1.52 ± 0.53 | 6.17 ± 2.78 | |||
| 32.02 | 6.3E-03 | 31.44 | 9.3E-03 | ||||
| 4 | 32.06 | 6.1E-03 | 31.79 | 7.3E-03 | |||
| 32.26 | 5.3E-03 | 31.83 | 7.1E-03 | ||||
| Avg ± SD | 5.9E-03 ± 5.0E-04 | 7.9E-03 ± 1.2E-03 | 0.74 ± 0.13 | 0.82 ± 0.25 | |||
| ICP0 promoter | 41.69 | 2.4E-06 | 34.38 | 4.6E-04 | |||
| 1 | 41.24 | 3.3E-06 | 34.42 | 4.5E-04 | |||
| 41.12 | 3.6E-06 | 34.44 | 4.4E-04 | ||||
| Avg ± SD | 3.1E-06 ± 6.4E-07 | 4.5E-04 ± 1.0E-05 | 0.01 ± 0.00 | 0.04 ± 0.01 | |||
| 37.19 | 6.1E-05 | 34.38 | 4.6E-04 | ||||
| 2 | 38.02 | 3.4E-05 | 34.42 | 4.5E-04 | |||
| 37.19 | 6.1E-05 | 34.44 | 4.4E-04 | ||||
| Avg ± SD | 5.2E-05 ± 1.6E-05 | 4.5E-04 ± 1.0E-05 | 0.12 ± 0.04 | 0.23 ± 0.08 | |||
| 39.32 | 1.3E-05 | 33.13 | 1.1E-03 | ||||
| 3 | 39.99 | 8.2E-06 | 33.80 | 7.0E-04 | |||
| 38.94 | 1.7E-05 | 34.03 | 6.0E-04 | ||||
| Avg ± SD | 1.3E-05 ± 4.6E-06 | 8.1E-04 ± 2.9E-04 | 0.12 ± 0.01 | 0.07 ± 0.04 | |||
| 4 | 34.62 | 3.9E-04 | 31.92 | 2.7E-03 | |||
| 35.10 | 2.8E-04 | 31.73 | 3.1E-03 | ||||
| 35.16 | 2.6E-04 | 32.25 | 2.1E-03 | ||||
| Avg ± SD | 3.1E-04 ± 6.9E-05 | 2.7E-03 ± 4.9E-04 | 0.12 ± 0.03 | 0.13 ± 0.05 | |||
| KOS/29 | |||||||
| LAT promoter | 34.3 | 4.8E-04 | 28.89 | 2.1E-02 | |||
| 1 | 33.93 | 6.2E-04 | 28.81 | 2.2E-02 | |||
| 34.19 | 5.2E-04 | 28.76 | 2.2E-02 | ||||
| Avg ± SD | 5.4E-04 ± 7.3E-05 | 2.2E-02 ± 9.7E-04 | 0.03 ± 0.00 | 1 ± 0.20 | |||
| 33.6 | 7.8E-04 | 28.89 | 2.1E-02 | ||||
| 2 | 33.47 | 8.6E-04 | 28.81 | 2.2E-02 | |||
| 33.26 | 9.9E-04 | 28.76 | 2.2E-02 | ||||
| Avg ± SD | 8.8E-04 ± 1.0E-04 | 2.2E-02 ± 9.7E-04 | 0.04 ± 0.01 | 1 ± 0.18 | |||
| 32.35 | 1.9E-03 | 28.89 | 2.1E-02 | ||||
| 3 | 33.32 | 9.5E-04 | 28.81 | 2.2E-02 | |||
| 32.31 | 1.9E-03 | 28.76 | 2.2E-02 | ||||
| Avg ± SD | 1.6E-03 ± 5.4E-04 | 2.2E-02 ± 9.7E-04 | 0.07 ± 0.03 | 1 ± 0.49 | |||
| 32.24 | 2.0E-03 | 30.31 | 7.7E-03 | ||||
| 4 | 32.5 | 1.7E-03 | 30.40 | 7.2E-03 | |||
| 31.55 | 3.2E-03 | 30.46 | 6.9E-03 | ||||
| Avg ± SD | 2.3E-03 ± 8.3E-04 | 7.3E-03 ± 3.8E-04 | 0.32 ± 0.11 | 1 ± 0.51 | |||
| LAT 5′ exon | 32.94 | 3.4E-03 | 31.88 | 6.9E-03 | |||
| 1 | 32.65 | 4.1E-03 | 31.76 | 7.5E-03 | |||
| 33.31 | 2.6E-03 | 31.39 | 9.6E-03 | ||||
| Avg ± SD | 3.4E-03 ± 7.4E-04 | 8.0E-03 ± 1.4E-03 | 0.42 ± 0.12 | 16.6 ± 5.29 | |||
| 34.22 | 1.4E-03 | 31.88 | 6.9E-03 | ||||
| 2 | 33.2 | 2.8E-03 | 31.76 | 7.5E-03 | |||
| 33.46 | 2.4E-03 | 31.39 | 9.6E-03 | ||||
| Avg ± SD | 2.2E-03 ± 7.2E-04 | 8.0E-03 ± 1.4E-03 | 0.27 ± 0.10 | 6.72 ± 2.65 | |||
| 31.86 | 7.0E-03 | 31.88 | 6.9E-03 | ||||
| 3 | 33.73 | 2.0E-03 | 31.76 | 7.5E-03 | |||
| 33.48 | 2.3E-03 | 31.39 | 9.6E-03 | ||||
| Avg ± SD | 3.8E-03 ± 2.8E-03 | 8.0E-03 ± 1.4E-03 | 0.47 ± 0.36 | 6.42 ± 5.41 | |||
| 32.32 | 5.1E-03 | 31.02 | 1.2E-02 | ||||
| 4 | 31.96 | 6.5E-03 | 31.37 | 9.8E-03 | |||
| 32.28 | 5.3E-03 | 31.15 | 1.1E-02 | ||||
| Avg ± SD | 5.6E-03 ± 7.8E-04 | 1.1E-02 ± 1.3E-03 | 0.51 ± 0.09 | 1.59 ± 0.64 | |||
| ICP0 promoter | 37.36 | 5.4E-05 | 30.01 | 1.1E-02 | |||
| 1 | 37.47 | 5.0E-05 | 30.08 | 1.0E-02 | |||
| 37.59 | 4.6E-05 | 30.20 | 9.4E-03 | ||||
| Avg ± SD | 5.0E-05 ± 4.1E-06 | 1.0E-02 ± 6.9E-04 | 0.00 ± 0.00 | 0.20 ± 0.04 | |||
| 35.89 | 1.6E-04 | 30.01 | 1.1E-02 | ||||
| 2 | 35.94 | 1.5E-04 | 30.08 | 1.0E-02 | |||
| 35.74 | 1.7E-04 | 30.20 | 9.4E-03 | ||||
| Avg ± SD | 1.6E-04 ± 1.2E-05 | 1.0E-02 ± 6.9E-04 | 0.02 ± 0.00 | 0.39 ± 0.06 | |||
| 37.44 | 5.1E-05 | 30.01 | 1.1E-02 | ||||
| 3 | 38.92 | 1.8E-05 | 30.08 | 1.0E-02 | |||
| 38.82 | 1.9E-05 | 30.20 | 9.4E-03 | ||||
| Avg ± SD | 2.9E-05 ± 1.9E-05 | 1.0E-02 ± 6.9E-04 | 0.00 ± 0.00 | 0.04 ± 0.03 | |||
| 33.67 | 7.7E-04 | 30.44 | 7.9E-03 | ||||
| 4 | 34.41 | 4.5E-04 | 30.80 | 6.1E-03 | |||
| 34.15 | 5.5E-04 | 30.65 | 6.8E-03 | ||||
| Avg ± SD | 5.9E-04 ± 1.6E-04 | 6.9E-03 ± 9.1E-04 | 0.10 ± 0.03 | 0.27 ± 0.13 |
Quantity determined by using the Ct (y) to determine quantity (x) based on a standard curve generated for the primer and probe set used.
Bound/input ratio, average bound quantity/average input quantity.
ND, not determined.
In summary, this analysis suggests that the 5′ end of the LAT region is highly enriched in acetyl-histone H3 (K9, K14) during latency, that this transcriptionally permissive chromatin domain does not extend to the ICP0 promoter, and that the ICP0 promoter region assumes a more heterochromatic chromatin structure, similar to that of other HSV lytic genes.
Investigation of the role of latent transcription on the acetylation status of the HSV-1 LAT 5′ exon region.
While it was not surprising that the LAT promoter was acetylated, it was of interest that the region corresponding to the 5′ exon was so highly enriched in acetyl-histone H3 (K9, K14). One interpretation of these findings is that the act of transcription of the 5′ region of the LAT is responsible for facilitating histone H3 acetylation as a marker of transcriptional activity. In order to investigate this possibility, we examined the acetylation status of the LAT region in KOS/29, an HSV-1 recombinant containing a deletion of the core LAT (LAP1) promoter (Fig. 1). ChIP analysis of the LAT promoter (using PCR primers to a region of the promoter that lies 5′ to the PstI deletion), the 5′ exon, and the ICP0 promoter revealed that, like in wild-type KOS, the LAT promoter and 5′ exon regions of KOS/29 are significantly enriched in acetyl-histone H3 (K9, K14) relative to the ICP0 promoter (Fig. 3), with a P value of 0.0004. This result suggests that transcription of the LAT during latency is not in itself responsible for the hyperacetylated status of this region of the HSV-1 genome during latency.
FIG. 3.
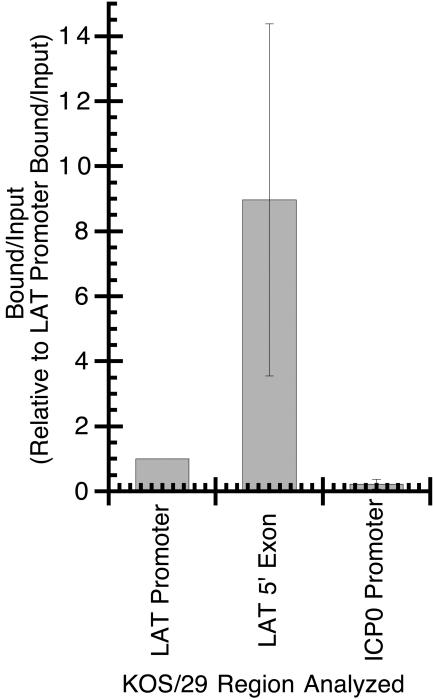
ChIP analysis of latent HSV-1 (strain KOS/29) DNA using antiserum specific for anti-acetyl-histone H3 (K9, K14). The relative amount of target DNA immunoprecipitated in the ChIP bound fraction was determined by using real-time PCR and expressed as the bound/input ratio as described in Materials and Methods. Bound/input ratios were generated from three separate ChIP experiments and the average bound/input ratio for each target relative to the average bound/input ratio for the LAT promoter.
When the 5′ exon/LAT promoter region ratios for individual ChIPs were analyzed, similar to the observation with the KOS ChIP assays, in three out of four experiments the 5′ exon was significantly enriched (6- to 17-fold greater) relative to the LAT promoter (Table 2). This result suggests that in KOS/29, as in KOS, the 5′ exon is at least as enriched in acetyl-histone H3 (K9, K14) as the LAT promoter, and perhaps to a significantly greater extent. A more direct comparison between these two viruses will be addressed below, but these data indicate that dramatically reducing LAT transcription does not reduce the acetylation profile of the LAT 5′ exon region.
While KOS/29 lacks the core LAT promoter, including the TATA box, there have been reports of RNA corresponding to the LAT region being detectable by RT-PCR. Chen et al. (5) demonstrated that while five molecules of the LAT per latent genome could be detected in ganglia infected with a LAT promoter deletion mutant, the amount of LAT was reduced by an order of 105 from that seen in wild-type-infected ganglia (5). There is some debate as to whether this RNA is made in rare reactivating neurons and represents read-through transcription from acute transcripts such as ICP0 (11), whether it represents a very low-level transcription of the LAT from the remaining upstream promoter elements, or whether it might emanate from a different transcription unit (13, 31). For our analyses, it was important to determine the relative amount of any RNA corresponding to the LAT 5′ exon region that could be detected in the latently KOS/29-infected ganglia. Total DRG RNA extracted from the same latently infected ganglia used for the ChIP assays was analyzed by RT-PCR with primers specific for the 5′ LAT exon region. As shown in Fig. 4A, no LAT-specific PCR product was detected in the KOS/29-infected ganglia, whereas abundant 5′ exon was detected in the wild-type KOS-infected ganglia. This finding confirms that active transcription from the LAP1 promoter is not likely to be responsible for the region of hyperacetylation.
FIG. 4.
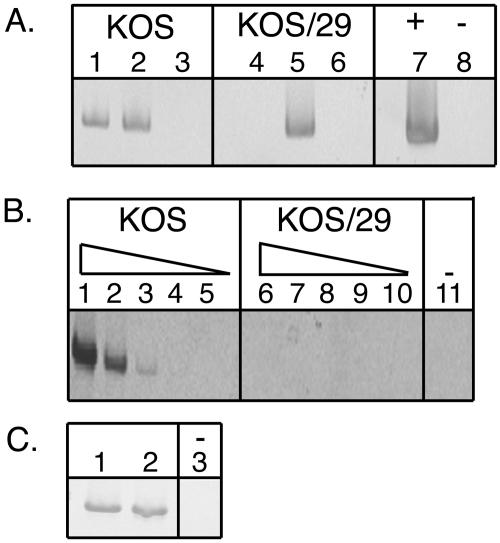
RT-PCR analysis detecting the presence or absence of LAT RNA in DRG latently infected with KOS or KOS/29. (A) LAT 5′ exon-specific PCR. Target samples used for PCRs are as follows: undiluted cDNA (RNA fraction plus RT), lanes 1 and 4; DNA fraction, lanes 2 and 5; RNA fraction without RT, lanes 3 and 6; viral DNA, lane 7; and water, lane 8. (B) LAT intron-specific PCR. Target sample used was the undiluted or serially diluted RNA fraction plus RT used for the analysis shown in panel A. Reactions shown used the following dilutions of target: undiluted, lanes 1 and 6; 1/10 dilution, lanes 2 and 7; 1/100 dilution, lanes 3 and 8; 1/1,000 dilution, lanes 4 and 9; and 1/10,000 dilution, lanes 5 and 10. In lane 11, water was used as the PCR negative control. (C) Cellular adenine phosphoribosyltransferase-specific PCR. Target samples used for PCRs are as follows: KOS RNA fraction with RT, lane 1; KOS/29 RNA fraction with RT, lane 2; and water, lane 3.
Another possible interpretation is that the acetylation of the 5′ exon could reflect the acetylation of the LAP2 promoter that is also located in this region (Fig. 1). While the LAP2 promoter is generally considered to be active primarily during acute infection, we wished to evaluate whether we could detect any transcription downstream of this region. Using primers specific for a region in the 5′ end of the 2.0-kb intron, we analyzed the KOS/29 and wild-type KOS cDNA by PCR. As in the case of the 5′ exon PCR analysis, these analyses failed to detect any cDNA from this region in KOS/29, while abundant cDNA for wild-type KOS was detected (Fig. 4B). In order to get a sense of the degree of sensitivity of our assay, a series of 10-fold dilutions of the cDNA fractions of both KOS and KOS/29 was performed and analyzed with the primers corresponding to the 2.0-kb intron (Fig. 4B). While it is obviously not possible to say that KOS/29 makes absolutely no LAT RNA and it is likely that our RT-PCR analyses described here are not as sensitive as that used by Chen et al. (5), it is clear from this dilution analysis that the amount of detectable LAT RNA in KOS/29-infected ganglia would be at least 1,000-fold less than that in wild-type KOS-infected ganglia. Given this dramatic reduction, the data presented here indicate that the acetylation of the 5′ exon region during HSV-1 latency persists even in the face of at least a drastic reduction in LAT transcription.
Comparison by ChIP of the relative levels of histone acetylation between KOS and KOS/29.
In order to determine whether there was any difference in the relative levels of acetylation of the LAT region between wild-type KOS and KOS/29, an additional ChIP analysis was performed (Table 2, experiment 4). In this ChIP experiment, latent DRG infected with KOS or KOS/29 were simultaneously processed and analyzed with two cellular controls (Xist and centromere) to allow normalization of the KOS and KOS/29 ChIP values for differences in overall chromatin precipitation efficiency. The initial analyses revealed that while the LAT promoter and 5′ exon regions in the KOS/29 latent genomes were acetylated, the relative levels of acetylation of these two sites and that of the ICP0 promoter were apparently reduced by about 0.5- to 3-fold relative to the values observed for KOS (Fig. 5A). The difficulty of this type of comparison, however, is that it requires comparing separate ChIP experiments for DRG from mice infected with two different virus strains. In order to perform this comparison and to consider differences in ChIP efficiencies, we utilized the two independent cellular controls (mouse Xist and mouse centromere) to act as standards for the ChIP efficiencies (Fig. 5B). The values from the ChIPs shown in Fig. 5A were then normalized relative to these cellular controls (Fig. 5C and D). This comparison between the KOS/29 and KOS ChIPs using the cellular controls showed that less total ganglionic chromatin was precipitated in the KOS/29 ChIP assay. This conclusion is supported by the fact that the Xist/centromere ratios are consistent between the two IPs (Fig. 5B). Normalization of the values from ChIPs to take this difference in overall precipitation efficiency into account suggests that while there may be a slight reduction in acetylation of the histones associated with the LAT promoter, the 5′ exon of KOS/29 is at least as acetylated as, if not slightly more acetylated than, that of KOS. This result suggests that transcription of the LAT is not responsible for the acetylation of the LAT promoter and 5′ exon regions during latency.
FIG. 5.
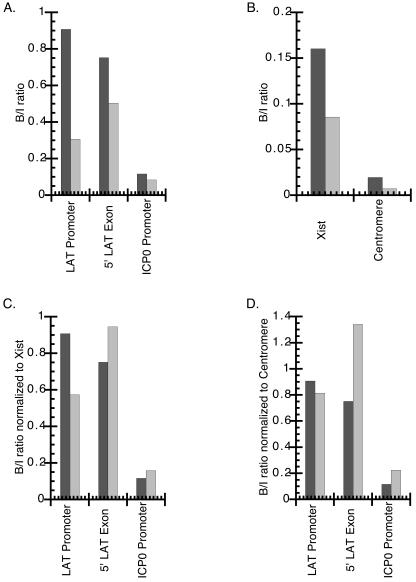
Tandem comparison of ChIPs, relative to cellular controls, from DRG from mice latently infected with either KOS or KOS/29. Relative amounts of target DNA immunoprecipitated with anti-acetyl-histone H3 (K9, K14) in the ChIP bound fraction were determined by using real-time PCR, as described in Materials and Methods. For all panels, dark grey bars represent KOS, and light grey bars represent KOS/29. (A) Bound/input ratios obtained for three regions in the HSV-1 RL. (B) Bound/input ratios obtained for two different cellular controls, Xist and centromere. (C and D) Bound/input ratios for the three HSV-1 regions analyzed in panel A normalized to the cellular bound/input ratios for Xist (panel C) and centromere (panel D).
The cellular controls (Xist and centromere) allowed for normalization of the amount of total DNA recovered from the ganglia and determination of overall ChIP efficiencies. Because ganglia that were infected with two different HSV-1 strains were being compared, it was desirable to determine whether there were any differences in levels of establishment or the relative amount of HSV-1 genomes present in mice infected with KOS and KOS/29. Total HSV DNA present in the ganglia used for the ChIPs was determined by real-time PCR (Table 3). These data suggest that levels of establishment between these two viruses were comparable.
TABLE 3.
Relative amounts of HSV-1 DNA present in ganglia of mice infected with KOS or KOS/29b
| Virus strain | Ratio of HSV-1 polymerase DNA to Xist DNAa | Ratio of HSV-1 polymerase DNA to centromere DNAa |
|---|---|---|
| KOS/M (wild type) | 0.4323 | 0.0228 |
| KOS/29 | 0.4792 | 0.0362 |
| Difference (n-fold)c | 0.9021 | 0.6317 |
Relative levels of latent viral DNA calculated are representative of DRG from four mice (8 DRG/mouse) pooled for each virus-specific ChIP.
Values reflect relative quantities of viral DNA calculated from real-time PCR analysis as described in Materials and Methods. Values are expressed as the ratios of viral DNA to cellular DNA.
The difference was calculated by dividing the ratio for KOS/M by that obtained for KOS/29.
DISCUSSION
This study has demonstrated that the region of the long repeat encoding a portion of the HSV-1 LAT is highly enriched in acetyl-histone H3 (K9, K14) during a latent infection of mouse DRG. This region of hyperacetylation extends from an upstream region of the LAT promoter (LAP1) through the LAT 5′ exon region but does not encompass the ICP0 promoter. Since one marker of transcriptionally permissive regions is enrichment in acetyl-histone H3 (K9, K14), this analysis suggests that this region of the long repeat is maintained in a transcriptionally permissive chromatin structure during latency. This analysis also revealed that active transcription from the LAT promoter is not directly responsible for maintaining this chromatin environment, since a LAT promoter deletion maintains hyperacetylation in the 5′ exon region. The implications of these findings are discussed below.
Acetylation of the LAT region is independent of active latent transcription.
Since transcriptionally active regions of chromosomes are generally rich in acetyl-histone H3 (K9, K14) modifications, initially our finding that the region containing the LAT 5′ exon was enriched in this modified histone was not so surprising. The fact that LAT accumulates so abundantly during latency suggested that the process of active transcription itself, and the recruitment of histone acetyltransferases by the RNA Pol II complex, was responsible for this acetylation profile. Interestingly, ChIP analysis of this region in KOS/29, a recombinant with a deletion of the core LAT promoter, indicated that reducing LAT transcription below our level of detection (at least a 1,000-fold reduction from that in the wild type) did not significantly alter the acetylation of the region containing the 5′ LAT exon. This result suggests the likelihood that a process other than the active transcription of the LAT is responsible for maintenance of this region's acetylated histone composition during latency. It may be that cis-acting DNA elements located in the 5′ exon region are responsible for recruiting histone-modifying enzymes that in turn help establish a transcriptionally permissive environment in this region.
When the acetylation status of the LAT locus is compared to that of acute-phase genes, the data suggest that the LAT locus is maintained in a more transcriptionally permissive state than the acute genes examined within the overall population of latent HSV genomes as a whole. This finding does not rule out the possibility that a small number of viral genomes within the population have a different distribution of acetylated histones associated with their chromatin. This possibility is supported by the fact that previous studies have detected low levels of acute-phase transcripts within latently infected ganglia (6, 19, 44). In situ hybridization analyses have demonstrated that acute transcripts can be detected in a rare subset of the total number of latently infected neurons (11), suggesting that the acute transcripts detected in whole ganglia by RT-PCR arose from a rare reactivating (or at least transcriptionally active) neuron. If this interpretation is true, then the subset of genomes producing lytic transcripts would likely be associated with histones containing modifications different from those in the overall latent population.
The region of hyperacetylation does not extend to the ICP0 promoter.
The analyses presented here indicate that the ICP0 promoter is hypoacetylated in acetyl-histone H3 (K9, K14) relative to the LAT promoter and the 5′ exon region and that, in fact, the relative level of hypoacetylation of the ICP0 promoter is comparable to that of ICP27 (UL54). This finding suggests that ICP0 is maintained in a transcriptionally nonpermissive state during latency, like all of the lytic genes that we have examined to date (both in the unique long [UL] and short repeat [RS] regions, and now in the ICP0 region of the RL), implying that previous models whereby LAT transcription maintains the ICP0 promoter in a transcriptionally poised state (and accessible to potential mediators of reactivation) are not correct. Instead, it suggests that the chromatin structure of the ICP0 promoter must be remodeled and made more transcriptionally permissive prior to transcriptional activation.
The LAT enhancer may play a role in maintaining a transcriptionally permissive chromatin structure of this region.
In addition to the observation that the acetylation status of the region containing the 5′ exon of LAT seems to be independent of detectable LAT transcription, the majority of the experimental data from both latent KOS and KOS/29 suggests that this region may be more enriched in acetyl-histone H3 (K9, K14) than even the LAT promoter. Hyperacetylation is a property associated with a number of cellular transcriptional enhancers (18), and it is important to note that enhancer activities have previously been associated with the region of LAT containing the 5′ exon (2, 24), as well as with a region located just after the LAP1 TATA box and possibly extending into the core promoter (13, 31). In addition to acting as an enhancer in transient assays, the enhancer in the 5′ exon region (termed the LTE, for long-term expression element) has been shown to be required for facilitating long-term LAT promoter activity in vivo (4, 25). It is therefore tempting to speculate that a key functional property of this enhancer region may be as a cis-acting DNA element to recruit proteins that mediate transcriptional permissiveness, such as histone acetyltransferases and chromatin-modeling activities. Work aimed at identifying these factors is currently under way.
A model of the HSV-1 latent episome partitioned into transcriptional domains that are organized at the level of chromatin.
ChIP analysis of the latent HSV-1 genome in mouse DRG suggests that a portion of the LAT region is enriched in acetyl-histone H3 (K9, K14), whereas histones associated with lytic gene regions are underenriched in this specific modification. This finding suggests a model whereby the HSV-1 latent episome is partitioned into separate transcriptional domains. Since these regions of the HSV-1 genome are contiguous during latency, inherent in this model is the requirement for boundary or insulator elements that would segregate the transcriptionally active regions of the genome (in the two long repeats) from the rest of the transcriptionally silent regions. On cellular chromosomes, specific classes of chromatin boundaries act to separate heterochromatic domains from euchromatic domains, and some types of boundaries have enhancer-blocking (insulator) activities (23, 47). Such insulators or boundaries would be required to block the influence of the LAT enhancer region from enhancing expression of adjacent genes, such as ICP0, at inappropriate times. Our study suggests that if such boundaries exist in the HSV-1 genome, they are likely to be located near the junction of the UL and RL segments and between the splice-donor of the LAT intron and the ICP0 promoter. It is tempting to speculate that if these boundaries exist, their regulation may play a central role in the regulation of HSV-1 latent gene expression and perhaps the regulation of latency itself.
Potential implication of the hyperacetylated LAT enhancer on reactivation.
In addition to its enhancer properties, the region containing the 5′ LAT exon has also been shown to facilitate induced reactivation in the rabbit eye model. Deletions of >300 bp in this region greatly impair reactivation (3, 16, 26). This finding suggests that the enhancer function, and perhaps its ability to confer a transcriptionally permissive chromatin structure, is a key feature that is required for efficient reactivation. Determining whether the LAT 5′ exon's enhancer function plays a direct role in promoting reactivation will be the focus of future studies.
Finally, it has been recognized for some time that bulk acetylation is most often associated with transcriptionally permissive loci, and mapping the enrichment of acetyl-histone H3 has proved useful for mapping chromatin domains (7, 12, 23). More recently, insight has been gained regarding the role other posttranslational modifications may play in regulating gene expression. For example, evidence suggests that in yeast, trimethylation of histone H3 at lysine 4 may function as a marker of recently transcribed sequences (30, 39). Conversely, methyl-histone H3 (lysine 9), a modification associated with heterochromatic silencing (29, 36), can serve as a binding site for heterochromatin protein 1 (HP1) (1, 15, 21, 29). In 2000, Strahl and Allis proposed the hypothesis of the histone code, in which they theorize that the specific pattern of posttranslational marks found within histones of chromatin serves as a regulatory code not unlike that of the genetic code (43). It could be hypothesized that specific combinations of histone modifications serve as critical markers that dictate transcriptional accessibility of key regulatory regions of the HSV-1 genome during latency. Determining the enrichment profiles of other posttranslational modifications within latent HSV-1 chromatin will likely provide additional insight into mechanisms involved in regulating latent HSV-1 gene expression.
Acknowledgments
This work was supported by grant AI48633 from the National Institutes of Health and in part by the Investigators in Pathogenesis Award from the Burroughs Wellcome Fund to D.C.B. N.J.K. received support from NIH training grant AI07110.
REFERENCES
- 1.Bannister, A. J., P. Zegerman, J. F. Partridge, E. A. Miska, J. O. Thomas, R. C. Allshire, and T. Kouzarides. 2001. Selective recognition of methylated lysine 9 on histone H3 by the HP1 chromo domain. Nature 410:120-124. [DOI] [PubMed] [Google Scholar]
- 2.Berthomme, H., J. Lokensgard, L. Yang, T. Margolis, and L. T. Feldman. 2000. Evidence for a bidirectional element located downstream from the herpes simplex virus type 1 latency-associated promoter that increases its activity during latency. J. Virol. 74:3613-3622. [DOI] [PMC free article] [PubMed] [Google Scholar]
- 3.Bloom, D. C., J. T. Hill, E. K. Wagner, L. F. Feldman, and J. G. Stevens. 1996. A 348-bp region in the latency-associated transcript facilitates herpes simplex virus type 1 reactivation. J. Virol. 70:2449-2459. [DOI] [PMC free article] [PubMed] [Google Scholar]
- 4.Bloom, D. C., N. T. Maidment, A. Tan, V. B. Dissette, L. T. Feldman, and J. G. Stevens. 1995. Long-term expression of a reporter gene from latent herpes simplex virus in the rat hippocampus. Mol. Brain Res. 31:48-60. [DOI] [PubMed] [Google Scholar]
- 5.Chen, S. H., M. F. Kramer, P. A. Schaffer, and D. M. Coen. 1997. A viral function represses accumulation of transcripts from productive-cycle genes in mouse ganglia latently infected with herpes simplex virus. J. Virol. 71:5878-5884. [DOI] [PMC free article] [PubMed] [Google Scholar]
- 6.Chen, X. P., M. Mata, M. Kelley, J. C. Glorioso, and D. J. Fink. 2002. The relationship of herpes simplex virus latency associated transcript expression to genome copy number: a quantitative study using laser capture microdissection. J. Neurovirol. 8:204-210. [DOI] [PubMed] [Google Scholar]
- 7.Crane-Robinson, C., T. R. Hebbes, A. L. Clayton, and A. W. Thorne. 1997. Chromosomal mapping of core histone acetylation by immunoselection. Methods 12:48-56. [DOI] [PubMed] [Google Scholar]
- 8.Deshmane, S. L., and N. W. Fraser. 1989. During latency, herpes simplex virus type 1 DNA is associated with nucleosomes in a chromatin structure. J. Virol. 63:943-947. [DOI] [PMC free article] [PubMed] [Google Scholar]
- 9.Dobson, A. T., F. Sederati, G. Devi-Rao, W. M. Flanagan, M. J. Farrell, J. G. Stevens, E. K. Wagner, and L. T. Feldman. 1989. Identification of the latency-associated transcript promoter by expression of rabbit beta-globin mRNA in mouse sensory nerve ganglia latently infected with a recombinant herpes simplex virus. J. Virol. 63:3844-3851. [DOI] [PMC free article] [PubMed] [Google Scholar]
- 10.Farrell, M. J., A. T. Dobson, and L. T. Feldman. 1991. Herpes simplex virus latency-associated transcript is a stable intron. Proc. Natl. Acad. Sci. USA 88:790-794. [DOI] [PMC free article] [PubMed] [Google Scholar]
- 11.Feldman, L., A. R. Ellison, C. C. Voytek, L. Yang, P. Krause, and T. P. Margolis. 2002. Spontaneous molecular reactivation of herpes simplex virus type 1 latency in mice. Proc. Natl. Acad. Sci. USA 99:978-983. [DOI] [PMC free article] [PubMed] [Google Scholar]
- 12.Forsberg, E. C., K. M. Downs, H. M. Christensen, H. Im, P. A. Nuzzi, and E. H. Bresnick. 2000. Developmentally dynamic histone acetylation pattern of a tissue-specific chromatin domain. Proc. Natl. Acad. Sci. USA 97:14494-14499. [DOI] [PMC free article] [PubMed] [Google Scholar]
- 13.Goins, W. F., L. R. Sternberg, K. D. Croen, P. R. Krause, R. L. Hendricks, D. J. Fink, S. E. Straus, M. Levine, and J. C. Glorioso. 1994. A novel latency-active promoter is contained within the herpes simplex virus type 1 UL flanking repeats. J. Virol. 68:2239-2252. [DOI] [PMC free article] [PubMed] [Google Scholar]
- 14.Hill, J. M., F. Sedarati, R. T. Javier, E. K. Wagner, and J. G. Stevens. 1990. Herpes simplex virus latent phase transcription facilitates in vivo reactivation. Virology 174:117-125. [DOI] [PubMed] [Google Scholar]
- 15.Jacobs, S. A., S. D. Taverna, Y. Zhang, S. D. Briggs, J. Li, J. C. Eissenberg, C. D. Allis, and S. Khorasanizadeh. 2001. Specificity of the HP1 chromo domain for the methylated N-terminus of histone H3. EMBO J. 20:5232-5241. [DOI] [PMC free article] [PubMed] [Google Scholar]
- 16.Jarman, R. G., J. M. Loutsch, G. B. Devi-Rao, M. E. Marquart, M. P. Banaszak, X. Zheng, J. M. Hill, E. K. Wagner, and D. C. Bloom. 2002. The region of the HSV-1 latency-associated transcript required for epinephrine-induced reactivation in the rabbit does not include the 2.0 kb intron. Virology 292:59-69. [DOI] [PubMed] [Google Scholar]
- 17.Jenuwein, T., and C. D. Allis. 2001. Translating the histone code. Science 293:1074-1080. [DOI] [PubMed] [Google Scholar]
- 18.Johnson, K. D., J. A. Grass, C. Park, H. Im, K. Choi, and E. H. Bresnick. 2003. Highly restricted localization of RNA polymerase II within a locus control region of a tissue-specific chromatin domain. Mol. Cell. Biol. 23:6484-6493. [DOI] [PMC free article] [PubMed] [Google Scholar]
- 19.Kramer, M. F., and D. M. Coen. 1995. Quantification of transcripts from the ICP4 and thymidine kinase genes in mouse ganglia latently infected with herpes simplex virus. J. Virol. 69:1389-1399. [DOI] [PMC free article] [PubMed] [Google Scholar]
- 20.Kubat, N. J., R. K. Tran, P. McAnany, and D. C. Bloom. 2004. Specific histone tail modification and not DNA methylation is a determinant of herpes simplex virus type 1 latent gene expression. J. Virol. 78:1139-1149. [DOI] [PMC free article] [PubMed] [Google Scholar]
- 21.Lachner, M., D. O'Carroll, S. Rea, K. Mechtler, and T. Jenuwein. 2001. Methylation of histone H3 lysine 9 creates a binding site for HP1 proteins. Nature 410:116-120. [DOI] [PubMed] [Google Scholar]
- 22.Leib, D. A., C. L. Bogard, V. M. Kosz, K. A. Hicks, D. M. Coen, D. M. Knipe, and P. A. Schaffer. 1989. A deletion mutant of the latency-associated transcript of herpes simplex virus type 1 reactivates from the latent state with reduced frequency. J. Virol. 63:2893-2900. [DOI] [PMC free article] [PubMed] [Google Scholar]
- 23.Litt, M. D., M. Simpson, F. Recillas-Targa, M. N. Prioleau, and G. Felsenfeld. 2001. Transitions in histone acetylation reveal boundaries of three separately regulated neighboring loci. EMBO J. 20:2224-2235. [DOI] [PMC free article] [PubMed] [Google Scholar]
- 24.Lokensgard, J. R., H. Berthomme, and L. T. Feldman. 1997. The latency-associated promoter of herpes simplex virus type 1 requires a region downstream of the transcription start site for long-term expression during latency. J. Virol. 71:6714-6719. [DOI] [PMC free article] [PubMed] [Google Scholar]
- 25.Lokensgard, J. R., D. C. Bloom, A. T. Dobson, and L. T. Feldman. 1994. Long-term promoter activity during herpes simplex virus latency. J. Virol. 68:7148-7158. [DOI] [PMC free article] [PubMed] [Google Scholar]
- 26.Loutsch, J. M., G.-C. Perng, J. M. Hill, X. Zheng, M. E. Marquart, T. M. Block, H. Ghiasi, A. B. Nesburn, and S. L. Wechsler. 1999. Identical 371-base-pair deletion mutations in the LAT genes of herpes simplex virus type 1 McKrae and 17syn+ result in different in vivo reactivation phenotypes. J. Virol. 73:767-771. [DOI] [PMC free article] [PubMed] [Google Scholar]
- 27.Margolis, T. P., C. R. Dawson, and J. H. LaVail. 1992. Herpes simplex viral infection of the mouse trigeminal ganglion. Immunohistochemical analysis of cell populations. Investig. Ophthalmol. Vis. Sci. 33:259-267. [PubMed] [Google Scholar]
- 28.Mellerick, D. M., and N. W. Fraser. 1987. Physical state of the latent herpes simplex virus genome in a mouse model system: evidence suggesting an episomal state. Virology 158:265-275. [DOI] [PubMed] [Google Scholar]
- 29.Nakayama, J., J. C. Rice, B. D. Strahl, C. D. Allis, and S. I. Grewal. 2001. Role of histone H3 lysine 9 methylation in epigenetic control of heterochromatin assembly. Science 292:110-113. [DOI] [PubMed] [Google Scholar]
- 30.Ng, H. H., F. Robert, R. A. Young, and K. Struhl. 2003. Targeted recruitment of Set1 histone methylase by elongating Pol II provides a localized mark and memory of recent transcriptional activity. Mol. Cell 11:709-719. [DOI] [PubMed] [Google Scholar]
- 31.Nicosia, M., S. L. Deshmane, J. M. Zabolotny, T. Valyi-Nagy, and N. W. Fraser. 1993. Herpes simplex virus type 1 latency-associated transcript (LAT) promoter deletion mutants can express a 2-kilobase transcript mapping to the LAT region. J. Virol. 67:7276-7283. [DOI] [PMC free article] [PubMed] [Google Scholar]
- 32.Perng, G. C., C. Jones, J. Ciacci-Zanella, M. Stone, G. Henderson, A. Yukht, S. M. Slanina, F. M. Hofman, H. Ghiasi, A. B. Nesburn, and S. L. Wechsler. 2000. Virus-induced neuronal apoptosis blocked by the herpes simplex virus latency-associated transcript. Science 287:1500-1503. [DOI] [PubMed] [Google Scholar]
- 33.Perng, G. C., B. Maguen, L. Jin, K. R. Mott, J. Kurylo, L. BenMohamed, A. Yukht, N. Osorio, A. B. Nesburn, G. Henderson, M. Inman, C. Jones, and S. L. Wechsler. 2002. A novel herpes simplex virus type 1 transcript (AL-RNA) antisense to the 5′ end of the latency-associated transcript produces a protein in infected rabbits. J. Virol. 76:8003-8010. [DOI] [PMC free article] [PubMed] [Google Scholar]
- 34.Perng, G. C., S. M. Slanina, A. Yukht, B. S. Drolet, W. Keleher, Jr., H. Ghiasi, A. B. Nesburn, and S. L. Wechsler. 1999. A herpes simplex virus type 1 latency-associated transcript mutant with increased virulence and reduced spontaneous reactivation. J. Virol. 73:920-929. [DOI] [PMC free article] [PubMed] [Google Scholar]
- 35.Perng, G. C., S. M. Slanina, A. Yukht, H. Ghiasi, A. B. Nesburn, and S. L. Wechsler. 2000. The latency-associated transcript gene enhances establishment of herpes simplex virus type 1 latency in rabbits. J. Virol. 74:1885-1891. [DOI] [PMC free article] [PubMed] [Google Scholar]
- 36.Rea, S., F. Eisenhaber, D. O'Carroll, B. D. Strahl, Z. W. Sun, M. Schmid, S. Opravil, K. Mechtler, C. P. Ponting, C. D. Allis, and T. Jenuwein. 2000. Regulation of chromatin structure by site-specific histone H3 methyltransferases. Nature 406:593-599. [DOI] [PubMed] [Google Scholar]
- 37.Rock, D. L., and N. W. Fraser. 1985. Latent herpes simplex virus type 1 DNA contains two copies of the virion DNA joint region. J. Virol. 55:849-852. [DOI] [PMC free article] [PubMed] [Google Scholar]
- 38.Rodahl, E., and L. Haarr. 1997. Analysis of the 2-kilobase latency-associated transcript expressed in PC12 cells productively infected with herpes simplex virus type 1: evidence for a stable, nonlinear structure. J. Virol. 71:1703-1707. [DOI] [PMC free article] [PubMed] [Google Scholar]
- 39.Santos-Rosa, H., R. Schneider, A. J. Bannister, J. Sherriff, B. E. Bernstein, N. C. Emre, S. L. Schreiber, J. Mellor, and T. Kouzarides. 2002. Active genes are tri-methylated at K4 of histone H3. Nature 419:407-411. [DOI] [PubMed] [Google Scholar]
- 40.Spivack, J. G., and N. W. Fraser. 1987. Detection of herpes simplex virus type 1 transcripts during latent infection in mice. J. Virol. 61:3841-3847. [DOI] [PMC free article] [PubMed] [Google Scholar]
- 41.Spivack, J. G., G. M. Woods, and N. W. Fraser. 1991. Identification of a novel latency-specific splice donor signal within the herpes simplex virus type 1 2.0-kilobase latency-associated transcript (LAT): translation inhibition of LAT open reading frames by the intron within the 2.0-kilobase LAT. J. Virol. 65:6800-6810. [DOI] [PMC free article] [PubMed] [Google Scholar]
- 42.Stevens, J. G., E. K. Wagner, G. B. Devi-Rao, M. L. Cook, and L. T. Feldman. 1987. RNA complementary to a herpesvirus alpha gene mRNA is prominent in latently infected neurons. Science 235:1056-1059. [DOI] [PubMed] [Google Scholar]
- 43.Strahl, B. D., and C. D. Allis. 2000. The language of covalent histone modifications. Nature 403:41-45. [DOI] [PubMed] [Google Scholar]
- 44.Tal-Singer, R., T. M. Lasner, W. Podrzucki, A. Skokotas, J. J. Leary, S. L. Berger, and N. W. Fraser. 1997. Gene expression during reactivation of herpes simplex virus type 1 from latency in the peripheral nervous system is different from that during lytic infection of tissue cultures. J. Virol. 71:5268-5276. [DOI] [PMC free article] [PubMed] [Google Scholar]
- 45.Thompson, R. L., and N. M. Sawtell. 2001. Herpes simplex virus type 1 latency-associated transcript gene promotes neuronal survival. J. Virol. 75:6660-6675. [DOI] [PMC free article] [PubMed] [Google Scholar]
- 46.Thompson, R. L., and N. M. Sawtell. 1997. The herpes simplex virus type 1 latency-associated transcript gene regulates the establishment of latency. J. Virol. 71:5432-5440. [DOI] [PMC free article] [PubMed] [Google Scholar]
- 47.West, A. G., M. Gaszner, and G. Felsenfeld. 2002. Insulators: many functions, many mechanisms. Genes Dev. 16:271-288. [DOI] [PubMed] [Google Scholar]
- 48.Wu, T.-T., Y.-H. Su, T. M. Block, and J. M. Taylor. 1996. Evidence that two latency-associated transcripts of herpes simplex virus type 1 are nonlinear. J. Virol. 70:5962-5967. [DOI] [PMC free article] [PubMed] [Google Scholar]