Abstract
In vivo measurement of blood velocity fields and flow descriptors remains challenging due to image artifacts and limited resolution of current imaging methods; however, in vivo imaging data can be used to inform and validate patient-specific computational fluid dynamics (CFD) models. Image-based CFD can be particularly useful for planning surgical interventions in complicated cases such as fusiform aneurysms of the basilar artery, where it is crucial to alter pathological hemodynamics while preserving flow to the distal vasculature. In this study, patient-specific CFD modeling was conducted for two basilar aneurysm patients considered for surgical treatment. In addition to velocity fields, transport of contrast agent was simulated for the preoperative and postoperative conditions using two approaches. The transport of a virtual contrast passively following the flow streamlines was simulated to predict post-surgical flow regions prone to thrombus deposition. In addition, the transport of a mixture of blood with an iodine-based contrast agent was modeled to compare and verify the CFD results with X-ray angiograms. The CFD-predicted patterns of contrast flow were qualitatively compared to in vivo X-ray angiograms acquired before and after the intervention. The results suggest that the mixture modeling approach, accounting for the flow rates and properties of the contrast injection, is in better agreement with the X-ray angiography data. The virtual contrast modeling assessed the residence time based on flow patterns unaffected by the injection procedure, which makes the virtual contrast modeling approach better suited for prediction of thrombus deposition, which is not limited to the peri-procedural state.
Keywords: Image-based computational modeling, Patient-specific CFD, Cerebral aneurysm, X-ray angiography, Surgical planning
1. Introduction
Hemodynamic factors play an important role in progression of cerebral aneurysms (Boussel et al., 2008; Burleson and Turitto, 1996; Cebral et al., 2005; Jeong and Rhee, 2012; Penn et al., 2011; Steinman et al., 2003). Thus, for complex cerebral aneurysm, not suitable for a direct clipping or coiling, neurosurgeons may consider flow-altering procedures in order to change the pathological hemodynamics and inhibit the aneurysm progression (Lawton and Spetzler, 1999; Sughrue et al., 2011). The outcomes of the flow-altering surgeries may be improved by a thorough understanding of patient-specific flow fields.
Currently diagnostics and treatment of cerebral aneurysms rely on angiographic and functional imaging of the diseased vasculature to assess the flow through these lesions (Hacein-Bey and Provenzale, 2011; White et al., 2000). Phase-contrast MRI is capable of measuring blood flow in vivo, providing time-resolved, three-dimensional velocity fields (Boussel et al., 2009; Markl et al., 2003; Markl et al., 2012, 2014; Nayak et al., 2015). Unfortunately, in the current clinical practice, it is often impossible to conduct detailed PC-MRI studies before and after a surgery. Another method routinely used in clinical practice is X-ray angiography, where an iodine-based contrast agent is injected from a catheter into the vessel of interest and X-ray images are taken while the contrast is flowing through the vasculature. This method can provide useful information on flow and residence time (Prevrhal et al., 2011; Shpilfoygel et al., 2000), and it is used to plan surgical or endovascular treatments as well as to evaluate the progress and success of the flow-altering procedures (Urbach et al., 2008; Wallace et al., 2007). However, the images are typically two-dimensional, showing a projection of the inherently 3D flow fields. In addition, the injection of a contrast agent may substantially change the flow field and result in an inaccurate assessment of the flow dynamics.
An alternative approach is to use CFD to simulate the flow through patient-specific geometries. Image-based CFD can provide detailed information on the flow fields and hemodynamic factors affecting blood vessels with temporal and spatial resolutions exceeding those of the in vivo methods (Cebral et al., 2011; Jeong and Rhee, 2012; Rinkel et al., 1998; Sughrue et al., 2011; Taylor and Steinman, 2010). The modeling approach can also predict alternative flow scenarios resulting from different surgical options prior to the actual interventions (Chung and Cebral, 2015; Rayz et al., 2015; Rayz et al., 2008a, 2008c; Rispoli et al., 2015; Steinman et al., 2003; Taylor et al., 1999). In order to ensure that CFD models adequately represent patient-specific flow, it is necessary to use all relevant clinical data such as X-ray angiography and PC-MRI.
In this paper, patient-specific CFD modeling was used to simulate the preoperative and postoperative flows in two basilar aneurysms considered for surgical treatment. Numerical simulations of a contrast agent transport were carried out using two approaches to predict postoperative regions with increased potential for thrombus deposition and to compare numerical results with available X-ray angiography images.
2. Methods
2.1. Patients
Two patients with fusiform basilar artery aneurysms were recruited using institutionally approved IRB consent. The first patient presented with a fusiform aneurysm of the vertebrobasilar junction and was treated at the University of Arkansas for Medical Sciences. Two surgical options were considered (Fig. 1a); the first alternative was to clip the dominant vertebral artery (VA) proximal to the posterior inferior cerebellar artery (PICA) and rely on the flow from the contralateral VA to supply the PICA. The second option was to clip the dominant VA above the PICA thus isolating the PICA from the vertebrobasilar junction. The latter option was implemented and the patient remained at neurologic baseline following surgery without complaints. In addition to obtaining an X-ray angiogram for the preoperative flow, a temporary balloon occlusion of the left VA was performed in order to assess the flow resulting from the option 1 prior to the actual surgery. A catheter-based balloon was temporarily inflated in the left VA just proximal to the PICA and the contrast agent was injected to determine the filling and washout patterns in the verterbrobasilar system. The angiograms were obtained at 6 fps, with 3 ml of contrast agent injected for 1 s.
Fig. 1.
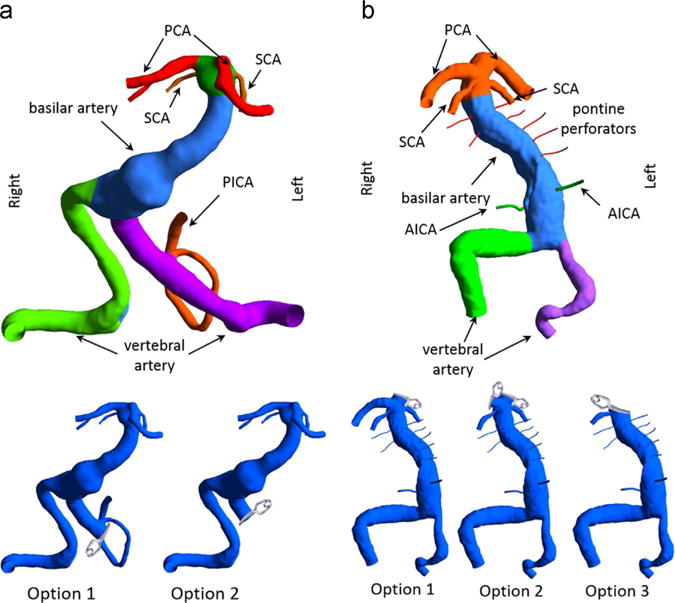
Three-dimensional models of the vascular geometries: (a) Left panel: for patient 1 the left VA was occluded proximal or distal to the left PICA in surgical options 1 and 2, respectively. (b) Right panel: for patient 2, the left PCA was clipped in option 1, both PCAs were clipped in option 2, and for option 3 the basilar apex was clipped such that only the right SCA was remained attached to the basilar trunk.
The second patient presented with a partially thrombosed fusiform basilar artery aneurysm and was treated at the University of California, San Francisco. To reduce the total flow through the basilar trunk three options are presented here and shown in Fig. 1b. In the first option, one of the posterior cerebral arteries (PCAs) would be isolated from the basilar apex and supplied from a bypass from the middle cerebral artery (MCA). The second option involved clipping both PCAs and creating two MCA-to-PCA bypasses. The third option was to place a clip across the basilar apex such that only one superior cerebellar artery (SCA) remained attached to the basilar trunk. The other three branch vessels of the basilar terminus in this option are supplied from the anterior circulation through an MCA-to-PCA bypass. This last option was implemented surgically; however, the patency of the SCA below the clip could not be maintained, thus resulting in a stroke. The angiograms for this patient were obtained at 4 fps by injecting 2 ml of contrast agent over 1 s.
2.2. Model construction and mesh generation
Preoperative patient-specific geometries were generated from time-of-flight and contrast-enhanced MR angiography for patient 1 and 2, respectively. The MR images were segmented using MIMICS™ (Materialise Inc., Leuven, Belgium) to create a three-dimensional iso-surface of the luminal boundaries. The surface was transferred into 3D modeling software, Geomagic Design × (3D Systems, Rock Hill, SC), where the volume of interest was selected and defects caused by image artifacts were eliminated. For patient 2 it was crucial to assess the effect of the interventions on the patency of the anterior inferior cerebellar arteries (AICAs) and brainstem perforators. Since the size of these vessels is below the MR resolution, idealized geometries were added to the model by creating a circular opening in the basilar wall, generating a 3D spline for the vessel path and sweeping the circle along the spline to create the vessel wall surface (Rayz et al., 2015).
The 3D model was then imported into ICEM CFD (ANSYS Inc., Canonsburg, PA) where the computational domain was divided into several components, each representing a specific vessel or vessel segment. The modular structure of the mesh enabled regional analysis as described in Section 2.4 and was particularly useful in modeling surgical options, as the preoperative geometries were modified by removing segments that would be surgically clipped. The computational mesh contained more than 1.5 million tetrahedral elements with an element size of 0.25 mm in larger vessels (e.g., basilar artery) and much smaller element size of 0.05 mm for perforators and small branches. Our previous studies conducted for a number of similar aneurysms determined that this mesh density provides an adequate resolution.
2.3. CFD modeling of blood flow
To obtain the velocity fields, the transient Navier-Stokes equations were solved using a finite-volume solver, Fluent (ANSYS Inc., Canonsburg, PA). The flow was modeled as incompressible and Newtonian with a density of 1060 kg/m3 and a dynamic viscosity of 0.0035 Pa s. Vessel walls were modeled as rigid with no-slip boundary condition. The pressure was set to a constant at all outlets. For the preoperative flow simulations, patient-specific flow waveforms obtained from the through-plane PC-MRI measurements were prescribed at the model inlets. Due to the low temporal resolution of the PC-MRI, continuous inlet flow waveforms were computed from the Fourier analysis of the discrete flow measurements. For postoperative simulations, the inlet flow rates were adjusted assuming that the same amount of flow was required by the distal vessels before and after the interventions (Rayz et al., 2015).
2.4. Virtual contrast transport simulations
The flow was visualized by using a “virtual contrast” (VC) technique (Rayz et al., 2010). A passive scalar representing a virtual contrast agent was numerically injected at the inlets and the transport of the VC through the flow domain was modeled by solving the advection-diffusion equation after computing the velocities at each time step. To simulate the filling patterns, the entire domain was initialized with a zero VC concentration. The interface of the contrast-laden and contrast-free flow was defined using a threshold of 0.5 (Rayz et al., 2010). A new method was used for quantitative comparisons of the filling patterns under different flow conditions. For each computational subdomain described in Section 2.2, the volume of a vessel segment filled with the VC was calculated and normalized by the total volume of that specific subdomain.
2.5. Modeling iodine-based contrast agent injection
The injection and transport of the contrast agent during the X-ray angiography was simulated as the transport of a fluid mixture. The unsteady Navier-Stokes equations were solved simultaneously with the transport of two liquid species: the contrast agent and blood. The fluid properties were calculated as (Gambill, 1959
| (1) |
| (2) |
where yB, yCA and ρB, ρCA and μB, μCA are the mass fraction, density and viscosity of blood and the contrast, respectively. The contrast used for X-ray angiography was Omnipaque 300 with the density of 1349 kg/m3 and viscosity of 0.0063 Pa s (GE, 2007). It is reasonable to assume that the transport of species is “advection-dominated” (Ford et al., 2005), so the diffusion term in the transport equations was neglected.
The CFD modeling of the blood/contrast mixture was performed for ten cardiac cycles with a temporal resolution of 0.01 s. The contrast injection was modeled at the injected vessel’s inlet by using a rectangle inflow function with the amplitude equal to the total contrast volume divided by the injection time for the duration of the actual bolus injection. The total mixture inflow was calculated by adding the blood flow from the PC-MRI measurements and the contrast injection profile. The contrast concentration at the inlet was determined from the ratio of the contrast to the mixture flow rates.
3. Results
3.1. Postoperative flow simulation
3.1.1. Patient 1
The preoperative and postoperative flow fields are shown in Fig. 2, where the streamlines are colored according to the originating vertebral artery (AV). Furthermore, numerical results of the VC transport are presented in Fig. 3 that shows the regions filled with the VC one second after the injection start. The preoperative flow from the left VA created a jet impinging on the opposite wall (Figs. 2a and 3a). The jet then turned and mixed with the flow from the right VA resulting in a strong swirling flow in the aneurysm. The presence of the strong jet and recirculating flow may negatively affect the aneurysm’s stability. According to CFD predictions (Fig. 2b and c), both options resulted in elimination of the impinging jet and weakening of the swirling flow in the aneurysmal trunk, with the flow mostly following the centerline of the basilar artery.
Fig. 2.
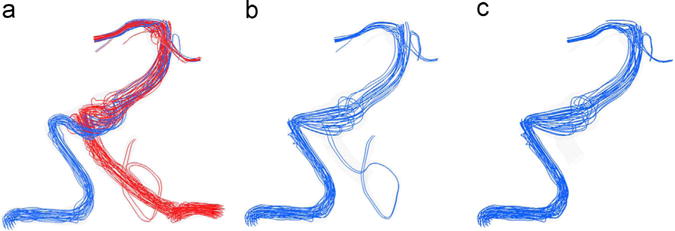
Streamlines at peak systole showing the flow fields of patient 1 under (a) preoperative, (b) option 1 and (c) option 2 flow scenarios; the streamline color indicates its vessel of origin: red is the flow from the left VA and blue is that from the right VA.(For interpretation of the references to color in this figure legend, the reader is referred to the web version of this article).
Fig. 3.
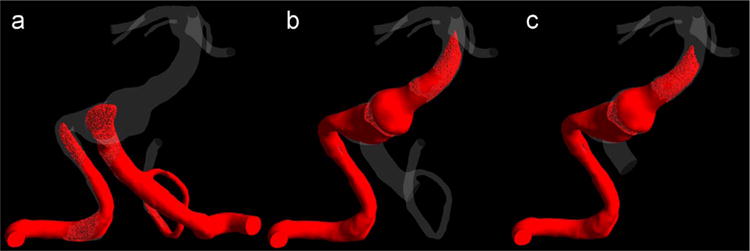
The virtual contrast simulations showing the filling of the aneurysm with the VC for the (a) preoperative case, (b) option 1, and (c) option 2, one second after the injection of the VC.
It is important to consider the effects of both treatment options on the flow through the numerous brainstem perforators arising from the basilar trunk, as their occlusion may lead to stroke. In option 1, the clipping was proximal to the PICA so that the blood could flow retrograde through the vertebrobasilar junction thus maintaining the flow to the perforators in that region. A set of images is shown in Fig. 4 corresponding to the same time step, when the preoperative geometry was completely filled with the VC. In option 1, only a small amount of the VC entered the distal part of the left VA. Therefore, option 1 had no advantage over option 2 in regards to preserving the flow to the vertebrobasilar junction. The model also predicted increased flow residence time in that region, which is likely to facilitate thrombosis.
Fig. 4.
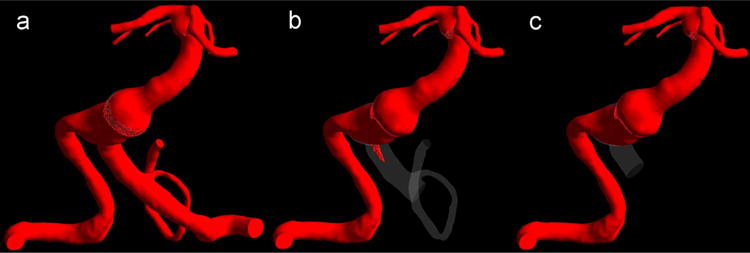
The virtual contrast simulations for (a) preoperative flow, (b) option 1 and (c) option 2, showing postoperative flow regions filled with the VC at the time step when the preoperative geometry was completely filled.
The time dependent volume fraction of the VC in the PICA for the preoperative case and the option 1 during ten cardiac cycles are shown in Fig. 5. While under preoperative conditions the left PICA was completely filled with the VC just after two cardiac cycles, it took almost ten cardiac cycles in the option 1. The extremely slow filling of the PICA in the option 1 is likely to promote thrombus deposition in this vessel. It should be noted, that the flow streamlines, Fig. 2b, suggested that the left PICA could be supplied by the contralateral VA. However, VC modeling showed that the flow residence time could be long enough for the thrombotic occlusion of the PICA.
Fig. 5.
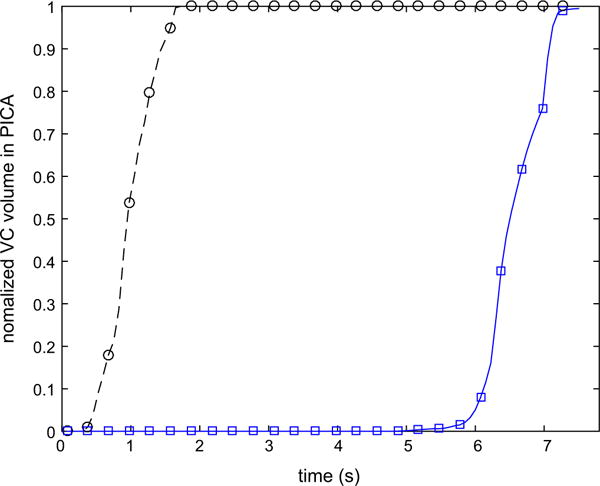
Variation of the normalized volume of the VC in the left PICA during ten cardiac cycles following the injection for preoperative case and option 1.
3.1.2. Patient 2
The flow and the transport of the VC for the three alternative interventions described in the methods section were simulated to assess how these interventions would affect the flow through the AICAs and brainstem perforators. The intra-aneurysmal regions filled with the VC under different flow scenarios are shown in Fig. 6 at the same time step corresponding to the end of ten cardiac cycles. It can be observed that by the time the vascular geometry is completely filled with the VC in the preoperative flow (Fig. 6a), all of the brainstem perforators are still empty in the options 2 and 3 (Fig. 6c and d). However, clipping of the left PCA resulted in a better outcome as some of the perforators were filled (Fig. 6b).
Fig. 6.
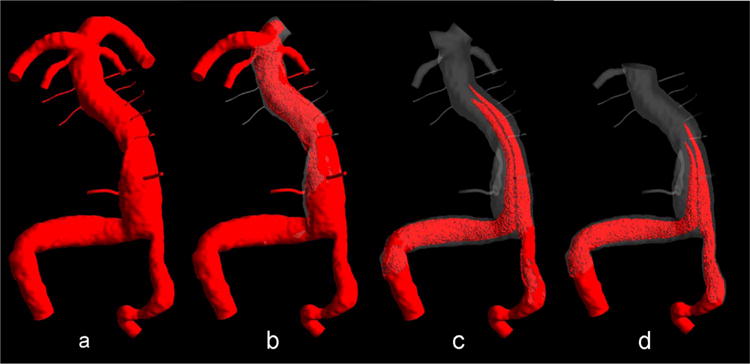
Virtual contrast simulations: (a) preoperative flow, (b) clipping of the left PCA, (c) clipping both PCAs, and (d) clipping of basilar artery apex with maintaining the right SCA open.
In order to have a better assessment of the flow residence time in various regions of the verterbrobasilar system, the temporal changes of the volume fraction filled with the VC are shown in Fig. 7. Three vessel segments are presented: the basilar trunk and the left and right AICA. In the preoperative flow the basilar trunk was completely filled with the VC after five cardiac cycles, while in the options 2 and 3 less than 30% and 20% of the basilar trunk were filled after ten cardiac cycles, respectively. The regions not filled with the VC are characterized by increased flow residence time and could be prone to thrombus deposition (Rayz et al., 2010; Rayz et al., 2008b). According to Fig. 7b, the filling of the AICAs with the VC took approximately five more cardiac cycles in the option 1 in comparison with the preoperative case. The option 2 may impact the patency of the left and right AICAs as both vessels did not received any VC even after ten cardiac cycles.
Fig. 7.
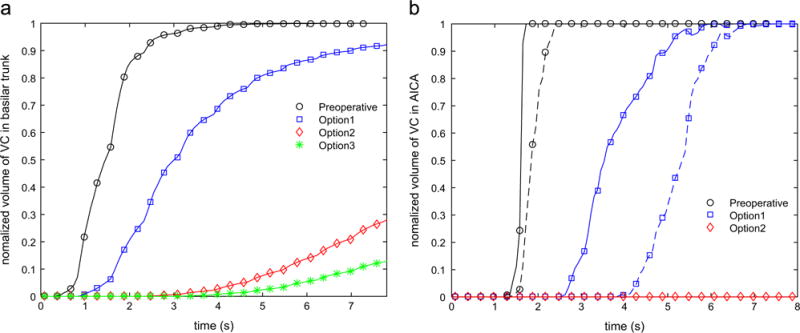
Variation of the normalized volume of the VC in (a) basilar trunk and (b) AICAs during ten cardiac cycles following the injection; in panel (b) the solid and dashed lines correspond to the left and right AICAs, respectively.
3.2. Comparison between CFD and X-ray angiography
The transport of the mixture of blood with contrast was simulated; the results are qualitatively compared with the X-ray angiograms in Fig. 8 for patient 1 (panel a) and patient 2 (panel b). In both cases, the numerical results and preoperative X-ray angiography images are shown in the top and bottom rows, respectively. While there is a reasonable qualitative agreement between the general features of the modeling and imaging results, a careful examination reveals some discrepancies in both contrast arrival and washout. For example, the in vivo images show that the contrast injection from a catheter placed in the left VA caused a retrograde flow in the right VA, however this could not be detected from the CFD-based images.
Fig. 8.
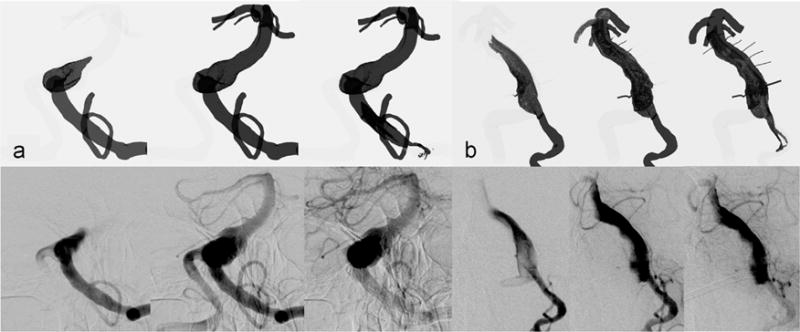
Comparison of preoperative contrast (mixture approach) simulations, the top row, and X-ray angiography images, the bottom row, for (a) patient 1 and (b) patient 2.
Numerical results obtained from the simulations of the VC and the contrast and blood mixture are shown in comparison with the postoperative X-ray angiography data in Fig. 9. The top row shows the results of contrast agent modeling as a passive tracer not affecting the flow velocities. For this simulation, a time-dependent concentration profile was prescribed at the inlet of the right VA mimicking the injection of the contrast. The middle row shows the results of the mixture modeling approach, where the actual flow rate of the contrast injection as well as the viscosity and density of the mixture were used. The columns show snapshots of the filling and washout patterns at the same time steps following the beginning of the injection. Using the mixture model for the simulation of the contrast agent resulted in a better agreement with the X-ray angiography images. The improvement in the qualitative comparison is particularly evident during the washout phase. As presented in Fig. 9b and c, both the mixture modeling approach and the in vivo images indicated that the filling of the vertebrobasilar junction with contrast agent started in the second column. Moreover, by the end of the injection shown in column 3, some amount of contrast entered the left PICA, and the last two columns show a complete filling of the left PICA. However none of the above could be observed in Fig. 9a showing the contrast modeled as a passive VC.
Fig. 9.
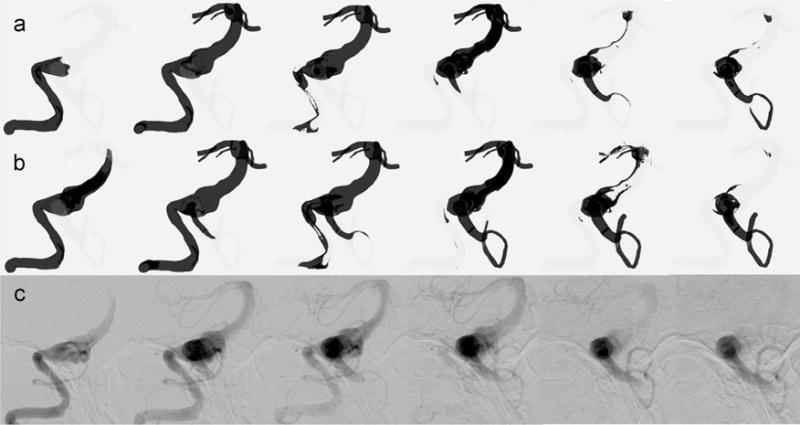
Comparison of simulations modeling (a) a passive VC transport and (b) a mixture of blood and contrast agent with (c) X-ray angiography images for patient 1 and under the option 1 flow condition.
4. Discussion
X-ray angiography technique is routinely used in clinical practice; however, blood flow can be significantly affected by the injection. Numerical modeling of a virtual contrast transport can be used as a non-invasive alternative to X-ray angiography for the flow visualization and prediction of intra-aneurysmal regions prone to thrombus deposition. The virtual contrast injection is modeled as advection of a passive tracer with blood flow. This technique shows the filling and washout patterns which are based on the native flow fields and provides information on flow residence time.
We considered two approaches for modeling a contrast agent injection, depending on whether the flow of a passive tracer or a mixture of the blood with a contrast agent is simulated. If a virtual contrast transport is modeled by solving the advection-diffusion equation for a passive tracer, the results will show the filling patterns of the native blood flow. The passive tracer simulations, however, cannot be validated with X-ray angiograms which show the flow of a contrast mixture. If the Omnipaque injection is simulated using the flow rates and transport properties of the iodine-based mixture, the computations could be compared to X-ray angiograms. While modeling the injection of Omnipaque does not represent physiological flow structures, it is important for understanding the flow changes resulting from vascular interventions and can serve to improve the accuracy of CFD predictions by comparing them to in vivo X-ray angiography data. Once it is shown that CFD models can reliably predict postoperative flow fields, they can be used to evaluate flow residence time for the native, patient-specific blood flow patterns, not affected by the contrast agent injection.
The numerical results obtained from CFD modeling of contrast and blood mixture look qualitatively similar to the X-ray angiograms, however there are some discrepancies in the filling and washout patterns. Several factors could contribute to the disagreement; a more realistic modeling of the contrast injection should account for vessel compliance and proximal flow suppression during the injection (Mulder et al., 2011; Sun et al., 2012). In addition, the contrast injection may affect the downstream pressure. Previous comparisons of CFD and X-ray angiography were mostly limited to aneurysms with a single inlet (Castro et al., 2006; Ford et al., 2005; Sun et al., 2012). However, aneurysms of the basilar artery receive the flow from the two VAs. The pressure increase in the injected VA can suppress and even reverse the flow in the contralateral VA as shown in Fig. 8 for both patients. Another factor could be the presence of the catheter, which may also affect the flow (Sun et al., 2012).
Furthermore, the in vivo X-ray angiography images in Figs. 8 and 9 show the attenuation of the X-rays by the iodine tracer. There is a continuous variation of the image intensity, depending on the vessel thickness and the amount of the contrast agent. Contrary to that, the images showing the CFD-simulated contrast transport are binary, i.e. the regions where the contrast concentration is above a certain threshold are shown in black, while the remaining model is shown in white. A better comparison can be achieved by obtaining the maximum intensity projections from the numerical results, adding the contrast concentration in the direction corresponding to the X-ray angiography plane (Sun et al., 2012). Despite these shortcomings, the study showed that numerical modeling of contrast agent injection can simulate X-ray angiograms.
5. Conclusions
In order to evaluate postoperative flow resulting from vascular interventions, image-based CFD models were used to simulate flow field and transport of a contrast agent in two basilar aneurysms for preoperative and postoperative flow conditions. The transport of contrast agent was simulated using two different approaches: modeling it as a virtual contrast (passive tracer) and as a mixture of Omnipaque and blood. The study demonstrated a good qualitative agreement between the numerical results and in vivo X-ray angiography data, when the model accounts for the injection flow rate and the properties of the contrast agent/blood mixture. The results indicated that blood flow patterns can be affected by the contrast agent injection thus providing inadequate information on the flow residence time. CFD modeling of a virtual contrast transport can predict post-surgical regions of flow separation and stagnation as it is based on the native flow fields. This information may help treatment planning by eliminating surgical options that are likely to cause thrombotic occlusion of the vital branches of the basilar artery.
Acknowledgments
Support of NIH, United States R01 HL115267 award (VLR) is acknowledged.
Footnotes
Conflict of interest
We have no conflict of interest to disclose.
References
- Boussel L, Rayz V, Martin A, Acevedo-Bolton G, Lawton MT, Higashida R, Smith WS, Young WL, Saloner D. Phase-contrast magnetic resonance imaging measurements in intracranial aneurysms in vivo of flow patterns, velocity fields, and wall shear stress: comparison with computational fluid dynamics. Magn Reson Med. 2009;61:409–417. doi: 10.1002/mrm.21861. [DOI] [PMC free article] [PubMed] [Google Scholar]
- Boussel L, Rayz V, McCulloch C, Martin A, Acevedo-Bolton G, Lawton M, Higashida R, Smith WS, Young WL, Saloner D. Aneurysm growth occurs at region of low wall shear stress: patient-specific correlation of hemodynamics and growth in a longitudinal study. Stroke. 2008;39:2997–3002. doi: 10.1161/STROKEAHA.108.521617. [DOI] [PMC free article] [PubMed] [Google Scholar]
- Burleson AC, Turitto VT. Identification of quantifiable hemodynamic factors in the assessment of cerebral aneurysm behavior. On behalf of the subcommittee on biorheology of the scientific and standardization committee of the ISTH. Thromb Haemost. 1996;76:118–123. [PubMed] [Google Scholar]
- Castro MA, Putman CM, Cebral JR. Patient-specific computational modeling of cerebral aneurysms with multiple avenues of flow from 3D rotational angiography images. Acad Radiol. 2006;13:811–821. doi: 10.1016/j.acra.2006.03.011. [DOI] [PubMed] [Google Scholar]
- Cebral JR, Castro MA, Appanaboyina S, Putman CM, Millan D, Frangi AF. Efficient pipeline for image-based patient-specific analysis of cerebral aneurysm hemodynamics: technique and sensitivity. IEEE Trans Med Imaging. 2005;24:457–467. doi: 10.1109/tmi.2005.844159. [DOI] [PubMed] [Google Scholar]
- Cebral JR, Mut F, Sforza D, Löhner R, Scrivano E, Lylyk P, Putman C. Clinical application of image-based CFD for cerebral aneurysms. Int J Numer Methods Biomed Eng. 2011;27:977–992. doi: 10.1002/cnm.1373. [DOI] [PMC free article] [PubMed] [Google Scholar]
- Chung B, Cebral JR. CFD for evaluation and treatment planning of aneurysms: review of proposed clinical uses and their challenges. Ann Biomed Eng. 2015;43:122–138. doi: 10.1007/s10439-014-1093-6. [DOI] [PubMed] [Google Scholar]
- Ford MD, Stuhne GR, Nikolov HN, Habets DF, Lownie SP, Holdsworth DW, Steinman DA. Virtual angiography for visualization and validation of computational models of aneurysm hemodynamics. IEEE Trans Med Imaging. 2005;24:1586–1592. doi: 10.1109/TMI.2005.859204. [DOI] [PubMed] [Google Scholar]
- Gambill WR. How to estimate mixtures viscosities. Chem Eng. 1959;66:151–152. [Google Scholar]
- Inc., G.H., editor. GE. Omnipague (iohexol) Injection. 2007. [Google Scholar]
- Hacein-Bey L, Provenzale JM. Current imaging assessment and treatment of intracranial aneurysms. Am J Roentgenol. 2011;196:32–44. doi: 10.2214/AJR.10.5329. [DOI] [PubMed] [Google Scholar]
- Jeong W, Rhee K. Hemodynamics of cerebral aneurysms: computational analyses of aneurysm progress and treatment. Comput Math Methods Med. 2012;2012:11. doi: 10.1155/2012/782801. [DOI] [PMC free article] [PubMed] [Google Scholar]
- Lawton MT, Spetzler RF. Surgical strategies for giant intracranial aneurysms. In: Langmoen IA, Lundar T, Aaslid R, Reulen H-J, editors. Neurosurgical Management of Aneurysmal Subarachnoid Haemorrhage. Springer; Vienna: 1999. pp. 141–156. [Google Scholar]
- Markl M, Chan FP, Alley MT, Wedding KL, Draney MT, Elkins CJ, Parker DW, Wicker R, Taylor CA, Herfkens RJ, Pelc NJ. Time-resolved three-dimensional phase-contrast MRI. J Magn Reson Imaging. 2003;17:499–506. doi: 10.1002/jmri.10272. [DOI] [PubMed] [Google Scholar]
- Markl M, Frydrychowicz A, Kozerke S, Hope M, Wieben O. 4D flow MRI. J Magn Reson Imaging. 2012;36 doi: 10.1002/jmri.23632. [DOI] [PubMed] [Google Scholar]
- Markl M, Schnell S, Barker AJ. 4D flow imaging: current status to future clinical applications. Curr Cardiol Rep. 2014;16:1–9. doi: 10.1007/s11886-014-0481-8. [DOI] [PubMed] [Google Scholar]
- Mulder G, Bogaerds ACB, Rongen P, van de Vosse FN. The influence of contrast agent injection on physiological flow in the circle of Willis. Med Eng Phys. 2011;33:195–203. doi: 10.1016/j.medengphy.2010.09.021. [DOI] [PubMed] [Google Scholar]
- Nayak KS, Nielsen JF, Bernstein MA, Markl M, Botnar RM, Gatehouse PD, Saloner D, Lorenz C, Wen H, Hu BS, Epstein FH, Oshinski JN, Raman SV. Cardiovascular magnetic resonance phase contrast imaging. J Cardiovasc Magn Reson. 2015;17 doi: 10.1186/s12968-015-0172-7. [DOI] [PMC free article] [PubMed] [Google Scholar]
- Penn DL, Komotar RJ, Sander Connolly E. Hemodynamic mechanisms underlying cerebral aneurysm pathogenesis. J Clin Neurosci. 2011;18:1435–1438. doi: 10.1016/j.jocn.2011.05.001. [DOI] [PubMed] [Google Scholar]
- Prevrhal S, Forsythe CH, Harnish RJ, Saeed M, Yeh BM. CT angiographic measurement of vascular blood flow velocity by using projection data. Radiology. 2011;261:923–929. doi: 10.1148/radiol.11110617. [DOI] [PubMed] [Google Scholar]
- Rayz VL, Abla A, Boussel L, Leach JR, Acevedo-Bolton G, Saloner D, Lawton MT. Computational modeling of flow-altering surgeries in basilar aneurysms. Ann Biomed Eng. 2015;43:1210–1222. doi: 10.1007/s10439-014-1170-x. [DOI] [PMC free article] [PubMed] [Google Scholar]
- Rayz VL, Boussel L, Acevedo-Bolton G, Martin AJ, Young WL, Lawton MT, Higashida R, Saloner D. Numerical simulations of flow in cerebral aneurysms: comparison of CFD results and in vivo MRI measurements. J Biomech Eng. 2008a;130(051011-051011) doi: 10.1115/1.2970056. [DOI] [PubMed] [Google Scholar]
- Rayz VL, Boussel L, Ge L, Leach JR, Martin AJ, Lawton MT, McCulloch C, Saloner D. Flow residence time and regions of intraluminal thrombus deposition in intracranial aneurysms. Ann Biomed Eng. 2010;38:3058–3069. doi: 10.1007/s10439-010-0065-8. [DOI] [PMC free article] [PubMed] [Google Scholar]
- Rayz VL, Boussel L, Lawton MT, Acevedo-Bolton G, Ge L, Young WL, Higashida RT, Saloner D. Numerical modeling of the flow in intracranial aneurysms: prediction of regions prone to thrombus formation. Ann Biomed Eng. 2008b;36:1793–1804. doi: 10.1007/s10439-008-9561-5. [DOI] [PMC free article] [PubMed] [Google Scholar]
- Rayz VL, Lawton MT, Martin AJ, Young WL, Saloner D. Numerical simulation of pre- and postsurgical flow in a giant basilar aneurysm. J Biomech Eng. 2008c;130(021004-021004) doi: 10.1115/1.2898833. [DOI] [PubMed] [Google Scholar]
- Rinkel GJE, Djibuti M, Algra A, van Gijn J. Prevalence and risk of rupture of intracranial aneurysms: a systematic review. Stroke. 1998;29:251–256. doi: 10.1161/01.str.29.1.251. [DOI] [PubMed] [Google Scholar]
- Rispoli VC, Nielsen JF, Nayak KS, Carvalho JLA. Computational fluid dynamics simulations of blood flow regularized by 3D phase contrast MRI. Biomed Eng OnLine. 2015;14:1–23. doi: 10.1186/s12938-015-0104-7. [DOI] [PMC free article] [PubMed] [Google Scholar]
- Shpilfoygel SD, Close RA, Valentino DJ, Duckwiler GR. X-ray videodensitometric methods for blood flow and velocity measurement: a critical review of literature. Med Phys. 2000;27:2008–2023. doi: 10.1118/1.1288669. [DOI] [PubMed] [Google Scholar]
- Steinman DA, Milner JS, Norley CJ, Lownie SP, Holdsworth DW. Image-based computational simulation of flow dynamics in a giant intracranial aneurysm. Am J Neuroradiol. 2003;24:559–566. [PMC free article] [PubMed] [Google Scholar]
- Sughrue ME, Saloner D, Rayz VL, Lawton MT. Giant intracranial aneurysms: evolution of management in a contemporary surgical series. Neurosurgery. 2011;69:1261–1271. doi: 10.1227/NEU.0b013e31822bb8a6. [DOI] [PMC free article] [PubMed] [Google Scholar]
- Sun Q, Groth A, Aach T. Comprehensive validation of computational fluid dynamics simulations of in-vivo blood flow in patient-specific cerebral aneurysms. Med Phys. 2012;39:742–754. doi: 10.1118/1.3675402. [DOI] [PubMed] [Google Scholar]
- Taylor CA, Draney MT, Ku JP, Parker D, Steele BN, Wang K, Zarins CK. Predictive medicine: computational techniques in therapeutic decision-making. Comput Aided Surg. 1999;4:231–247. doi: 10.1002/(SICI)1097-0150(1999)4:5<231::AID-IGS1>3.0.CO;2-Z. [DOI] [PubMed] [Google Scholar]
- Taylor CA, Steinman DA. Image-based modeling of blood flow and vessel wall dynamics: applications, methods and future directions. Ann Biomed Eng. 2010;38:1188–1203. doi: 10.1007/s10439-010-9901-0. [DOI] [PubMed] [Google Scholar]
- Urbach H, Dorenbeck U, von Falkenhausen M, Wilhelm K, Willinek W, Schaller C, Flacke S. Three-dimensional time-of-flight MR angiography at 3 T compared to digital subtraction angiography in the follow-up of ruptured and coiled intracranial aneurysms: a prospective study. Neuroradiology. 2008;50:383–389. doi: 10.1007/s00234-007-0355-5. [DOI] [PubMed] [Google Scholar]
- Wallace RC, Karis JP, Partovi S, Fiorella D. Noninvasive imaging of treated cerebral aneurysms, part ii: ct angiographic follow-up of surgically clipped aneurysms. Am J Neuroradiol. 2007;28:1207–1212. doi: 10.3174/ajnr.A0664. [DOI] [PMC free article] [PubMed] [Google Scholar]
- White PM, Wardlaw JM, Easton V. Can noninvasive imaging accurately depict intracranial aneurysms? A systematic review. Radiology. 2000;217:361–370. doi: 10.1148/radiology.217.2.r00nv06361. [DOI] [PubMed] [Google Scholar]


