Abstract
PURPOSE
The presence of microcalcifications (μCalcs) > 5μm within the cap of human fibroatheroma has been shown to produce a 200–700% increase in peak circumferential stress, which can transform a stable plaque into a vulnerable one, whereas μCalcs < 5μm do not appear to increase risk. We quantitatively examine the possibility to distinguish caps with microcalcifications > 5μm based on the gross morphological features of fibroatheromas, and the correlation between the size and distribution of μCalcs in the cap and the calcification in the lipid/necrotic core beneath it.
METHODS
Atherosclerotic lesions (N=72) were imaged using HR-μCT at 2.1-μm resolution for detailed analysis of atheroma morphology and composition, and validated using non-decalcified histology.
RESULTS
At 2.1-μm resolution one observes four different patterns of calcification within the lipid/necrotic core, and is able to elucidate the 3D spatial progression of the calcification process using these four patterns. Of the gross morphological features identified, only minimum cap thickness positively correlated with the existence of μCalcs > 5μm in the cap. We also show that μCalcs in the cap accumulate in the vicinity of the lipid /necrotic core boundary with few on the lumen side of the cap.
CONCLUSION
HR-μCT enables three-dimensional assessment of soft tissue composition, lipid content, calcification patterns within lipid/necrotic cores and analysis of the axial progression of calcification within individual atheroma. The distribution of μCalcs within the cap is highly non-uniform and decreases sharply as one proceeds from the lipid pool/necrotic core boundary to the lumen.
Keywords: micro computed tomography, vulnerable plaque, microcalcifications, fibrous cap rupture
INTRODUCTION
Approximately half of all cardiovascular deaths associated with acute coronary syndrome occur with the rupture of a vulnerable plaque, when a thin fibrous cap overlying a lipid rich core is ripped or fissured under the action of high blood pressure [1]. Criteria based on morphology and tissue composition such as fibrous cap thickness , vasa-vasorum, necrotic core size, and macrophage infiltration [2, 3, 4] have been found to be relevant, but insufficient, to identify vulnerable plaques and assess the risk of rupture. Calcification is also believed to be significant predictor of cardiovascular morbidity and mortality [5]. However, large calcifications have been shown to potentially stabilize a plaque [6]. In marked contrast, biomechanical analysis [7, 8] has shown that small microcalcifications (μCalcs) in close proximity within the fibrous cap itself can lead to a 200–700% increase in local tissue stresses [9–12]. Such a stress accumulation in a region of cap thinning is more than sufficient to exceed the local tissue threshold required to explain the asymptomatic rupture of non-stenotic plaque [7–14].
The key role microcalcifications might play in cap rupture was suggested in Vengrenyuk et al [7] in which high resolution micro-computed tomography (HR-μCT) was used to observe cellular level μCalcs in the fibrous cap proper for the first time. Prior to this nearly all 3D studies of coronary artery calcification were based on macrocalcifications that could be seen using available in vivo imaging techniques IVUS, MRI and OCT. In a series of subsequent studies summarized in [15] the μCalc hypothesis was greatly refined. The catalyst for the present paper is the study in [10], which showed using HR-μCT that 1/3 of all caps contained hundreds of μCalcs > 5μm, some in closely spaced clusters, and that the remaining 2/3 also contained numerous smaller μCalcs between 0.5 and 5μm. This distinction in μCalc size is important since biomechanical analysis predicts that these smaller μCalcs are not high risk for cap rupture [9] whereas μCalcs > 5μm can be if they are in a region of cap thinning.
The present study will address two fundamental questions. One, are there gross morphological features of fibroatheroma which allow one to quantitatively assess whether a given fibrous cap is more or less likely to contain μCalcs > 5μm? Two, what is the relationship, if any, between the μCalc size and distribution in the fibrous cap and the calcification patterns in the lipid pool/necrotic core beneath it?
To our knowledge this is the first 3D imaging study to quantitatively examine the detailed axial progression of calcification within individual atheroma; we show that four distinct calcification patterns can be observed in the lipid /necrotic core beneath the fibrous cap, providing novel insights into the coronary calcification process. In addition, non-decalcified histology is used for visualization of μCalcs between 0.5μm and 5μm in the fibrous cap and for the examination of soft tissue composition and lipid content.
METHODS
Specimens
Ninety six human coronary arteries were harvested from 32 atherosclerotic whole human hearts obtained from the National Disease Research Interchange. Both left and right coronary arteries were dissected preserving their ostium and segments from the right coronary artery (RCA), the left anterior descending artery (LAD) and the circumflex artery (LCX). All procedures were approved by Institutional Animal Care and Use Committees of the City College of New York, NY.
High Resolution Micro Computed Tomography Scanning
Coronary specimens were scanned using a high resolution micro computed tomography (HR-μCT) system (1172, SkyScan, Belgium) at 6.7-μm resolution to identify the location of atheromas within the vessel, and then re-scanned at 2.1-μm resolution for quantitative analysis of μCalcs in the atheroma. Water, air and hydroxyapatite standards (1mm diameter rods containing 250 and 750mg/cm3 hydroxyapatite) were used to calibrate grey color images to mineral density (CTAn, V.1.10.1, SkyScan, BE), allowing identification of lipid, calcified and soft tissues within the atheroma. In total, 72 fibroatheromas were identified. In 69 out of these 72 atheromas, some degree of calcification was detected at 2.1-μm resolution.
Histology
Atheromas were processed using a protocol for high-fidelity histological analysis of non-decalcified coronary arteries [7]. Undecalcified, thin sections (~5μm) were stained to highlight overall morphology and detail regions of calcification using Alizarin Red S, von Kossa and Trichrome staining. Six atheromas were selected and thick sections (~500μm) were prepared, stained with Alizarin Red S and examined at several focal depths using a fluorescence microscope (Zeiss AxioImager D system) equipped with Apotome structured light optical sectioning capability.
μCalc equivalent diameter
HR-μCT images of the atheromas were binarized to segment the calcified particles from the soft tissues in the atheroma using a global thresholding method [11, 16]. The volume, surface and centroid of each individual 3D object were calculated automatically using CTAn analysis software. An equivalent spherical diameter D = (6V/π)1/3 was calculated based on the volume V of each particle. The total calcified volume was the added volume of all individual calcified objects within an atheroma.
The size of the necrotic core was measured as the maximum area in the intima beneath the fibrous cap. Then, the region of the plaque of minimum cap thickness was identified and measured as the shortest distance between the necrotic core and the lumen. The degree of stenosis was calculated as %Stenosis= 100*(1-Ln/Lu) where Ln is diameter of the lumen at the narrowest location, and Lu is the diameter of the unobstructed lumen.
After the μCalcs were identified in the fibrous cap and the local cap thickness was measured, the position of the μCalcs through the cap thickness was normalized from 0 to 1, 0 being the necrotic core boundary and 1 the lumen.
Statistical analysis
Data analysis was performed using (Prism V5.04, Graphpad, San Diego, CA). Unpaired, two tailed t-tests were used to identify differences between morphological features, and differences in the mean were considered significant with p < 0.05.
RESULTS
Identification of atheroma features in HR-μCT imaging
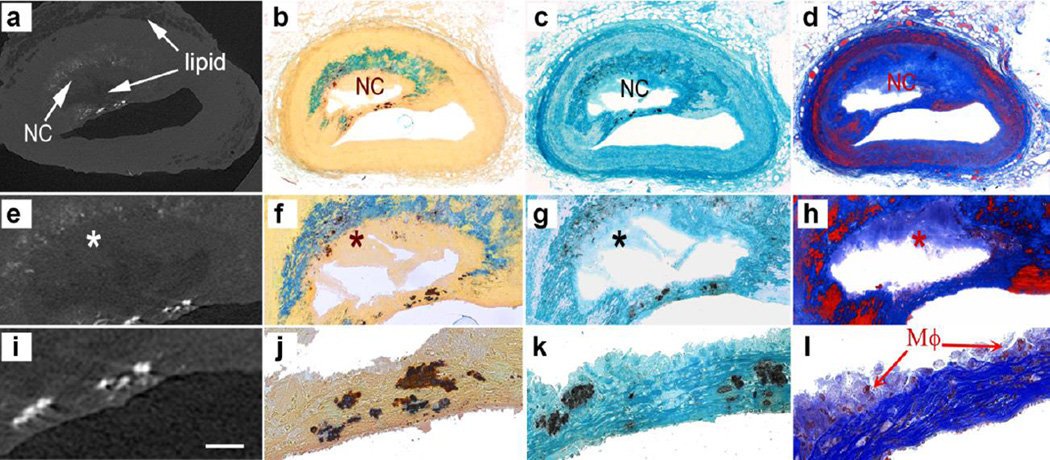
The human atheroma shown in Figure 1 was scanned using HR-μCT at 2.1-μm resolution, and then processed for inspection using undecalcified plastic embedded histology. HR-μCT images in Figure 1a reveal several important atheroma features: (1) a narrowing of the lumen cross section area, asymmetric thickening of the vessel wall, and outer boundary of the vessel wall, (2) atheroma soft tissue displayed as a light gray color, (3) a semi-annular core region with a gray color shade darker than the color in soft tissue, (4) an outer region corresponding to lipid in the adventitia, with a gray color shade darker than the color in soft tissue, similar to the gray color level in the core, (5) calcified tissue represented by a much brighter shade of white.
Fig. 1.
Images of human atheroma obtained using HR-μCT and undecalcified plastic embedded histology. a HR-μCT at 2.1-μm resolution, b Alizarin Red S, c von Kossa and d Thrichrome staining. Magnified views of the atheroma core and cap are shown in (e–h) and (i–l) respectively. Calcified tissue stained red for calcium with Alizarin Red S and black for phosphate with von Kossa. Comparison of HR-μCT images with histology confirmed that the darker gray color in HR-μCT images corresponds to lipid, as shown at the center of the core and the outermost tunica adventitia layer of the vessel. Also, regions in dark grey color in HR-μCT images appear as void regions in histology, since lipid is removed by the histological processing employed. Smooth muscle cells shown in red color in trichrome staining can be distinguished in the media layer and invading the cap shoulders. The necrotic core (NC) is shown in light blue in color correspond to degraded ECM (*). A magnified view of the cap displays μCalcs within the cap and multinucleated cells, possibly macrophages (μφ), at the boundary of the cap from the core side of the lesion in l
Calcified tissue stained red for calcium with Alizarin Red S and black for phosphate with von Kossa in histology section are shown in Figures 1b and 1c, respectively. Collagen is shown in blue and smooth muscle cells in red in trichrome stained sections (Figure 1d). Magnified views of the core are shown in Figures 1e–1h, and magnified views of the cap in Figures 1i–1l. The core in HR-μCT images (Figures 1a and 1e) is generally darker than the surrounding soft tissue; however, its color is not always homogeneous and the boundary of the core may not be a well defined line. Comparison of HR-μCT images with histology confirmed that the darker gray color in HR-μCT images corresponds to lipid, as shown at the center of core and the outermost tunica adventitia layer of the coronary in Figure 1a. Also, regions in dark grey color in HR-μCT images appear as void regions in histology, since lipid is removed by the histological processing employed (Figures 1e–1h). Cores that show both light and dark gray colors correspond thus to lipid and necrotic cores, respectively. In addition to the difference in gray color level, the presence of microcalcifications often helps to distinguish the boundary of the core, which is important to identify the cap, and to determine the minimum cap thickness in 3D image reconstructions. The region that corresponds to lighter hue of grey within the lipid core in HR-μCT (Figures 1a & 1e) is a region containing degraded extracellular matrix (ECM) where no cells were highlighted, thus identified as a necrotic core (NC) in Figures 1d & 1h. Microcalcifications can be observed within and around the core (Figures 1e – 1h) and within the cap (Figures 1i & 1l). Smooth muscle cells shown in red can be distinguished in the media layer and invading the cap shoulders (Figure 1h). A magnified view of the cap displays multinucleated cells, possibly macrophages (MΦ), at the boundary of the cap from the core side of the lesion (Figure 1l).
Progression of calcification in atheroma core
Using HR-μCT we were able to study the 3D morphology of fibroatheromas to analyze spatial changes and patterns of calcification and their relation to lipid and necrotic cores. Our results suggest that spatial changes are indicative of the severity and progression of the calcification process.
We summarized our observations in four different patterns:
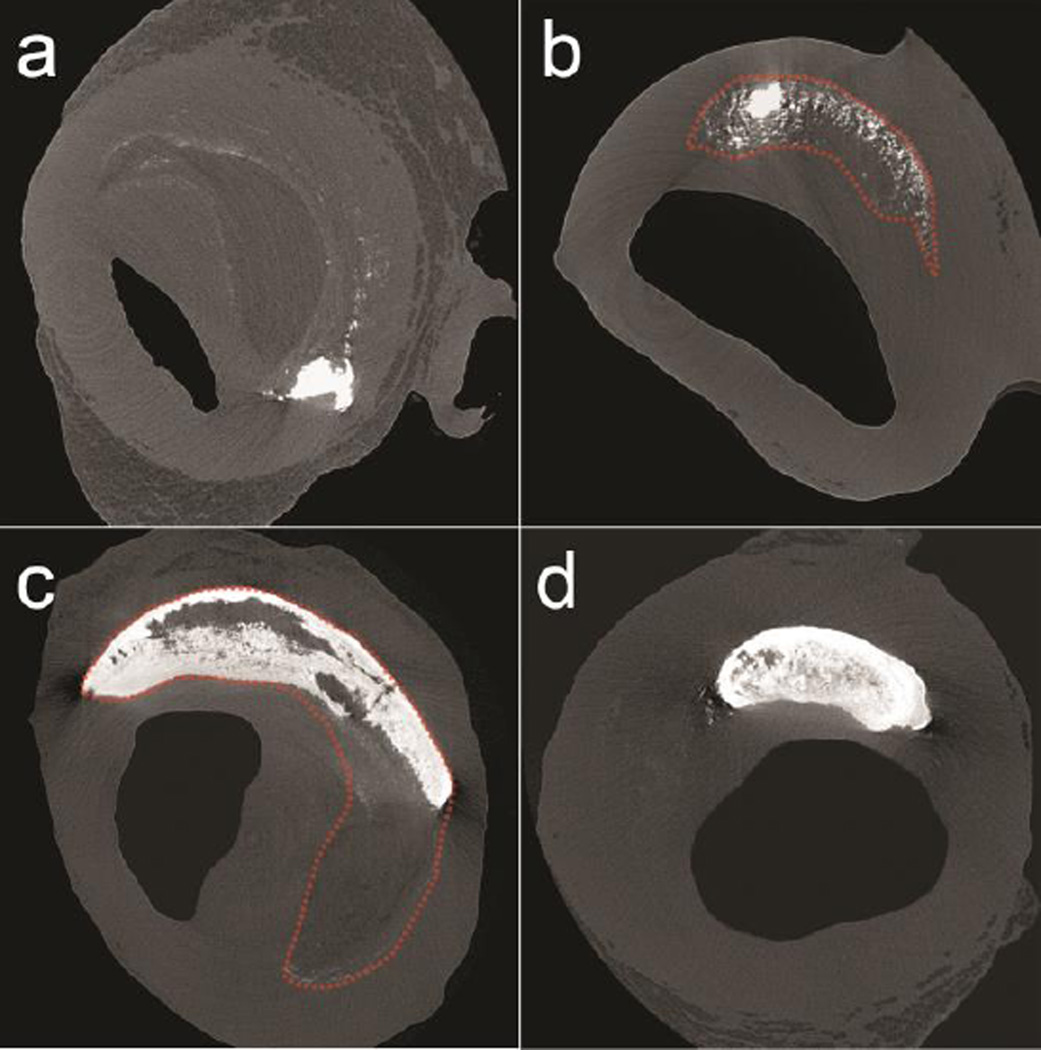
Microcalcifications at the core boundary: In what seems to be the initial stage of calcification development, submicron and micron-size calcified particles [17–20] are aligned at the interface between the soft tissue and the necrotic core, possibly constrained by the internal elastic lamina. In Figure 2a, the atheroma looks like a soft plaque, characterized by a mixed lipid/necrotic core, containing a few isolated μCalcs within the core, and also 0.5 – 5μm size μCalcs were appearing as a fuzzy/dotted border at the core boundary because they are too small to be clearly resolved in HR-μCT at the current 2.1-μm resolution.
Microcalcifications within the core: Small calcified particles < 100μm diameter that are dispersed within the necrotic core. As shown in Figure 2b, μCalcs > 5μm visible at 2.1-μm resolution cluster to form more abundant and larger μCalcs within the core.
Large calcifications within the core: Calcifications > 100μm diameter that either fuse together or that grow through a crystallization process forming a calcification front and large calcifications in the core (Figure 2c).
Advanced calcifications: Calcifications can grow until they completely fill the entire core area forming an advanced calcified plaque (Figure 2d), in some cases growing beyond the core and extending into the tunica media.
Fig. 2.
Calcification patterns A to D distinguished in different human coronary fibroatheromas under HR-μCT imaging at 2.1-μm resolution. Described based on their location, size and stage of calcification. Dotted red lines added to delimit the lipid/necrotic core. a Microcalcifications along the core boundary, b microcalcifications within the core, c Large calcifications forming the boundary and within the core, d advanced macrocalcifications
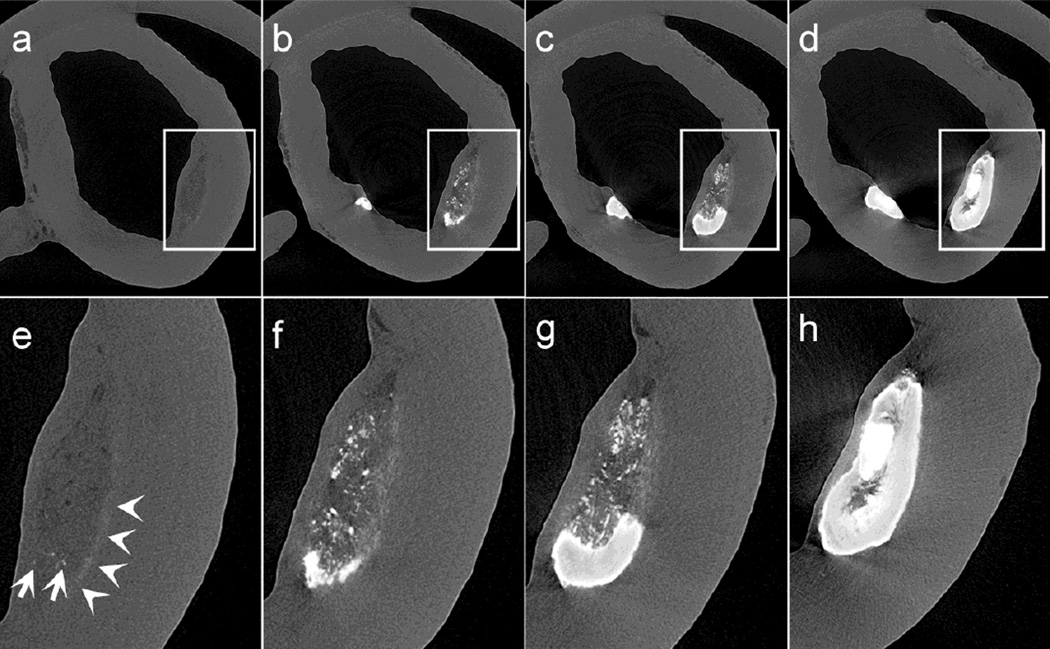
The majority of the atheromas (75.4%) exhibit a combination of 2 or more of the patterns A to D. As shown in Figure 3, all four calcification patterns are found at contiguous locations in this single atheroma along its axial length. These cross sectional images are displayed in sequence, each of them taken ~250μm apart, advancing in the axial direction of the atheroma Figs. 3a–3d.
Fig. 3.
Sequence of images from a human atheroma taken approximately 250μm apart from each other displaying the spatial progression of calcification process in atheroma. (a, e) a soft plaque, characterized by a mixed lipid/necrotic core, containing few isolated μCalcs within the core, and 0.5 – 5μm size μCalcs that cannot be fully resolved in HR-μCT at 2.1-μm resolution, appearing as a fuzzy white line at the bottom of the atheroma, (b, f) submicron μCalcs cluster to form more abundant and larger μCalcs within the core of the lesion, (c, g) microcalcifications further agglomerate to create a larger macrocalcification within the core, (d, h) the calcification fills the entire core area
In 69 out of 72 atheromas analyzed one or more of the four calcification morphologies are present, in the remaining 3, no calcification was detected with HR-μCT at 2.1-μm resolution. Our analysis indicates that pattern A is the most common in the atheromas, as 75.4% have at least one region of μCalcs accumulating at a boundary of the core, followed by pattern C, present in 68.1% of atheromas, with large calcifications forming at the boundaries of the core. Patterns B and D appear in 52.1% and 43.5% of the samples respectively.
The presence of microcalcifications in the fibrous cap
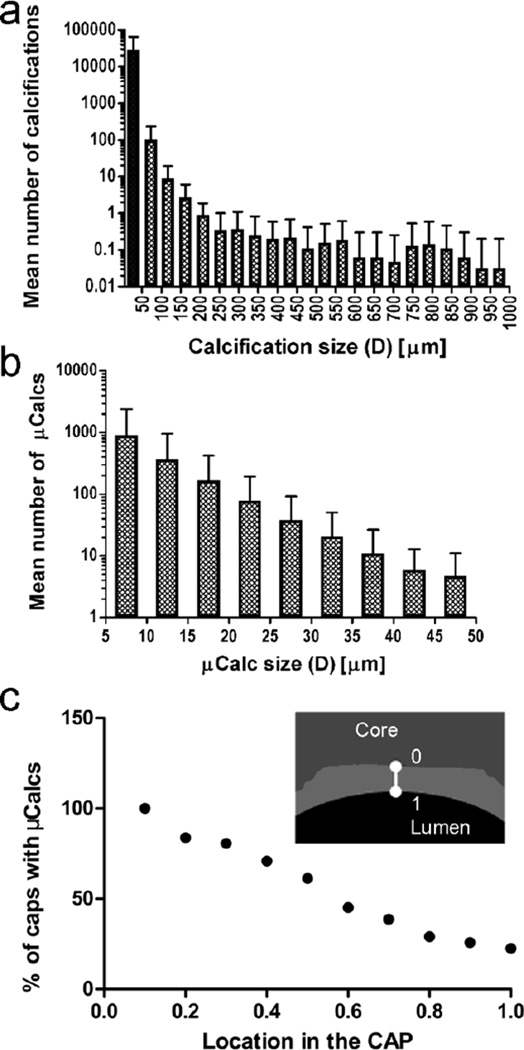
As shown in Figure 1 (1i–1l) μCalcs can be found embedded in the fibrous cap of the atheroma, where they lead to a significant increase in plaque vulnerability [8, 10]. In 27 out of 72 atheromas herein analyzed, we were able to detect the presence of μCalcs in the fibrous cap with diameters between 5 and 50μm. The total number of μCalcs located within the cap region of these atheromas represents a small fraction, ~2%, of all μCalcs in atheromas (Figs. 4a,b). On average, each cap had 2088 μCalcs, within this size range.
Fig. 4.
Mean number of calcifications classified by equivalent spherical diameter, D, that were identified using HR-μCT at 2.1-μm resolution a in whole atheroma (n=72), and b in the cap of atheromas (n=27). Microcalcifications, with 5μm < D < 50μm are shown in the shaded bar in panel a c Location of microcalcifications in fibrous caps (n=27). Percentage of fibrous caps with microcalcifications located at different positions in trough the cap thickness, where 0 is closer to the lipid/necrotic core and 1 is closest to lumen. Showing how the majority of microcalcifications are located close to the core boundary
As rupture can initiate at the location of a microcalcification due to local high local stress concentration, we analyzed the location of μCalcs in the cap, based on their presence in the shoulders or center of the cap, and their position between the necrotic core and the lumen. Our results indicate that 61.3% of caps had μCalcs at both the center and the shoulders, 16.1% just at the center, and 22.6% of at just the shoulder. In addition, we found that most μCalcs are located closer to the necrotic core than to the lumen (Figure 4c), which indicates that the source of these particles would, most likely, be on the necrotic core side of the cap.
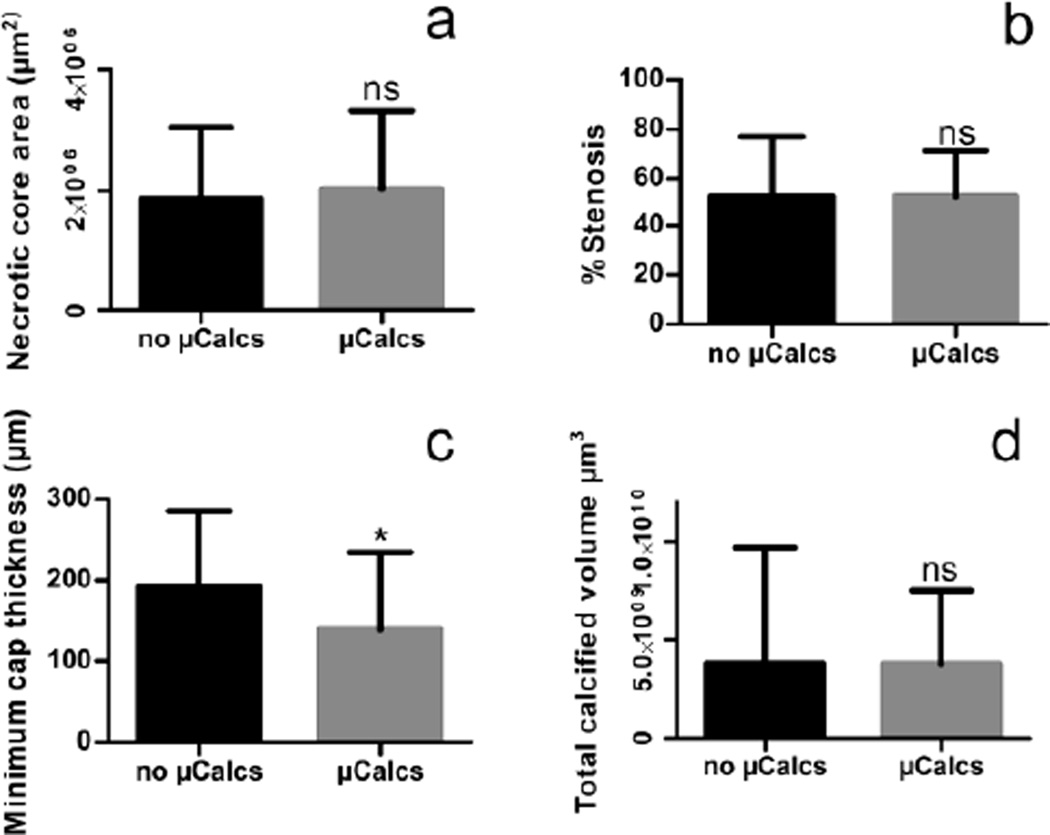
We also examined if the presence of microcalcifications in the cap was related to other important morphological features (Figure 5), which would allow us to separate the caps that contain no μCalcs > 5μm from the caps that have numerous μCalcs > 5μm. We found that minimum cap thickness was significantly smaller in caps where μCalcs > 5μm were present (Figure 5c). On the other hand, necrotic core thickness (Figure 5a), stenosis (Figure 5b) or total calcified volume (Figure 5d), do not significantly differ for the 27 caps with μCalcs > 5μm from the 45 caps without μCals of this size.
Fig. 5.
Morphological features commonly associated with plaque vulnerability compared between caps where μCalcs > 5μm are detected, and caps with no μCalcs. a Necrotic core size. b Percentage of Stenosis c Minimum cap thickness d Calcified Volume
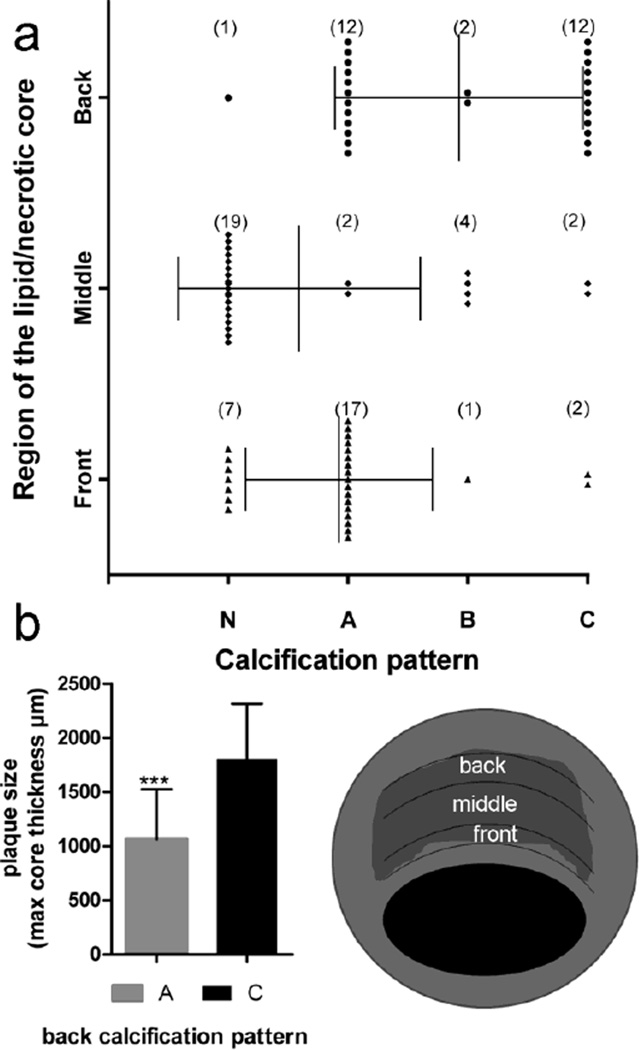
Looking to describe common characteristics among the 27 atheromas with μCalcs in the cap, we evaluated how the local axial region of the cap, a region of roughly 200μm axial length, with the greatest concentration of μCalcs relates to the calcification patterns A, B, and C in Figure 2. The lipid/necrotic core of the plaque was divided into 3 regions: front, middle and back as shown in the schematic in Figure 6. Then, the calcification in each region was described with one of the patterns A, B or C from figure 2 or classified as N if no calcification was detected in that region.
Fig. 6.
Analysis of calcification patterns in the lipid/necrotic core beneath the 27 caps with μCalcs. The schematic indicates how the necrotic core was divided into 3 different regions front, middle and back. a Patterns identified in the different regions of the core b Difference in core size between caps where the back region was classified as pattern A or as pattern C
The results of this analysis (Figure 6a) indicate that in 17 out of 27 plaques, the front region of the core has a border of μCalcs and corresponds to pattern A; in 7 atheromas, the front is not calcified and corresponds to pattern N; in 2 plaques, the core has a large calcification (pattern C), and in just one atheroma the calcifications did follow pattern B. The analysis of the middle region of the core reveals that the majority of the cores are devoid of μCalcs, as 19 out of 27 were classified as N.
In the back of the lipid/necrotic core, patterns A and C are equally common. This characteristic seems to depend on the size of the core; plaques where the back of the lipid/necrotic core is heavily calcified (pattern C) appear to dominate when the core thickness is large (Figure 6b).
μCalcs smaller than 5μm
The smallest calcified particle that can be distinguished with 2.1-μm resolution is about 5μm in diameter; however, it has been shown in the past [10], that μCalcs > 5μm could be an agglomeration of smaller calcifications derived from matrix vesicles [17–20]. This distinction in μCalc size is important since biomechanical analysis predicts that these smaller μCalcs when separated are not high risk for cap rupture [9] whereas agglomerated μCalcs > 5μm can be dangerous if they are in a region of cap thinning.
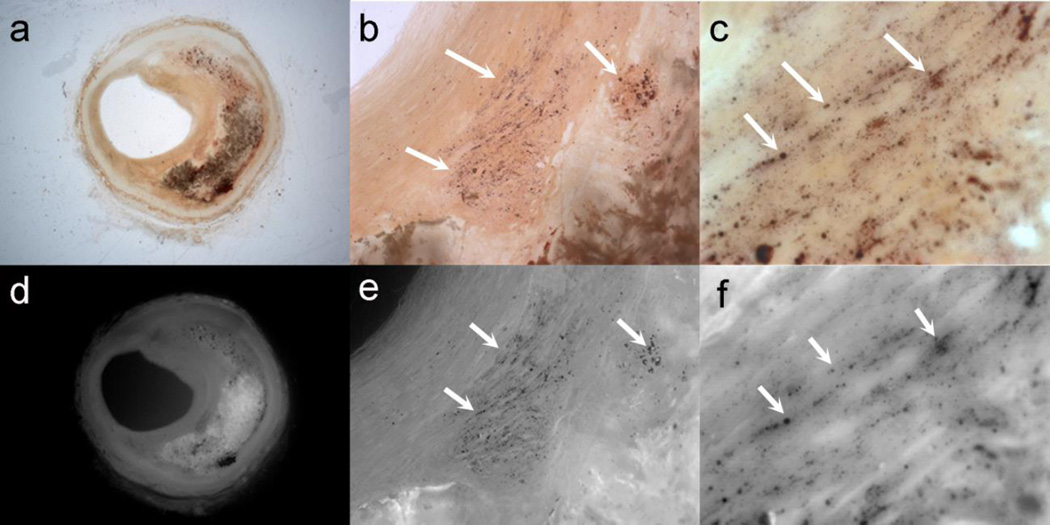
We obtained images of the histological thick sections (500μm) of 6 atheromas, 4 selected corresponding to morphologies A to D in Figure 2, and 2 extra, where calcifications > 5μm had been detected with HR-μCT. Caps stained with alizarin Red S were examined at several magnifications (1×, 10× and 40×) under bright light (Figures 7a–7c) and fluorescent light with a 560nm filter (Figures 7d–7f).These images revealed the presence of μCalcs (arrows) between 0.5 and 5.0μm in all fibrous caps of atheroma with all four gross morphologies whether or not μCalcs > 5μm could be seen in the cap itself.
Fig. 7.
Thick sections (500μm) stained with alizarin Red S examined at several magnifications (1×, 10× and 40×) under bright light (a–c) and fluorescent light (d–f). Arrows show the presence of μCalcs < 5μm in the cap, which are not identifiable in HR-μCT at 2.1-μm resolution
DISCUSSION
Assessment of plaque morphology and tissue composition in an atheroma is critical to understanding plaque rupture vulnerability. During the last decade, pathology studies have been performed to analyze changes in plaque morphology associated with the rupture of fibroatheroma. In particular these studies have emphasized minimum cap thickness and core size [21–23]. This is generally performed by serial sectioning of histological samples that undergo dehydration and decalcification processes before being embedded in paraffin. More recently, histological processing of calcified atheroma has been achieved using plastic/resin embedding and frozen section to better preserve morphology [8, 19]. However, the amount of calcified tissue in the atheroma may still produce shearing artifacts during cutting of the histology tissue block.
The present study demonstrates that HR-μCT imaging provides a non-destructive 3D imaging solution for obtaining a detailed visualization of plaque morphological components, which does not require tissue processing (i.e. dehydration, decalcification, cutting), allowing one to analyze atheromas ex vivo. HR-μCT imaging was able to distinguish the atheroma morphology (lumen, core, and adventitia), presence of lipid (adventitia and core) as well as the morphology, size and location of calcifications. This permits one to distinguish the boundaries of the cap of the atheroma, and to measure the cap thickness from its 3D reconstruction.
One of the key contributions of HR-μCT is to gain a better understanding of the calcification process that fibroatheromas undergo. Large calcifications > 50μm in diameter, that were often thought to be external to lipid/necrotic core are actually a part of a process in which microcalcifications agglomerate and form a crystallization front that advances from one boundary of the core and then spreads inward. In this study, we observed four distinct calcification patterns in the lipid /necrotic core that suggest different stages of calcification progression. The frequency of each of these four patterns is quantified and it is shown that ¾ of all atheromas exhibit two or more of the patterns in Figure 3.
Small μCalcs accumulating at the borders of the core in Figure 2a, are the most commonly found pattern in this sample of 72 atheromas. Consistent with our findings, previous studied had described the presence of submicron size calcifications in the early stages of plaque progression [17, 18]; However, in the present study the use of high resolution 3D images of the entire plaque, allowed a unique description of the calcification process, that links the findings of calcified matrix vesicles with the large calcifications routinely seen in the clinic.
A related process, likely key to understanding atheroma vulnerability is the existence of over 2000 μCalcs 5 to 50μm diameter on average in the cap of human atheromas. This was confirmed in more than one/third of the caps analyzed (27 out of 72). The distribution of μCalcs within the cap is highly non-uniform (Figure 4) and decreases as one proceeds from the lipid/necrotic core boundary to the lumen, possibly indicating that the source of these particles lies in the core beneath the cap. Notably, our results indicate that μCalcs > 5μm are more likely to appear in highly vulnerable regions of the plaque, namely regions of reduced cap thickness (Figure 5) and soft lipid/necrotic cores where μCalcs accumulate at the front boundary (Figure 6). Whether μCalcs in the cap are associated with other factors such as the local biomechanical environment and/or the cell phenotype in such region needs to be investigated in a future work.
A large proportion (~80%) of μCalcs in the cap had an effective diameter between 5 and 15μm, and thus they can be resolved using HR-μCT at 2.1-μm resolution. While we cannot distinguish μCalcs < 5μm with our benchtop HR-μCT system, the presence of smaller μCalcs could be observed in the caps of all histological samples analyzed using microscopy. Even though, our biomechanical analysis [9] has shown that μCalcs < 5μm are not biomechanically dangerous, such caps do need to be analyzed using higher resolution imaging modalities, since these very small μCalcs do agglomerate and potentially become dangerous when they grow to > 5μm, as described in [10, 17].
In summary, HR-μCT at 2.1-μm resolution allowed us to distinguish the different patterns of calcification, as the spatial progression of the calcification process within the lipid /necrotic core in individual atheroma. With this approach, it is possible to not only provide a more accurate quantification of μCalc size and their distribution within the cap, but an improved characterization of fibroatheromas that goes beyond just cap thickness and necrotic core size.
Acknowledgments
Funding Sources
This research has been supported by NIH HL101151, AG034198 & DK103362, National Science Foundation MRI 0723027, 1229449 & CMMI 1333560, and a Professional Staff Congress CUNY award.
Footnotes
Disclosures
None
REFERENCES
- 1.Burke AP, Farb A, Malcom GT, Liang Y, Smialek JE, Virmani R. Plaque rupture and sudden death related to exertion in men with coronary artery disease. JAMA. 1999;281(10):921–926. doi: 10.1001/jama.281.10.921. [DOI] [PubMed] [Google Scholar]
- 2.Virmani R, Burke AP, Kolodgie FD, Farb A. Pathology of the thin-cap fibroatheroma: a type of vulnerable plaque. J Interv Cardiol. 2003;16(3):267–272. doi: 10.1034/j.1600-0854.2003.8042.x. [DOI] [PubMed] [Google Scholar]
- 3.Burke AP, Farb A, Malcom GT, Liang YH, Smialek J, Virmani R. Coronary risk factors and plaque morphology in men with coronary disease who died suddenly. N Engl J Med. 1997;336(18):1276–1282. doi: 10.1056/NEJM199705013361802. [DOI] [PubMed] [Google Scholar]
- 4.Virmani R, Narula J, Leon M, Willerson JTE. The Vulnerable Atherosclerotic Plaque: Strategies for Diagnosis and Management. Malden, MA: Blackwell; 2007. [Google Scholar]
- 5.Vliegenthart R, Oudkerk M, Hofman A, et al. Coronary calcification improves cardiovascular risk prediction in the elderly. Circulation. 2005;112:572–577. doi: 10.1161/CIRCULATIONAHA.104.488916. [DOI] [PubMed] [Google Scholar]
- 6.Huang H, Virmani R, Younis H, Burke AP, Kamm RD, Lee RT. The impact of calcification on the biomechanical stability of atherosclerotic plaques. Circulation. 2001 Feb 27;103(8):1051–1056. doi: 10.1161/01.cir.103.8.1051. [DOI] [PubMed] [Google Scholar]
- 7.Vengrenyuk Y, Carlier S, Xanthos S, Cardoso L, Ganatos P, Virmani R, et al. A hypothesis for vulnerable plaque rupture due to stress-induced debonding around cellular microcalcifications in thin fibrous caps. Proc Natl Acad Sci U S A. 2006;103(40):14678–14683. doi: 10.1073/pnas.0606310103. PMCID: 1595411. [DOI] [PMC free article] [PubMed] [Google Scholar]
- 8.Maldonado N, Kelly-Arnold A, Vengrenyuk Y, Laudier D, Fallon JT, Virmani R, et al. A mechanistic analysis of the role of microcalcifications in atherosclerotic plaque stability: potential implications for plaque rupture. Am J Physiol Heart Circ Physiol. 2012;303(5):H619–H628. doi: 10.1152/ajpheart.00036.2012. PMCID: 3468470. [DOI] [PMC free article] [PubMed] [Google Scholar]
- 9.Maldonado N, Kelly-Arnold A, Cardoso L, Weinbaum S. The explosive growth of small voids in vulnerable cap rupture; cavitation and interfacial debonding. J Biomech. 2013;46(2):396–401. doi: 10.1016/j.jbiomech.2012.10.040. [DOI] [PMC free article] [PubMed] [Google Scholar]
- 10.Kelly-Arnold A, Maldonado N, Laudier D, Aikawa E, Cardoso L, Weinbaum S. A revised microcalcification hypothesis for fibrous cap rupture in human coronary arteries. Proc Natl Acad Sci USA. 2013 Jun 25;110(26):10741–10746. doi: 10.1073/pnas.1308814110. [DOI] [PMC free article] [PubMed] [Google Scholar]
- 11.Vengrenyuk Y, Cardoso L, Weinbaum S. Micro-CT based analysis of a new paradigm for vulnerable plaque rupture: cellular microcalcifications in fibrous caps. Molecular and Cellular Biomechanics. 5(1):37. [PubMed] [Google Scholar]
- 12.Vengrenyuk Y, Kaplan TJ, Cardoso L, Randolph GJ, Weinbaum S. Computational stress analysis of atherosclerotic plaques in ApoE knockout mice. Annals of biomedical engineering. 38(3):738–747. doi: 10.1007/s10439-009-9897-5. [DOI] [PubMed] [Google Scholar]
- 13.Rambhia SH, Liang X, Xenos M, Alemu Y, Maldonado N, Kelly A, et al. Microcalcifications increase coronary vulnerable plaque rupture potential: a patient-based micro-CT fluid-structure interaction study. Ann Biomed Eng. 2012;40(7):1443–1454. doi: 10.1007/s10439-012-0511-x. [DOI] [PubMed] [Google Scholar]
- 14.Cardoso L, Kelly-Arnold A, Maldonado N, Laudier D, Weinbaum S. Effect of tissue properties, shape and orientation of microcalcifications on vulnerable cap stability using different hyperelastic constitutive models. J Biomech. 2014;47(4):870–877. doi: 10.1016/j.jbiomech.2014.01.010. PMCID: 4019736. [DOI] [PMC free article] [PubMed] [Google Scholar]
- 15.Cardoso L, Weinbaum S. Changing views of the biomechanics of vulnerable plaque rupture: a review. Ann Biomed Eng. 2014;42(2):415–431. doi: 10.1007/s10439-013-0855-x. PMCID: 3888649. [DOI] [PMC free article] [PubMed] [Google Scholar]
- 16.Palacio-Mancheno PE, Larriera AI, Doty SB, Cardoso L, Fritton SP. 3D assessment of cortical bone porosity and tissue mineral density using high-resolution micro-CT: Effects of resolution and threshold method. J Bone Miner Res. 2014 Jan;29(1):142–150. doi: 10.1002/jbmr.2012. [DOI] [PMC free article] [PubMed] [Google Scholar]
- 17.Hutcheson J, Maldonado N, Aikawa E. Small entities with large impact: microcalcifications and atherosclerotic plaque vulnerability. Curr Opin Lipidol. 2014;25(5):327–332. doi: 10.1097/MOL.0000000000000105. PMCID: 4166045. [DOI] [PMC free article] [PubMed] [Google Scholar]
- 18.Bobryshev YV, Killingsworth MC, Lord RS, Grabs AJ. Matrix vesicles in the fibrous cap of atherosclerotic plaque: possible contribution to plaque rupture. J Cell Mol Med. 2008;12(5B):2073–2082. doi: 10.1111/j.1582-4934.2008.00230.x. [DOI] [PMC free article] [PubMed] [Google Scholar]
- 19.Roijers RB, Debernardi N, Cleutjens JP, Schurgers LJ, Mutsaers PH, van der Vusse GJ. Microcalcifications in early intimal lesions of atherosclerotic human coronary arteries. Am J Pathol. 2011;178(6):2879–2887. doi: 10.1016/j.ajpath.2011.02.004. PMCID: 3124018. [DOI] [PMC free article] [PubMed] [Google Scholar]
- 20.New SEP, Aikawa E. Molecular Imaging Insights Into Early Inflammatory Stages of Arterial and Aortic Valve Calcification. Circ Res. 2011;108(11):1381–1391. doi: 10.1161/CIRCRESAHA.110.234146. [DOI] [PMC free article] [PubMed] [Google Scholar]
- 21.Ohayon J, Finet G, Gharib AM, Herzka DA, Tracqui P, Heroux J, et al. Necrotic core thickness and positive arterial remodeling index: emergent biomechanical factors for evaluating the risk of plaque rupture. Am J Physiol Heart Circ Physiol. 2008;295(2):H717–H727. doi: 10.1152/ajpheart.00005.2008. PMCID: 2519201. [DOI] [PMC free article] [PubMed] [Google Scholar]
- 22.Akyildiz AC, Speelman L, van Brummelen H, Gutierrez MA, Virmani R, van der Lugt A, et al. Effects of intima stiffness and plaque morphology on peak cap stress. Biomed Eng Online. 2011;10:25. doi: 10.1186/1475-925X-10-25. PMCID: 3090737. [DOI] [PMC free article] [PubMed] [Google Scholar]
- 23.Virmani R, Kolodgie FD, Burke AP, Farb A, Schwartz SM. Lessons from sudden coronary death: a comprehensive morphological classification scheme for atherosclerotic lesions. Arteriosclerosis, thrombosis, and vascular biology. 2000;20(5):1262–1275. doi: 10.1161/01.atv.20.5.1262. [DOI] [PubMed] [Google Scholar]


