Abstract
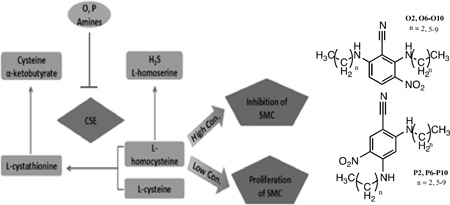
Excessive proliferation of vascular smooth muscle cells (SMC) is an important contributor to the progression of atherosclerosis. Inhibition of proliferation can be achieved by endogenously produced and exogenously supplied nitrogen monoxide, commonly known as nitric oxide (NO). We report herein the dichotomous effects of two isomeric families of secondary amines, precursors to the N-nitrosated NO-donors, on HASMC proliferation. The syntheses of these two families were carried out using two equivalents of homologous, aliphatic monoamines and 2,6-difluoro-3-nitrobenzonitrile (2,6-DFNBN, O family) or 2,4-difluoro-5-nitrobenzonitrile (2,4-DFNBN, P family). The secondary amines belonging to the P family inhibited HASMC proliferation at all concentrations, whereas the O family induced HASMC proliferation at low concentrations, and exhibited inhibitory properties at high concentrations. A probable explanation of these behaviors is proposed herein. L-homocysteine (HCY) is known to induce HASMC proliferation at low concentrations (<1mM) and inhibit HASMC proliferation at higher concentrations (>2.5 mM). Our findings suggest that these two families of amines inhibit cystathionine-γ-lyase (CSE) to varying extents, which directly results in altered levels of intracellular HCY and consequent changes in HASMC proliferation.
Keywords: Human aortic smooth muscle cell proliferation inducers and inhibitors, L-Homocysteine, Isomeric secondary amines, Cystathionine-γ-lyase
Graphical abstract
1. Introduction
Nitric oxide is a crucial signaling molecule in a variety of species. NO, which regulates cell growth, apoptosis, and proliferation, is also involved in the pathophysiology of various disease states including cardiovascular disease, diabetes, inflammation, erectile dysfunction, and multiple nervous system disorders [1].
We have previously reported the preparation, nitrosation, and slow, sustained and rate tunable NO releasing capabilities of N-nitrosated secondary amines [2,3a]. These NO-donors exhibit a longer half-life in comparison to commercially available NO-donors, which release NO in a single, highly concentrated burst. Cell culture studies have indicated that the NO released from the compounds reported by us are capable of inhibiting the proliferation of human aortic smooth muscle cells (HASMC) [2,3a]. A plethora of studies have shown close association between proliferation of HASMC and atherosclerosis [3b]. In order to assess the NO release profiles of the N-nitrosated amines, as well as their inhibitory influences on HASMC proliferation, we have prepared two families of isomeric amines (O and P) containing two aromatic electron-withdrawing groups (cyano and nitro). The preparation and NO release profiles of the N-nitrosated O and P families are beyond the scope of the present discussion and will be reported elsewhere.
Prior to testing the inhibitory effects of these NO donors on the proliferation of HASMC, it was necessary to first determine the effects of the secondary amines on HASMC viability. These experiments were deemed imperative because the nitrosated compounds revert back to the corresponding precursor amines after NO release. Surprisingly, the amines belonging to the O family induced HASMC proliferation at lower amine concentrations, yet when the concentration of these amines exceeded a critical level an inhibition of HASMC proliferation was observed. Amines belonging to the P family inhibited HASMC proliferation in a concentration dependent manner. These behaviors are unlike those observed with the secondary amine precursors (which did not induce either HASMC proliferation or inhibition) from our previous studies with slow and sustained NO-releasing compounds which did not affect HASMC viability [2,3a].
2. Experimental
MTT, 3-(4,5-dimethylthiazol-2-yl)-2,5-diphenyltetrazolium bromide, assay kit, and cellular dimethyl sulfoxide (cDMSO) were purchased from American Type Culture Collection (ATCC). L-Cystathionine (CST), L-homocysteine (HCY), 5,5’-dithiobis-(2-nitrobenzoic acid) (DTNB) (Ellman’s reagent), 7-fluoro-2-oxa-1, 3-diazole-4-sulfonic acid ammonium salt (SBD-F), cysteamine and pyridoxal phosphate (PLP) were purchased from Sigma. Methylformamide, tetrasodium salt of ethylenediamine tetra acetic acid, trichloroacetic acid, tributylphosphine, ethylenediamine tetra acetic acid, and L-cysteine hydrochloride were supplied by Aldrich. Cystathionine-gamma-lyase (CSE) (containing 10 µM PLP) was obtained from Cayman Chemical. SensoLyte Homogeneous AFC Caspase-3/7 Assay Kit and staurosporine were purchased from AnaSpec and Enzo Life sciences, respectively. Lactate dehydrogenase (LDH) assay kit was supplied by Bioo Scientific. Comparisons between treatment groups were made by t-test using the Minitab software program. A value of p < 0.05 was considered statistically significant.
HPLC measurements were conducted using Hitachi D-7000 interface, L-7100 pump, L-7200 auto-sampler, L-7480 fluorescence detector and Microsorb-MV 300-5 C18 (250×4.6 mm) column.
2.1.1. Human Aortic Smooth Muscle Cell Culture
HASMC were cultured with 15 mL smooth muscle cell (SMC) specialty medium (5% Fetal Bovine Serum (FBS), 1% Growth Serum, 1% Penicillin, (ScienCell)) in 75 cm2 cell culture flasks (Corning, with CellBIND surface) to 95% confluency before passaging. Passage six cells were transferred to 96-well plates (Corning, with CellBIND surface) for further assays. Each well contained 100 µL SMC specialty medium (ScienCell) and 3000–3500 cells per well (cpw) (quantified (cells/mL) by a hematocytometer). The seeded plates were placed in an incubator at 37 °C for 16–24h to allow cellular attachment. The medium was replaced with serum-free SMC medium (100 µL) and incubated at 37 °C for 24h to synchronize the cells to G0 before subsequent assays.
2.1.2. HASMC Exposure to Secondary Amines and MTT Assays
Solutions of secondary amines O6–O9 were prepared in cDMSO at three concentrations (1.5 mM, 2.0 mM and 2.5 mM). HASMC were not treated with O10 due to the poor solubility of this compound in cDMSO. Solutions of secondary amines P6–P8 were prepared in cDMSO at three different concentrations (200 µM, 500 µM, and 1mM), while P9, P10 were prepared in cDMSO at two concentrations (200 µM and 500 µM) due to solubility limitations. A 1µL aliquot of each amine solution was combined with SMC medium to render a 1% cDMSO/medium (v/v) solution. In seeded 96-well plates, the serum-free SMC medium was replaced with 100 µL of the 1% cDMSO/medium (v/v) solution containing one of the aforementioned amines. Negative controls were set with SMC medium containing 1% cDMSO only. The assay was completed according to the procedure described earlier [3a].
2.1.3 HASMC Exposure to Secondary Amines P6–P10 and LIVE/DEAD Analyses
Optimum reagent concentrations were previously determined to be 0.50 µM for Ethidium Homodimer-1 (Eth-1) and 0.25 µM for Calcein AM (CAM) for the LIVE/DEAD analyses [3a]. Cells were plated and allowed to attach in clear bottom, black polystyrene 96-well plates (Corning, with CellBIND surface) then synchronized to G0 as outlined in Section 2.1.1. HASMCs then underwent the same treatment procedure with the secondary amines (P6–P10) as discussed in Section 2.1.2. Following treatment with amine solutions, the LIVE/DEAD analyses were carried out as previously described [3a].
2.1.4 HASMC Exposure to Secondary Amines P6–P10 and Caspase 3/7 Apoptosis Analyses
Solutions of secondary amines P6–P8 (200 µM, 500 µM, and 1mM), and P9, P10 (200 µM and 500 µM) were prepared as described above (MTT analyses). Staurosporine (100 µM in cDMSO) was used as the positive control. An aliquot (1 µL) of each amine solution was combined with SMC medium to produce a 1% cDMSO/medium (v/v) solution. A similar procedure was utilized to prepare the staurosporine solution with SMC medium. In seeded 96-well clear-bottomed black polystyrene Corning plates, the serum-free SMC medium was replaced with 100 µL of the 1% cDMSO/medium (v/v) solution. SMC medium with 1% cDMSO was used as the negative control. The plates were incubated at 37 °C for 48h. Caspase 3/7 substrate solution (50 µL), prepared according to the manufacturer’s protocol, was added to each well. The solution in each well was mixed on a plate shaker (100–200 rpm) at room temperature for 60 min in the absence of light. Subsequently, the fluorescence intensity was measured using a fluorescent plate reader at ex/em = 380/500 nm (Molecular Devices) and SoftMax Pro software.
2.1.5 HASMC Exposure to Secondary Amines P6–P10 and LDH Assay
Cells were plated in clear-bottomed 96-well plates (Corning, with CellBIND surface), allowed to attach, then synchronized to G0 as outlined in Section 2.1.1. HASMCs then underwent the same treatment procedure with the secondary amine P8 (as the representative member of the P family) at four different concentrations (200 µM, 500 µM, 1 mM, 2 mM) for 48 hours as described in Section 2.1.2. Subsequent steps were carried out according to the manufacturer’s specified protocol.
2.1.6 HASMC Exposure to HCY
Cells were plated in clear-bottomed 96-well plates (Corning, with CellBIND surface), allowed to attach, and then synchronized to G0 as outlined in Section 2.2.1. Solutions of HCY were prepared in PBS at different concentrations (6.25 µM, 12.5 µM, 25 µM, 50 µM, 100 µM, 200 µM, 400 µM and 800 µM). An aliquot (1 µL) of each HCY solution was combined with SMC medium (2% FBS, 1% Growth Serum, 1% Penicillin, 100 µL) and transferred to 96-well plates. SMC medium with 1% PBS served as the negative control. After incubation (96h) at 37 °C, the cells were subjected to MTT, LIVE/DEAD and LDH assays as described above.
2.1.7 Determination of Intracellular HCY Concentrations (HPLC) of HASMC Upon Exposures to Secondary Amines
The elution time and calibration curve of HCY were obtained with ammonium 7-fluorobenzo-2-oxa-1, 3-diazide-4-sulphonate (SDF-F) modified HCY and cysteamine as the internal standard. The intracellular HCY concentrations of HASMC treated with O8 (20 µM) and P8 (20 µM) were determined by the following protocol. The cells were treated with each amine for 96 hours in a 75-cm2 flask. The cells were quantified and the cell pellets were subsequently suspended in PBS solution (100 µL), followed by addition of the internal standard cysteamine (12.5 µL, 125 µM) to each suspension. Disulfides in the lysate were reduced to thiols by introducing an aqueous solution of dithiothreitol (DTT) (25 µL, 1M) to the suspension, followed by sonication for 20s and incubation at 37 °C for 30 min. The solution was then stripped of proteins by mixing with 0.1% formic acid in acetonitrile (250 µL). The samples were spun at 15,000 g for 10 min. A portion of the clear supernatant (50 µL) was mixed with SBD-F (50 µL, 1 mg/mL borate buffer solution), sodium hydroxide (15 µL, 1.55 M), and borate buffer (125 µL, 0.125 M, pH 9.5 containing 4 mM EDTA), then incubated at 60 °C for 45 minutes.
The SBD-F derivatives of intracellular thiols and the internal standard were eluted with 0.1 M KH2PO4 / 4% acetonitrile, and the eluents were detected by fluorescence detector in the HPLC measurements. Five different concentrations of HCY (1 µM, 5 µM, 25 µM, 50 µM, 100 µM) were mixed with cysteamine. Each mixture was derivatized with SBD-F as described above, and eluted under the same conditions.
2.1.8 CSE Activity Assay
CSE activity was measured by monitoring cysteine concentrations produced from cystathionine using a dithiobisnitrobenzene (DTNB) assay [4]. A standard curve was generated by adding 10 µL (10 mM) DNTB to 100 µL of incrementally increasing concentrations of L-cysteine and determining the absorbance at 412 nm. The substrate (cystathionine) concentration sufficient for enzyme saturation, and KM (0. 326 mM) was determined from the plot of initial velocities of the enzymatic reaction versus the substrate concentrations. CSE (5 µL, 3 mg/mL, 2 mM PLP, specific activity 75 µmoles/min/mg) was added to a solution of cystathionine (100 µL, 2mM) in 0.1 M Tris buffer and incubated at 37 °C for 1h. The reactions were terminated by heating the reaction mixtures at 90 °C for 5 mins. DNTB (10 µL, 10 mM) was added to each reaction mixture and the absorbance was monitored at 412 nm. To assess the inhibitory capacities of the chosen amines O8 and P8, varying concentrations (2 µM–20µM) of the two amines (2 µL dissolved in cDMSO) or cDMSO alone were separately added to identical reaction mixtures containing CSE (0.14 mg/mL) and cystathionine (2 mM). Inhibition constants for O8 and P8 were determined by titrating the assay mixtures with increasing inhibitor concentrations. The KI values were estimated for competitive inhibition, although complete inhibition profiles were not determined. The same procedure was repeated with varying substrate concentrations (0.1 mM, 0.2 mM, 0.5 mM, 1 mM) to obtain a Lineweaver-Burk plot.
The inhibitory properties of compounds O8 and P8 on the activity of CSE were also investigated using HCY as the substrate. Lead acetate was used to monitor the amount of H2S produced. The reaction mixture (115 µL) contained 100 µL HCY (43.5 mM, 50mM Hepes buffer), 0.13 mg/mL CSE (5 µL, 3 mg/mL, 2 mM PLP, specific activity 75 µmoles/min/mg) and 0.35 mM lead acetate (10 µL). After incubating the reaction mixture at 37 °C for 10 minutes, the absorbance at 390 nm was recorded. To assess the inhibitory capacities of the representative amines, varying concentrations of each amine solution in cDMSO (2 µL) or cDMSO alone were added to the reaction mixture above and the absorbance at 390 nm was monitored. The characteristic yellow color of O8 and P8 interferes with absorbance measurements at 390 nm, necessitating the use of a blank. The blank solution constituted of all ingredients except the HCY substrate.
2.1.9 Reversibility of CSE Inhibition by P8
A solution of CSE (75 mg/mL, specific activity 75 µmoles/min/mg) and a solution of CSE (75 mg/mL) with P8 (1 mM in cDMSO) were prepared separately. The solutions were incubated for 15 min at 37 °C and then dialyzed separately (MWCO 10,000 Da) in Tris buffer (100 mM, pH 7.8) at 4 °C for 18h. CSE concentrations after dialysis were determined using a plate reader at 280 nm prior to enzyme activity assays. The dialyzed mixtures were separately introduced to a solution of cystathionine (100 µL, 2 mM, 0.1M Tris buffer) and incubated at 37 °C for 1h. Following incubation, the activities of CSE were determined according to the steps described in the DTNB assay above.
3. Results and Discussion
3.1 Cell Culture Studies
3.1.1 Effects of Secondary Amine Exposure to HASMC
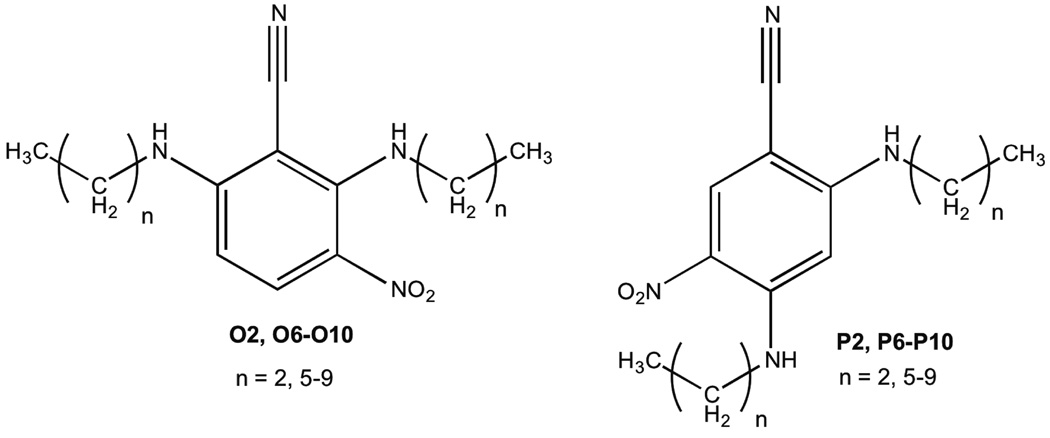
Our initial objective was to identify the possible inhibitory effects of the synthesized NO donors, O6’–O10’ and P6’–P10’, (containing two electron withdrawing groups on the benzene ring in contrast to one, as reported earlier [2,3a]) on HASMC proliferation. Since the N-nitrosated compounds revert to the secondary amine precursors after NO release, it was essential to first observe the consequences of HASMC exposure to the secondary amines, O6–O10 and P6–P10 (Scheme 1), at a range of concentrations.
Scheme 1.
Structures of secondary amines O2, O6–O10 and P2, P6–P10.
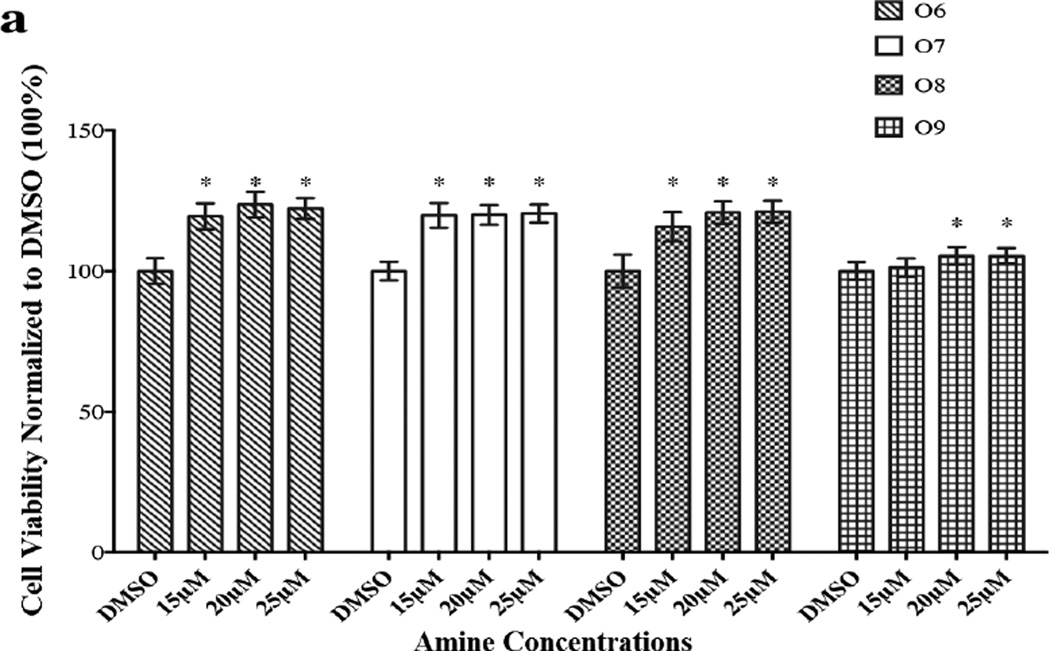
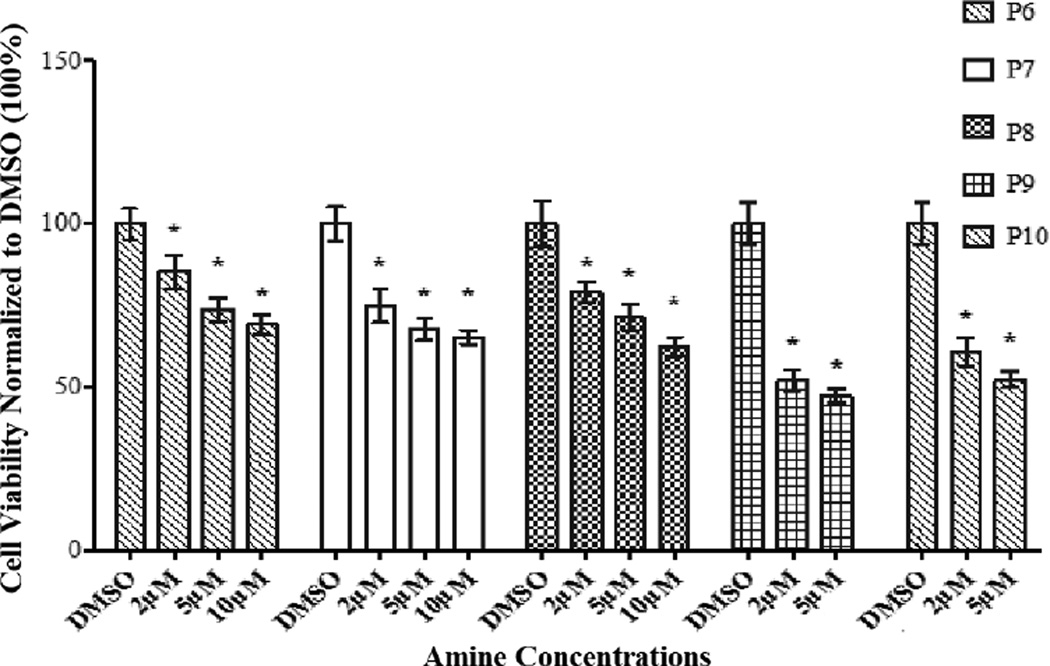
Findings from these studies are depicted in Figures 1a and 1b. An examination of Figure 1a indicates that the amines O6–O9 (O10 was not analyzed because of its poor solubility in cDMSO) induce proliferation of HASMC. The extents of proliferation between 20 µM and 25 µM are essentially identical for O6–O9. We speculate that within this range of amine concentration the changes in the levels of HCY (to be discussed later) are small enough to be inconsequential to an observed downstream increase in HASMC proliferation between the two amine concentrations. A similar insignificant increase in proliferation at low HCY concentrations has been reported previously [5]. It should be noted that at a concentration below 10 µM, the members of the O family did not bring about statistically significant differences in cell viabilities. A possible explanation for the observed threshold (10 µM) may be because of the poorer cell permeability of the O family of amines compared to those of the P family due to the different orientations of the hydrophobic alkyl side chains. The solubility behaviors of these two families of amines further supported the differences observed with cell diffusivities. Briefly, the O family of amines were approximately ten-fold more soluble in highly polar solvents including methanol, ethanol, and glacial acetic acid than the corresponding members of the P family of amines. For example, the solubility of O9 and P9 in ethanol were 2.0 mg/mL and 0.2 mg/mL respectively. Thus, the higher hydrophobicity exhibited by the P family of amines renders them more cell permeable than members of the O family. These observations are in contrast to our earlier studies [2, 3a] with secondary amines containing aromatic nitro or sulfone and nitro substituents, which did not affect cell viability when compared with the control (cDMSO).
Figure 1.
The effects of secondary amines (O6–O9, P6–P10) on HASMC were determined by MTT assay. The absorbance was monitored using a micro plate reader at 570 nm. Results are expressed as the percentage of positive control and mean ± SE. Cells in 1% cDMSO (in the medium), the vehicle for the amines, served as negative control. * p <0.05 versus 1% cDMSO. (a) Proliferative effect of secondary amines (O6–O9). (b) Anti-proliferative effect of secondary amines (P6–P10).
3.1.2 Effects of P6–P10 Exposure to HASMC
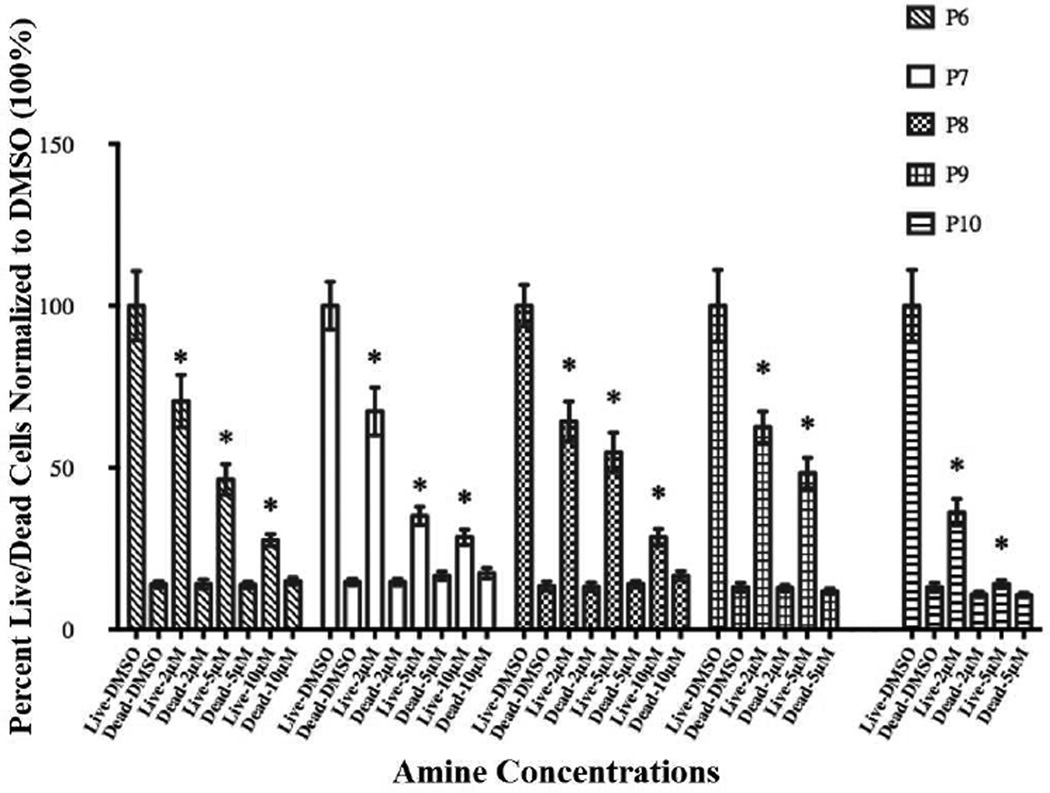
In order to further understand the nature of cell viability decline in the presence of secondary amines P6–P10, we conducted LIVE/DEAD and apoptosis Caspase 3/7 assays on HASMC after amine exposure. Data obtained from LIVE/DEAD assays are depicted in Figure 2. An examination of the figure indicates that with increasing concentrations of the P family amines, the percentage of live cells decreases in a concentration dependent manner, while those of dead cells remain unaffected.
Figure 2.
The cytotoxic effects or a lack thereof of secondary amines (P6–P10) on HASMC were determined by LIVE/DEAD assay. The fluorescence was monitored at em 495/ex 530 and em 495/ex 645 using a micro plate reader. Results are expressed as the percentage of live cells and dead cells and mean ± SE. Cells in 1% cDMSO, the vehicle for the amines, served as negative control. * p <0.05 versus 1% cDMSO.
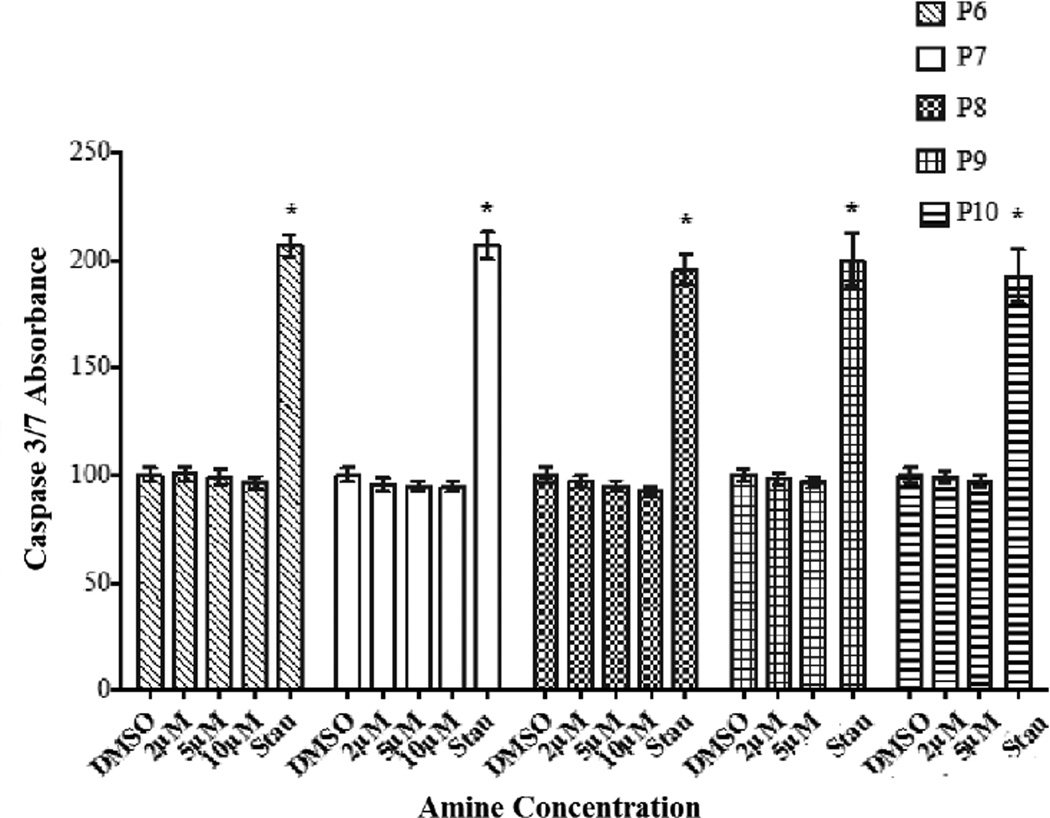
Data from the apoptosis study (Figure 3) and those from LIVE/DEAD assays clearly established the fact that amines P6–P10 bring about a decrease in cell viability by inhibiting proliferation of HASMC rather than causing cell death.
Figure 3.
The apoptotic effects of secondary amines (P6–P10) on HASMC were determined by Capase 3/7 assay. Cells in 1% cDMSO served as negative controls and those exposed to staurosporine (Stau) (100 µM in cDMSO) served as positive controls. The fluorescence intensity at ex 380/em 500 nm was measured using a micro plate reader. Results are expressed as the percentage of 1% cDMSO control and mean ± SE. * p <0.05 versus 1% cDMSO.
In order to further confirm the inhibitory rather than cytotoxic effects of P6–P10, LDH assays were conducted on HASMC post-exposure to one representative (P8) of the P family of amines. Findings from these studies demonstrated the absence of cytotoxic effects at all concentrations of P8 (Supplementary Material, Figure S1a). Other members of the P family are likely to exhibit similar behavior. These observations supported results obtained from LIVE/DEAD and Caspase 3/7 apoptosis analyses that the P family of amines inhibit HASMC proliferation.
3.1.3 Effects of Secondary Amine Exposure (over a wider concentration range) on HASMC Proliferation
In order to investigate the effects of amines belonging to the O and P families on HASMC proliferation over a wide concentration range, we chose to use O2 and P2, (containing shorter ethylamino side chains). These two compounds with lower hydrophobicities exhibited a higher degree of solubility in cDMSO, which allowed us to achieve solutions of higher concentrations.
Findings from these studies, illustrated in Figure 4, clearly indicate distinctive properties for each of these two families of amines. P2 inhibits HASMC proliferation in a concentration dependent manner. On the other hand, O2 exhibits unique effects; cells proliferate at lower O2 concentrations (12.5 µM and 25 µM), and at higher concentrations (50 µM and100 µM) inhibition of cell proliferation was observed.
Figure 4.
The effects of secondary amines (O2, P2) on HASMC proliferation were determined by MTT assay. Absorbance was monitored at 570 nm using a micro plate reader. 1% cDMSO, the vehicle for the amines, served as negative control. Results are expressed as the percentage of 1% cDMSO mean ± SE. * p <0.05 versus 1% cDMSO.
While a variety of factors may cause the amines under consideration to exhibit the aforementioned dichotomous behaviors, we offer a possible explanation. To the best of our knowledge, isomeric compounds capable of exhibiting anti-proliferative behavior (as in case of the P family) and both proliferative and anti-proliferative effects (as in case of the O family) towards HASMC are unknown. However, homocysteine (HCY) is known to induce proliferative and anti-proliferative behaviors in HASMC at low and high concentrations, respectively. Therefore, we sought to establish the effects of the O and P family of amines on intracellular HCY concentrations in HASMC.
3.1.4 Effects of HCY on HASMC Proliferation
HCY has been widely studied to delineate its concentration dependent biphasic effects on HASMC proliferation. It is known that HASMCs proliferate when exposed to lower exogenous concentrations (0.5 mM–1 mM) of HCY. However, when HCY concentration was increased to 2.5 mM, HASMC proliferation was inhibited and continued to decrease with increasing HCY concentrations up to 10 mM [5]. The required levels of HCY used to bring about a decrease in cell viability are higher than the HCY levels in plasma associated with hyper-homocysteinuria (>100 µM) [6, 7]. It is worth noting that an abundance of earlier studies has attributed the decrease in HASMC viability to apoptosis when cells are exposed to high exogenous HCY concentrations [7–11]. Factors attributed to apoptosis include an increase in asymmetric dimethylarginine (ADMA), leading to elevated levels of intracellular reactive oxidative species, (ROS) [7] and enhanced endoplasmic reticulum stress [9]. Excessive HASMC proliferation when the exogenous HCY is low has been documented as well [12–16]. The underlying causes for the proliferation of HASMC when exposed to low exogenous HCY levels have been attributed to enhanced expression of cyclin A and D1 [13, 15], increased phosphorylation of p38-mitogen-activated-protein-kinase and subsequent downstream events [14].
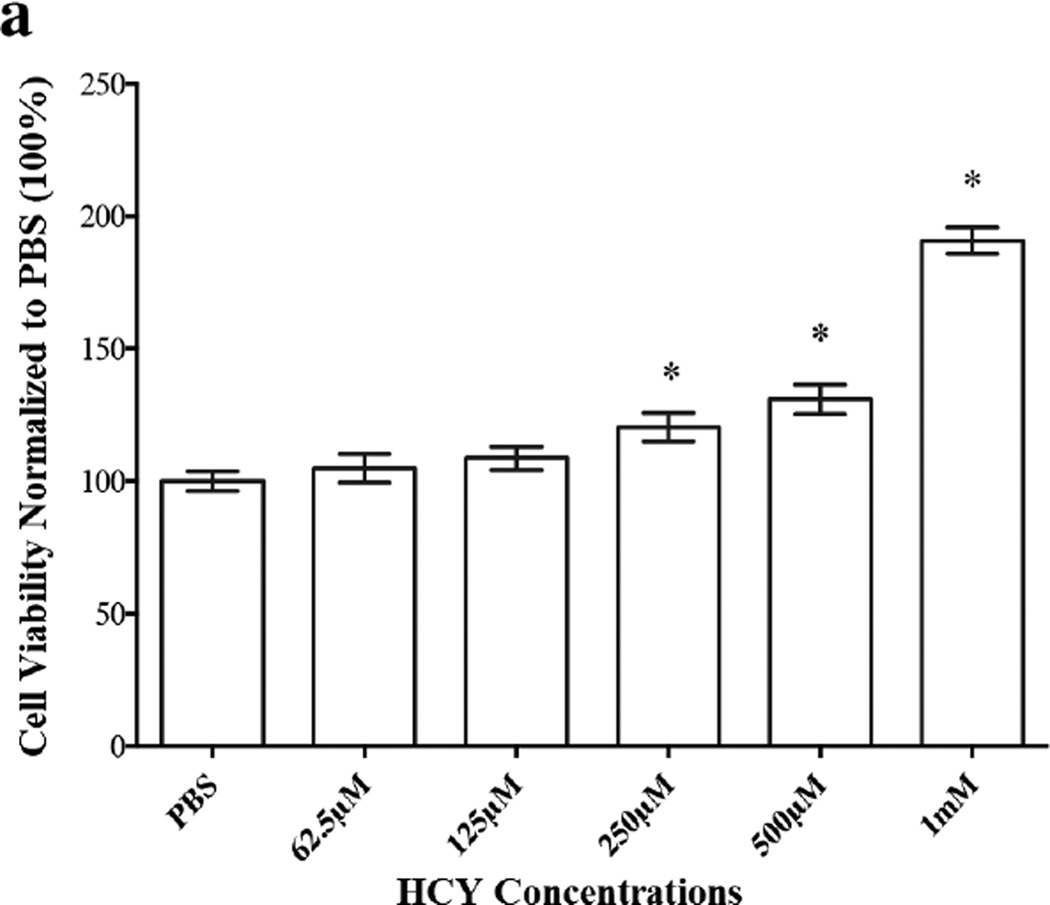
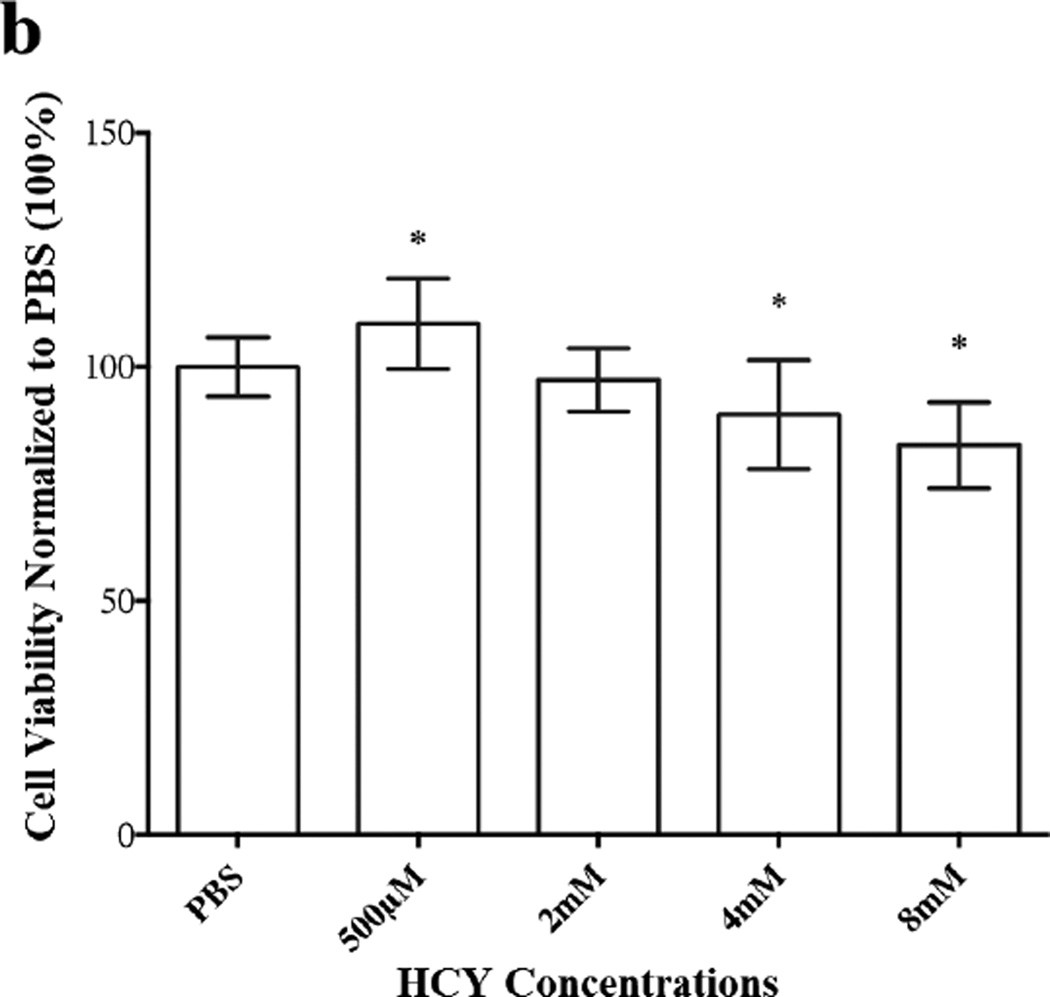
These earlier findings prompted us to investigate the fate of HASMC proliferation upon exposure to exogenous HCY over a wide range of concentrations from 62.5 µM to 8 mM, to further confirm its biphasic influence on HASMC proliferation. In our initial attempt, we used MTT reagent to establish percent cell viability, which offered satisfactory data at lower concentrations of HCY (62.5 µM to 1mM) (Figure 5a). Unfortunately, excess extracellular HCY (≥ 2 mM) reduced MTT to formazan, which was confirmed in a separate experiment. In the absence of HASMC, MTT reagent (1µL) was added to a solution of HCY in PBS (100 µL, 30 mM) and the reaction mixture was incubated for 48h in the dark. At the completion of the incubation period, purple formazan crystals were obtained. Based on these observations, we utilized LIVE/DEAD assay to determine HASMC viability at high HCY concentrations (2mM to 8mM) and one low concentration (500 µM). Data from these studies are displayed in Figure 5b. Analyses of the data from Figures 5a and 5b suggest that at low exogenous HCY concentrations HASMC proliferate (MTT assay, Figure 5a), while higher concentrations of HCY bring about a decrease in cell viability (LIVE/DEAD, Figure 5b). However, it was essential to examine if the decrease in cell viability at high exogenous HCY concentrations was a consequence of cytotoxicity. Therefore, an LDH assay was conducted. Data from this study (Supplementary Materials, Figure S1b) coupled with MTT assay, demonstrate the concentration dependent anti-proliferative effects of exogenous HCY (at very high loading) on HASMC.
Figure 5.
Proliferative and anti-proliferative effects of exogenous HCY over a wide (62.5 µM to 8 mM) concentration range on HASMC. (a) Proliferation was observed until the HCY concentration reached 1mM using MTT assay. The absorbance was monitored at 570 nm using a micro plate reader. HCY concentrations (2mM, 4mM, 8mM and 500 µM) were used. Percent viability was derived from LIVE/DEAD assay. The fluorescence was monitored at em 495/ex 530 and em 495/ex 645 using a micro plate reader. Results are expressed as the percentage of negative control mean ± SE. 1% PBS, the vehicle, served as the control. * p <0.05 versus 1% PBS.
These observations upon exposure of HASMC to O and P families of amines (described above, section 3.1.2) led us to suspect that the amines under investigation are capable of raising the intracellular concentrations of HCY. The extent of these increases is likely to be lower in the case of the O family compared to the amines belonging to the P family, based on the inhibition studies discussed above. In order to verify these assumptions, intracellular HCY levels of HASMC were determined using HPLC before and after the cells had been exposed to equal concentrations of O8 and P8.
3.1.5 Determination of Intracellular HCY Concentrations in Treated and Untreated HASMC
Amines O8 and P8 were dissolved separately in cDMSO and transferred to HASMC culture flasks to achieve a 20 µM concentration of each. The cell lysates were analyzed by HPLC [17–19] (Section 2.1.7) to determine intracellular HCY levels. These values were compared qualitatively with the HCY level determined in unexposed cells. The concentration of HCY in untreated cells was found to be 1.2 µg/106 cells, in contrast to 40 µg/ 106 cells upon treatment with P8 – an increase of ~33 fold. The HCY concentration in cells treated with O8, the weaker inhibitor, was determined to be 2.6 µg/106 cells, a value approximately two-fold higher than the untreated cells. The data obtained from HPLC measurements (Supplementary Material, Figure S2) support the proposition that the P family of amines brings about a larger increase of intracellular HCY concentrations than the members of the O family. We would like to point out that exogenous introduction of HCY and the consequent increase in intracellular concentration of the same (membrane permeability being an important factor) cannot be compared with changes in HCY intracellular concentration following CSE inhibition by these two amines described above. On the other hand, data from HPLC analyses helped to confirm the presence of a similar biphasic trend in HASMC proliferation which is controlled by the inhibitory capacities of these two amines towards CSE.
3.1.6 Metabolism of HCY
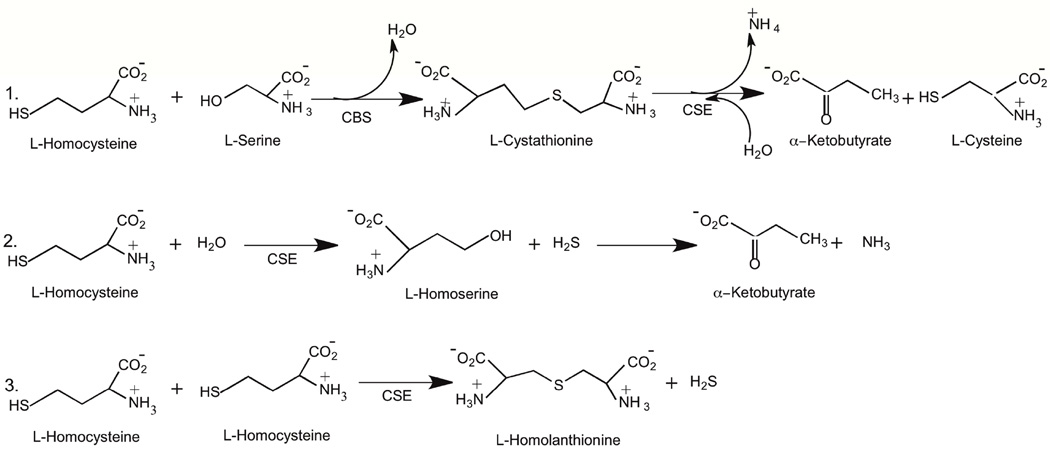
L-Cystathionine (CST), formed by the cystathionine-β-synthase (CBS) catalyzed reaction of HCY and serine with concurrent loss of a molecule of water, serves as a substrate for cystathionine-γ-lyase (CSE) (a PLP dependent enzyme) in the production of α-ketobutyrate and cysteine (Scheme 2, Reaction 1) [20]. Furthermore, CSE, not CBS, which is expressed predominantly in the cardiac tissue [21–23], is responsible for the production of hydrogen sulfide from HCY (Scheme 2, Reactions 2 and 3). More than four decades ago, β-cyanoalanine was shown to inhibit cystathionase [24,25], now known as CSE [26,30]. Since then, several inhibitors for the CSE catalyzed conversion of CST have been reported, which include propargylglycine [27], L-cyanoalanine [24], aminoethoxyvinylglycine [28] and β, β, β-trifluoromethylalanine [29]. Increases in intracellular HCY concentrations are a direct consequence of the varied extent of CSE inhibition (Scheme 2). Thus, it was reasonable to hypothesize that the amines belonging to the O and the P families inhibit CSE to different extents and consequently bring about varied increases in HCY concentrations.
Scheme 2.
CSE catalyzed metabolism of L-homocysteine.
3.1.7 Inhibitory Effects of O and P Family of Amines on CSE using CST as the Substrate
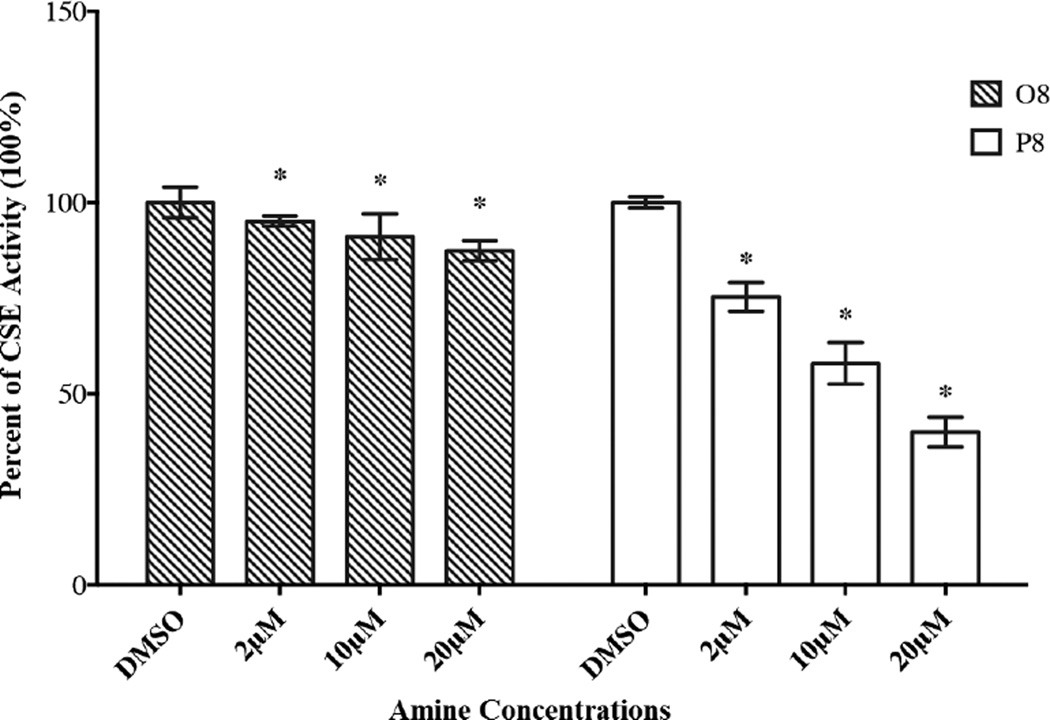
To demonstrate the ability of secondary amines (belonging to the O and P families) to influence intracellular HCY concentration via CSE inhibition, we chose to undertake kinetic studies using O8 and P8 as inhibitors and CST as the substrate (Figure 6). An examination of Figure 6 indicates that both O8 and P8 inhibit CSE in a concentration dependent manner. In addition, P8 exhibited more potent inhibitory capacity than O8. At 20 µM, the reduction in CSE activity induced by P8 was observed to be ~60%, compared to ~10% by O8. The KI values were estimated for O8 (9.0 µM) and P8 (2.0 µM). Furthermore, these values are 36 and 134 times lower than the KM value (0.33 mM) determined for the CSE catalyzed conversion of CST, respectively, which indicates that these amine inhibitors exhibit higher affinity towards the enzyme than that of CST. The measured KM is in agreement with the reported value [20]. The IC50 values of O8 and P8 for CSE inhibition at 2 mM CST were calculated (Cheng-Prusoff equation) to be 64.2 µM and 14.3 µM, respectively. These results would suggest a smaller increase in intracellular HCY in O8 treated cells compared to P8 treated cells (Scheme 2, Reaction 1). As discussed earlier, when the concentration of O8 or other members of the O family (Figure 1a) are increased from 20 µM to 25 µM, an increase in HASMC proliferation from one concentration to the other was not observed, consistent with the weaker inhibitory capacities of the O family of compounds.
Figure 6.
The inhibitory capacities of secondary amines (O8, P8) on CSE were determined by measuring the amount of L-cysteine produced with DNTB. Cells in 1% cDMSO, the vehicle for the amines, served as negative control. Absorbance was monitored at 570 nm using a micro plate reader. Results are expressed as the percentage of negative control mean ± SE. * p <0.05 versus 1% cDMSO.
An approximate four-fold difference in the estimated KI values may not accurately reflect the significantly higher intracellular HCY concentrations (approximately fifteen-fold) of P8 treated cells compared to O8 treated cells, observed from our cell studies described above (Section 3.1.5). As stated earlier, it is likely that P8 permeates through the cell walls with greater ease than O8 because of the relative orientations of the alkyl chains with respect to the nitrile group and differing intra-molecular attractions of these chains in the aqueous cell culture medium. The increased cell permeability of P8 (in comparison with O8) is the likely cause of the fifteen-fold increase in intracellular HCY concentration, which is higher than would be expected from KI values alone.
The reversible nature of CSE inhibition by P8 was confirmed from the Lineweaver-Burk plot (Supplementary Material, Figure S3) and dialysis studies (Section 2.1.8). Approximately 93% of CSE activity could be recovered at the conclusion of the dialysis experiment.
3.1.8 Inhibitory Effects of O and P Family of Amines on CSE Activity using HCY as the Substrate
A series of possible CSE catalyzed reactions of cysteine, HCY, or a combination of the two has been reported [30]. The proposed mechanisms of CSE catalyzed reactions, irrespective of the substrates, are similar [30]. The hydrogen sulfide assays (Section 2.1.8) (Supplementary Material, Figure S4) using lead acetate demonstrated the inhibitory capacities of both O8 and P8 towards CSE catalyzed conversion of HCY [30]. Data from these experiments further confirmed the higher inhibitory ability of P8 than O8, as observed with CST as the substrate.
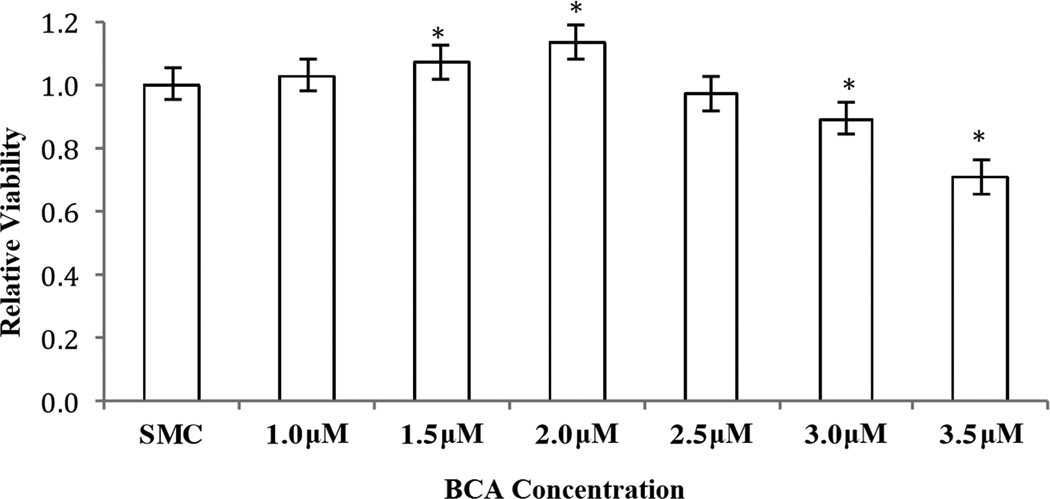
We were unsuccessful in our attempts at silencing CTH gene expression [31]. Therefore, we chose to inhibit CSE activity using β-cyano-L-alanine (BCA), a known CSE inhibitor [24], in increasing concentrations to monitor HASMC proliferation using MTT assays. Findings from these studies (Figure 7) suggest that with decreasing CSE activity, HASMC proliferation first increases and then decreases without cell death (LDH test, data not shown), the same trend observed with the O and the P families of amines under consideration.
Figure 7.
The effects of increasing concentrations of BCA on HASMC proliferation were determined by MTT assay. Absorbance was monitored at 570 nm using a micro plate reader. SMC medium, the vehicle for the BCA, served as negative control. Results are expressed as the percentage of SMC medium mean ± SE. * p <0.05 versus SMC medium.
Our understanding as to the exact mode of interaction between CSE and the two families of amines lacks certitude. We were unsuccessful in obtaining CSE crystals following literature procedures [32], which prevented us from determining the amine interactions with the CSE active site. Preliminary computational studies using Autodock Vina [33] were carried out to determine the binding affinities of O8 (−5.0 Kcal/mole) and P8 (−4.3Kcal/mole) with CSE. These values support our contention that these families of amines can interact with the active site of CSE, thereby enhancing the concentrations of HCY in a dose dependent manner. A molecular visualization system (PyMOL) was used to obtain the pictorial representations of the most stable conformations of the CSE active site with O8 and P8 (Supplementary Material, Figure S5a and S5b).
We conclude the results and discussion section with the following observations. The formation of reactive oxygen species (ROS) have been observed to accumulate following serum starvation [34]. We have previously used alkyl aryl secondary amines containing electron withdrawing groups including nitro, and both sulfone and nitro attached directly to the aromatic moiety on HASMC under serum starved conditions [2,3a]. Our findings from those studies did not indicate any possible reaction between the amines and any formed ROS. In addition, these amines did not affect the cell viability. The O and P families of amines describe herein contain similar electron withdrawing groups, namely cyano and nitro groups. ROS are typically nucleophilic in nature and the amines used in this study do not offer plausible electrophilic sites for ROS to interact with. Additionally, the nitrogen and carbon atoms of the aromatic nitro and cyano substituents respectively, are highly resistant to nucleophilic attack, except under high temperature conditions. The presence of two secondary amino groups attached directly to the benzene ring enhances the electron densities at these centers, which would further discourage nucleophilic attacks. Furthermore, as described above these isomeric amines exhibit dichotomous behavior toward HASMC proliferation. Such a trend as a consequence of ROS interaction is highly unlikely for two constitutionally isomeric families of compound with essentially identical reactivities toward ROS, if any. Moreover, CSE inhibition studies with these isomeric amines conducted in the absence of cells, starved or otherwise, indicate that the behaviors of the amines are independent of ROS.
4. Conclusions
In summary, the O and P families of amines exhibit dichotomous effects on HASMC proliferation. We have suggested a possible explanation for these intriguing results based on our experimental findings. The orientation of the secondary amine substituents with respect to the nitrile moiety plays a critical role in establishing the inhibitory capacities of the two isomeric amines towards CSE. The varied extent of CSE inhibition and the consequent differing levels of increase in HCY leads to initial excessive proliferation followed by inhibition of HASMC with increasing concentrations of O8, the weaker inhibitor of CSE. On the other hand, exposure of HASMC to increasing concentration levels of the stronger inhibitor P8, results in dose-dependent anti-proliferative effects.
Our observations raise a number of important questions. We have used the O and P amines in micromolar concentrations, based on our previous findings which indicated that NO delivery in micromolar amounts could bring about inhibition in HASMC proliferations. However, the question remains whether a dichotomy in CSE inhibition can be observed with the stronger inhibiting P family of amines at lower concentration levels (nanomolar), as was observed with the weaker inhibiting O family at micromolar concentrations. Furthermore, it is necessary to ascertain if these two isomeric families of secondary amines will exhibit inhibitory effects towards other PLP dependent enzymes including aminotransferases. These issues will be addressed in the future. If the reported amines are found to be selective inhibitors of CSE, then they may be considered as potential therapeutic agents for disease states including certain types of septic shock, and pancreatic or lung edema, where reduction of H2S production have been found to be beneficial [35]. The complex issue of the effects of NO-donors derived from these two family of amines on HASMC proliferation will be addressed in the near future.
Supplementary Material
Figure S1a: The cytotoxic effect of secondary amine P8 on HASMC was further determined by LDH assay. The amount of dead cells was measured by detecting the activity of LDH. The fluorescence was monitored at 340 nm using a micro plate reader. Results are expressed as the percentage of the 1% cDMSO control ± SE. * p <0.05 versus 1% cDMSO.
Figure S5: a) PyMOL surface fittings of O8 and b) P8 on the crystal structure of CSE with PLP.
Figure S1b: The cytotoxic effect of HCY over a wide range of concentrations (500 µM, 2mM, 4mM, and 8mM) using LDH assay. The absorbance was monitored at 340 nm using a micro plate reader. Results are expressed as the percentage of negative control mean ± SE. 1% PBS, the vehicle, served as the negative control. * p<0.05 versus 1% PBS.
Figure S2: (a) HPLC Calibration Plot of HCY, (b) HPLC Chromatogram of HASMC cell (8.1×10⁵) lysate treated with O8 (20 µM), (c) HPLC Chromatogram of HASMC cell (7.2×10⁵) lysate treated with P8 (20 µM) and (d) HPLC Chromatogram of untreated HASMC cell (7.0×10⁵) lysate.
Figure S3: Lineweaver-Burk plot of the competitively inhibited cystathionine-γ-lyase by P8
Figure S4: Lead acetate assays using varying concentrations of O8 and P8
Highlights.
Two isomeric families (O and P) of N-alkyl-N-aryl amines are reported
The O family of amines induce HASMC proliferation at low concentrations and inhibit HASMC proliferation at high concentrations
The P family of amines inhibit HASMC proliferation at all concentrations
Amines belonging to the O family inhibit cystathionine-γ-lyase to a lower extent than the P family
The O and P families of amines increase intracellular homocysteine levels to varying extents
Acknowledgments
The work was supported by the National Institute of Health (NIH) Award Number R15HL 106600 from the National Heart, Lung, and Blood Institute (NHLBI) and FRCE (Central Michigan University). We thank Professors Dale LeCaptain and Linlin Zhao for their guidance with HPLC measurements.
List of Abbreviations
- HASMC
Human aortic smooth muscle cells
- NO
Nitric oxide
- MTT
3-(4,5-dimethylthiazole-2-yl)-2,5-diphenyltetrazolium bromide
- cDMSO
Cellular grade dimethyl sulfoxide
- CST
L-Cystathionine
- HCY
L-Homocysteine
- DTNB
5,5’-Dithiobis-(2-nitrobenzoic acid)
- SBD-F
7-fluoro-2-oxa-1,3-diazole-4-sulfonic acid ammonium salt
- CSE
Cystathionine-γ-lyase
- LDH
Lactate dehydrogenase
- PLP
Pyridoxal phosphate
- CBS
Cystathionine-β-synthase
- ADMA
Asymmetric dimethylarginine
- ROS
Reactive oxygen species
- PBS
Phosphate buffered saline
- DTT
Dithiothreitol
Footnotes
Publisher's Disclaimer: This is a PDF file of an unedited manuscript that has been accepted for publication. As a service to our customers we are providing this early version of the manuscript. The manuscript will undergo copyediting, typesetting, and review of the resulting proof before it is published in its final citable form. Please note that during the production process errors may be discovered which could affect the content, and all legal disclaimers that apply to the journal pertain.
Author contributions
DKM, DEA, SJJ designed the experiments and wrote the manuscript. YJ and AB performed the experiments, NV and AB conducted the CTH gene silencing experiments and NV interpreted the data. The manuscript was edited by DKM, DEA, SJJ, NV and ARB.
References
- 1.Roe ND, Ren J. Nitric oxide synthase uncoupling: a therapeutic target in cardiovascular diseases. Vasc Pharmacol. 2012;57:168–172. doi: 10.1016/j.vph.2012.02.004. [DOI] [PubMed] [Google Scholar]
- 2.Yu H, Payne T, Mohanty DK. Effects of slow, sustained, and rate-tunable nitric oxide donors on human aortic smooth muscle cells proliferation. Chem Biol Drug Des. 2011;78:527–534. doi: 10.1111/j.1747-0285.2011.01174.x. [DOI] [PMC free article] [PubMed] [Google Scholar]
- 3.a) Curtis B, Payne TJ, Ash DE, Mohanty DK. Secondary amines containing one aromatic nitro group: preparation, nitrosation, sustained nitric oxide release, and the synergistic effects of released nitric oxide and an arginase inhibitor of vascular smooth muscle cell proliferation. Bioorg Med Chem. 2013;21:1123–1135. doi: 10.1016/j.bmc.2012.12.043. [DOI] [PMC free article] [PubMed] [Google Scholar]; b) Tsai J-C, Perrella MA, Yoshizumi M, Hsieh CM, Haber E, Schlegel R, Lee M-U. Promotion of vascular smooth muscle cell growth by homocysteine: A link to atherosclerosis. Proc Natl Acad Sci. 91:6369–6367. doi: 10.1073/pnas.91.14.6369. 19945. [DOI] [PMC free article] [PubMed] [Google Scholar]
- 4.Habeeb AFSA. Reaction of protein sulphydryl groups with Ellman’s reagent. Methods Enzymol. 1972;25C:457–464. doi: 10.1016/S0076-6879(72)25041-8. [DOI] [PubMed] [Google Scholar]
- 5.Tang L, Mamotte CDS, Von Bockxmeer FM, et al. The effect of homocysteine on DNA synthesis in cultured human vascular smooth muscle. Atherosclerosis. 1998;136:169–173. doi: 10.1016/s0021-9150(97)00208-6. [DOI] [PubMed] [Google Scholar]
- 6.Welch GN, Loscalzo J. Homocysteine and atherothrombosis. New Eng J of Med. 1998;338:1042–1052. doi: 10.1056/NEJM199804093381507. [DOI] [PubMed] [Google Scholar]
- 7.Yuan Q, Jiang DJ, Chen QQ, et al. Role of asymmetric dimethylarginine in homocysteine-induced apoptosis of vascular smooth muscle cells. Biochem Biophys Res Commun. 2007;356:880–885. doi: 10.1016/j.bbrc.2007.03.067. [DOI] [PubMed] [Google Scholar]
- 8.Lee HY, Chae IH, Kim HS, et al. Differential effects of homocysteine on porcine endothelial and vascular smooth muscle cells. J Cardiovas Pharmacol. 2002;39:643–651. doi: 10.1097/00005344-200205000-00004. [DOI] [PubMed] [Google Scholar]
- 9.Tabas I. The role of endoplasmic reticulum stress in the progression of atherosclerosis. Circ Res. 2010;107:839–850. doi: 10.1161/CIRCRESAHA.110.224766. [DOI] [PMC free article] [PubMed] [Google Scholar]
- 10.Rasmussen LM, Hansen PR, Ledet T. Homocysteine and the production of collagens, proliferation and apoptosis in human arterial smooth muscle cells. APMIS. 2004;112:598–604. doi: 10.1111/j.1600-0463.2004.apm1120907.x. [DOI] [PubMed] [Google Scholar]
- 11.Bryan S, Yang G, Wang R, et al. Cystathionine gamma-lyase-deficient smooth muscle cells exhibit redox imbalance and apoptosis under hypoxic stress conditions. Exp Clin Cardiol. 2001;16:e36–e41. [PMC free article] [PubMed] [Google Scholar]
- 12.Tsai JC, Perrella MA, Yoshizumi M, et al. Promotion of vascular smooth muscle cell growth by homocysteine: a link to atherosclerosis. Proc Natl Acad Sci. 1994;91:6369–6373. doi: 10.1073/pnas.91.14.6369. [DOI] [PMC free article] [PubMed] [Google Scholar]
- 13.Tsai JC, Wang H, Perrella MA, et al. Induction of cyclin A gene expression by homocysteine in vascular smooth muscle cells. J Clin Invest. 1996;97:146–153. doi: 10.1172/JCI118383. [DOI] [PMC free article] [PubMed] [Google Scholar]
- 14.Zou T, Yang W, Hou Z, et al. Homocysteine enhances cell proliferation in vascular smooth muscle cells: role of p38 MAPK and p47phox. Acta Biochim Biophys Sin. 2010;42:908–915. doi: 10.1093/abbs/gmq102. [DOI] [PubMed] [Google Scholar]
- 15.Chiang J, Sung M, Yu H, et al. Homocysteine induces smooth muscle cell proliferation through differential regulation of cyclins A and D1 expression. J Cell Physiol. 2010;226:1017–1026. doi: 10.1002/jcp.22415. [DOI] [PubMed] [Google Scholar]
- 16.Chen C, Halkos M, Surowiec S, et al. Effects of homocysteine on smooth muscle cell proliferation in both cell culture and artery perfusion culture models. J Surg Res. 2000;88:26–33. doi: 10.1006/jsre.1999.5756. [DOI] [PubMed] [Google Scholar]
- 17.Hernanz A, Fernández-Vivancos E, Montiel C, et al. Changes in the intracellular homocysteine and glutathione content associated with aging. Life Sci. 2000;67:1317–1324. doi: 10.1016/s0024-3205(00)00722-0. [DOI] [PubMed] [Google Scholar]
- 18.Imai K, Toyo’oka T, Watanabe Y. A novel fluorogenic reagent for thiols: ammonium 7-fluorobenzo-2-oxa-1,3-diazole-4-sulfonate. Anal Biochem. 1983;128:471–473. doi: 10.1016/0003-2697(83)90404-9. [DOI] [PubMed] [Google Scholar]
- 19.Huang Y, Lu ZY, Braun K, et al. Quantification of intracellular homocysteine by stable isotope dilution liquid chromatography/tandem mass spectrometry. Biomed Chromatogr. 2007;21:107–112. doi: 10.1002/bmc.735. [DOI] [PubMed] [Google Scholar]
- 20.Steegborn C, Clausen T, Sondermann P, et al. Kinetics and inhibition of recombinant human cystathionine gamma-lyase toward the rational control of transsulfuration. J Biol Chem. 1999;274:12675–12684. doi: 10.1074/jbc.274.18.12675. [DOI] [PubMed] [Google Scholar]
- 21.Wang Y, Jin H, Wei H, Li W, Bu D, Tang X, Ren Y, Tang C, Du J. Role of hydrogen sulfide in the development of atherosclerotic lesions in apolipoproein E knockout mice. Arterioscler Thromb Vasc Biol. 2009;29:173–179. doi: 10.1161/ATVBAHA.108.179333. [DOI] [PubMed] [Google Scholar]
- 22.Wang R. Is H2S a stinky remedy for atherosclerosis? Arterioscler Thromb Vasc Biol. 2009;29:156–157. doi: 10.1161/ATVBAHA.108.180190. [DOI] [PubMed] [Google Scholar]
- 23.Chen P, Poddar R, Tipa EV, Dibello PM, Moravec CD, Robinson K, Green R, Kruger WD, Garrow TA, Jacobsen DW. Homocysteine metabolism in cardiovascular cells and tissues: implications for hyperhomocysteinemia and cardiovascular disease. Advn Enzyme Regul 1. 9999;39:93–109. doi: 10.1016/s0065-2571(98)00029-6. [DOI] [PubMed] [Google Scholar]
- 24.Pfeffer M, Ressler C. β-cyanoalanine, an inhibitor of rat liver cystathionase. Biochem Phamacol. 1967;16:2299–2308. doi: 10.1016/0006-2952(67)90217-1. [DOI] [PubMed] [Google Scholar]
- 25.Finkelstein JD, Mudd SH, Irreverre F, et al. Deficiencies of cystathionase and homoserine dehydratase activities in cystathioninuria. Proc Nat Acad Sci. 1966;55:865–872. doi: 10.1073/pnas.55.4.865. [DOI] [PMC free article] [PubMed] [Google Scholar]
- 26.Szabo C. Roles of hydrogen sulfide in the pathogenesis of diabetes mellitus and its complications. Antiox and Redox Sig. 2012;17:68–80. doi: 10.1089/ars.2011.4451. [DOI] [PMC free article] [PubMed] [Google Scholar]
- 27.Abeles RH, Walsh CT. Acetylenic enzyme inactivators. Inactivation of γ-cystathionase, in vitro and in vivo by propargylglycine. J Am Chem Soc. 1973;95:6124–6125. doi: 10.1021/ja00799a053. [DOI] [PubMed] [Google Scholar]
- 28.Clausen T, Huber R, Messerschmidt A, et al. Slow-binding inhibition of Escherichia coli beta-lyase by L-aminoethoxyvinylglycine: a kinetic and X-ray study. Biochemistry. 1997;36:12633–12643. doi: 10.1021/bi970630m. [DOI] [PubMed] [Google Scholar]
- 29.Silverman RB, Abeles RH. Inactivation of pyridoxal phosphate dependent enzymes by mono- and polyhaloalanines. Biochemistry. 1976;15:4718–4723. doi: 10.1021/bi00666a028. [DOI] [PubMed] [Google Scholar]
- 30.Chiku T, Padovani D, Zhu W, et al. H2S biogenesis by human cystathionine γ-lyase leads to the novel sulfur metabolites lanthionine and homolanthionine and is responsive to the grade of hyperhomocysteinemia. J Biol Chem. 2009;284:11601–1112. doi: 10.1074/jbc.M808026200. [DOI] [PMC free article] [PubMed] [Google Scholar]
- 31.Yang G, Pei Y, Teng H, et al. Specificity protein-1 as a critical regulator of human cystathionine γ-lyase in smooth muscle cells. J Biol Chem. 2011;286:26450–26460. doi: 10.1074/jbc.M111.266643. [DOI] [PMC free article] [PubMed] [Google Scholar]
- 32.Sun Q, Collins R, Huang S, et al. Structural basis for the inhibition mechanism of human cystathionine γ-lyase, an enzyme responsible for the production of H2S. J Biol Chem. 2009;284:3076–3085. doi: 10.1074/jbc.M805459200. [DOI] [PubMed] [Google Scholar]
- 33.Trott O, Olson AJ. AutoDock Vina: improving the speed and accuracy of docking with a new scoring function, efficient optimization and multithreading. J Comput Chem. 2010;31:455–461. doi: 10.1002/jcc.21334. [DOI] [PMC free article] [PubMed] [Google Scholar]
- 34.Satoh T, Sakai N, Enokido Y, Uchiyama Y, Hatanaka H. Survival factor-insensitive generation of reactive oxygen species induced by serum deprivation in neuronal cells. Brain Res. 1996;733:9–14. doi: 10.1016/0006-8993(96)00527-6. [DOI] [PubMed] [Google Scholar]
- 35.Caliendo G, Cirino G, Santagada V, et al. Synthesis and biological effects of hydrogen sulfide (H2S): development of H2S-releasing drugs as pharmaceuticals. J Med Chem. 2010;53:6275–6286. doi: 10.1021/jm901638j. [DOI] [PubMed] [Google Scholar]
Associated Data
This section collects any data citations, data availability statements, or supplementary materials included in this article.
Supplementary Materials
Figure S1a: The cytotoxic effect of secondary amine P8 on HASMC was further determined by LDH assay. The amount of dead cells was measured by detecting the activity of LDH. The fluorescence was monitored at 340 nm using a micro plate reader. Results are expressed as the percentage of the 1% cDMSO control ± SE. * p <0.05 versus 1% cDMSO.
Figure S5: a) PyMOL surface fittings of O8 and b) P8 on the crystal structure of CSE with PLP.
Figure S1b: The cytotoxic effect of HCY over a wide range of concentrations (500 µM, 2mM, 4mM, and 8mM) using LDH assay. The absorbance was monitored at 340 nm using a micro plate reader. Results are expressed as the percentage of negative control mean ± SE. 1% PBS, the vehicle, served as the negative control. * p<0.05 versus 1% PBS.
Figure S2: (a) HPLC Calibration Plot of HCY, (b) HPLC Chromatogram of HASMC cell (8.1×10⁵) lysate treated with O8 (20 µM), (c) HPLC Chromatogram of HASMC cell (7.2×10⁵) lysate treated with P8 (20 µM) and (d) HPLC Chromatogram of untreated HASMC cell (7.0×10⁵) lysate.
Figure S3: Lineweaver-Burk plot of the competitively inhibited cystathionine-γ-lyase by P8
Figure S4: Lead acetate assays using varying concentrations of O8 and P8


