Abstract
Purpose
To examine if racial differences in Bruch's membrane opening-minimum rim width (BMO-MRW) in spectral domain optical coherence tomography (SDOCT) exist, specifically between people of African descent (AD) and European descent (ED) in normal ocular health.
Design
Cross-sectional study
Methods
Patients presenting for a comprehensive eye exam at retail-based primary eye clinics were enrolled based on ≥1 of the following at-risk criteria for glaucoma: AD aged ≥ 40 years, ED aged ≥50 years, diabetes, family history of glaucoma, and/or preexisting diagnosis of glaucoma. Participants with normal optic nerves on exam received SDOCT of the optic nerve head (24 radial scans). Global and regional (temporal, superotemporal, inferotemporal, nasal, superonasal, and inferonasal) BMO-MRW were measured and compared by race using generalized estimating equations. Models were adjusted for age, gender, and BMO area.
Results
SDOCT scans from 269 eyes (148 participants) were included in the analysis. Mean global BMO-MRW declined as age increased. After adjusting for age, gender, and BMO area, there was not a statistically significant difference in mean global BMO-MRW by race (P = 0.60). Regionally, the mean BMO-MRW was lower in the crude model among AD eyes in the temporal, superotemporal, and nasal regions and higher in the inferotemporal, superonasal, and inferonasal regions. However, in the adjusted model, these differences were not statistically significant.
Conclusions
BMO-MRW was not statistically different between those of AD and ED. Race-specific normative data may not be necessary for the deployment of BMO-MRW in AD patients.
Introduction
Racial variation in the susceptibility to primary open angle glaucoma (POAG) has been well-described with higher prevalence, incidence, and progression rates in people of African descent (AD).1-6 Racial differences in the anatomy of the optic nerve head (ONH), such as larger optic discs and disc area, deeper cups, variation in lamina cribrosa position, and thicker overall retinal nerve fiber layer (RNFL) and peripapillary choroid thicknesses in AD individuals, have also been previously described.3,7-17 While these differences may have pathophysiologic significance, they also affect implementation of imaging-based biomarkers for the detection of POAG.
Recently, a novel neuroretinal rim parameter, based on the minimum rim width from Bruch's membrane opening to the neuroretinal surface (BMO-MRW), has demonstrated much greater effectiveness in evaluating the ONH for glaucoma than other optic disc margin measurements such as cup-to-disc ratio and rim area.18-29 However, these preliminary BMO-MRW studies that generated normative databases have generally been performed in populations of European descent (ED). As the BMO-MRW parameter becomes more widely implemented in spectral-domain optical coherence tomography (SDOCT) through automated algorithms, it becomes necessary to understand how this parameter is affected by race. The purpose of this study is to determine if BMO-MRW varies with race, specifically across people of AD and ED, and how BMO-MRW relates to retinal nerve fiber layer (RNFL) thickness.
Methods
This cross-sectional study utilized SDOCT data obtained as part of the Eye Care Quality and Accessibility Improvement in the Community (EQUALITY) demonstration telemedicine program.30 The EQUALITY study protocol has been previously published and is briefly described below.30 The Institutional Review Board of the University of Alabama at Birmingham (UAB) approved the study protocol prior to its start and issued a waiver of informed consent since study procedures were usual care. HIPAA compliance was maintained throughout the study.
EQUALITY study participants received a comprehensive eye exam by an optometrist including medical history, visual acuity with walk-in and best correction, refraction, color vision, applanation tonometry, pachymetry, undilated slit lamp anterior segment examination, undilated gonioscopy, and dilated fundus examination. ONH imaging of both eyes included SDOCT by the Spectralis (Heidelberg Engineering, Heidelberg, Germany), stereophotography, and automated visual field testing with Swedish interactive thresholding algorithm (SITA) 24-2.
Inclusion/exclusion criteria
Participants in EQUALITY were recruited from new or existing patients presenting for a comprehensive eye exam at one of two retail-based primary eye care clinics (Walmart Vision Centers). Patients were eligible if they met any of the following criteria: (1) AD ≥ 40 years old, (2) ED ≥ 50 years old, (3) persons of any age or race/ethnicity with diabetes, (4) persons of any age or race/ethnicity with a self-reported glaucoma associated diagnosis (GAD) (glaucoma suspect, ocular hypertension, and POAG), and (5) persons with a self-reported family history of POAG. Race was defined by self-report. For the current analysis, we only included participants from the EQUALITY study whom had normal eye examinations without evidence of GAD as assessed by the optometrist performing the exam. Thus the current study sample focuses on nonglaucomatous patients seeking eye care in a community-based retail setting.
SDOCT Image Acquisition, Processing and Quantification
The ONH, peripapillary RNFL thickness, and macula were imaged with the Spectralis SDOCT with prototype software (Heyex VV, Heidelberg Engineering, Heidelberg, Germany). The software's Automated Anatomic Positioning System used two anatomic landmarks, the BMO and fovea, which are fixed in location relative to each other, in order to define the horizontal and vertical axes of the eye. These landmarks were used to identify the reference for the scans, the fovea-to-BMO (FoBMO) axis. The BMOMRW scan pattern contained 24 radial B-scans spaced 15° apart and centered on the ONH. The RNFL thickness was measured using circular peripapillary scans of 768 A-scans with circles of diameter 3.5 mm, 4.1 mm, and 4.7 mm and subtending 12°, 14°, and 16°, respectively. All orientations were relat ive to the FoBMO axis. Refraction, including sphere and cylinder in diopters, was entered into the instrument software to ensure accuracy.
The software segmented the 48 BMO points from the 24 radial B-scans as well as the internal limiting membrane automatically. The segmentations were manually verified in each B-scan and corrected as needed. The BMO-MRW parameters were calculated as follows and similar to the method described elsewhere.21 BMO points in each B-scan were identified and the shortest distance from the BMO point to the internal limiting membrane was calculated, resulting in 48 values per eye. A closed curve was derived from a spline fitted to the BMO points around the ONH. The global BMO-MRW value as well as the four 40° (superotemporal, inferotempora l, superonasal, and inferonasal), one 90° (temporal) and one 110° (nasal) regional BMO-MR W values were calculated. The global and regional peripapillary RNFL thickness values were also calculated based on circular peripapillary scans. Results are presented from the standard ONH and 3.5 mm diameter, subtending 12°, RNFL thickness scans.
Statistical Analysis
The unit of analysis was the eye and eyes with SDOCT images of insufficient quality (B-scans where the internal limiting membrane was not segmented or the BMO center was misaligned) were excluded. Generalized estimating equations were created to compare global and regional SDOCT measurements of BMO-MRW and RNFL thickness by race. Models were adjusted for age, gender, and BMO area. Spherical equivalent was not associated with race in the crude analysis and was thus not included in the adjusted models. Finally, an interaction term was added to the model to assess if the association between race and SDOCT measurements were different by age. Spearman correlations were used to assess the relationship between BMO-MRW and RNFL thickness stratified by race.
Results
Table 1 presents the demographic and ocular characteristics for the 269 SDOCT scans included in the analysis. SDOCT scans of insufficient quality as defined above were excluded, which resulted in 18 omitted scans. Overall, the AD eyes (n = 153) were from younger participants compared to ED eyes (n = 116), with a mean (SD) age of 52.3 (9.8) years in AD eyes and 57.9 (10.8) years in ED eyes (P = 0.0016). More of the AD eyes were from female participants, 79.7% (n = 122), compared to 54.3% (n = 63) of ED eyes (P = 0.0016). BMO area was larger in AD than ED eyes by 0.3 mm2 (P < 0.0001). The spherical equivalent of the study eyes was not statistically different by race (P = 0.26). The mean (SD) image quality score for the SDOCT scans was 30.3 (3.1) on the Spectralis’ scale of 0-40, similar for both AD and ED eyes.
Table 1.
Demographic and ocular characteristics of Eye Care Quality and Accessibility Improvement in the Community spectral domain optical coherence tomography scans (N=269)
| Characteristic | AD n=153 | ED n=116 | P-value |
|---|---|---|---|
| Age, mean years (SD) | 52.3 (9.8) | 57.9 (10.8) | 0.0016 |
| Gender, n (%) female | 122 (79.7) | 63 (54.3) | 0.0016 |
| BMO Area, mean mm2 (SD) | 2.0 (0.4) | 1.8 (0.3) | < 0.0001 |
| Spherical Equivalent, mean Diopters (SD) | 3.1 (0.4) | 2.9 (1.2) | 0.26 |
Abbreviations: SD, Standard deviation; AD, African descent; ED, European descent; BMO Area, Bruch's membrane opening area; mm, Millimeters.
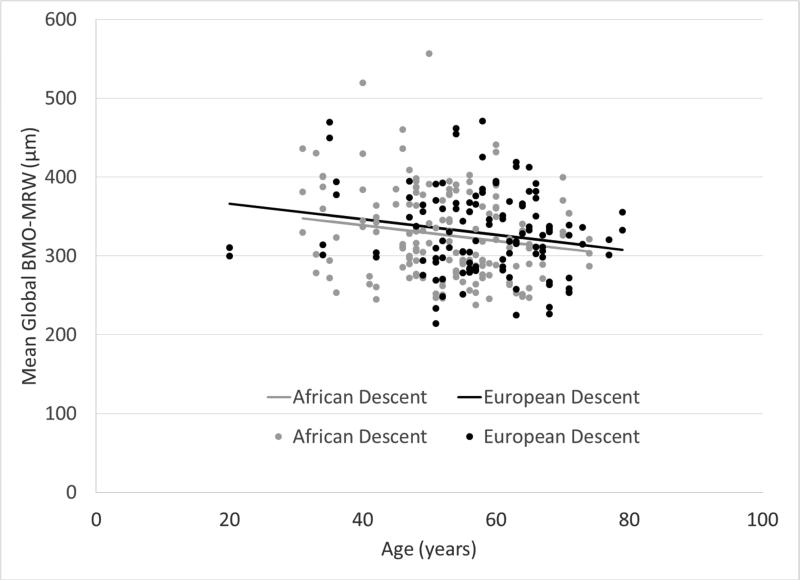
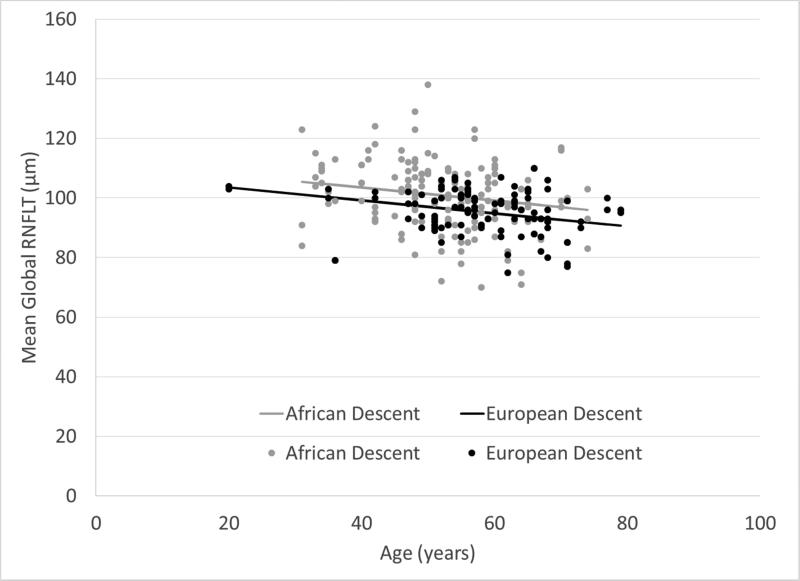
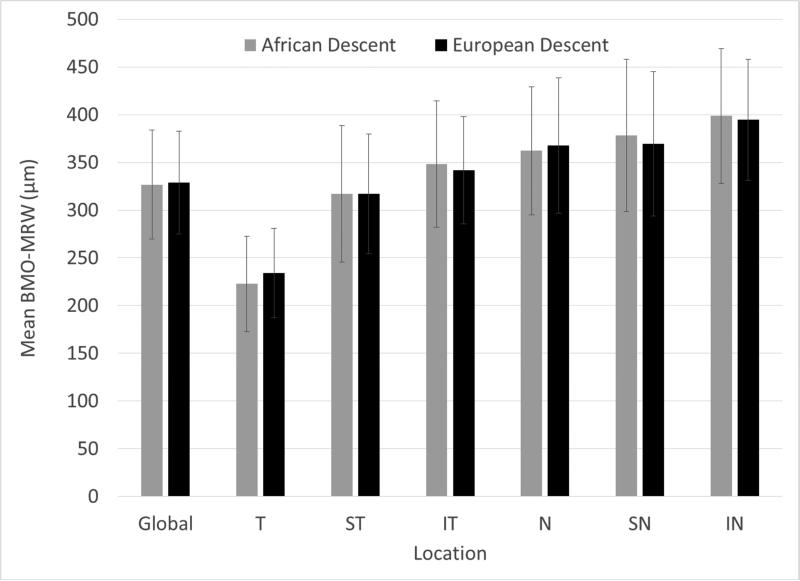
Figures 1 and 2 show that mean global BMO-MRW and RNFL thickness declined as age increased. Global RNFL thickness was significantly higher in AD compared to ED eyes (P = 0.0059), but there was not a statistically significant difference in BMO-MRW by race (P = 0.40). Figure 3 shows that global and sectoral BMO-MRW measurements between races were similar.
Figure 1.
Mean global BMO-MRW (Bruch's membrane opening-minimum rim width) decreases with age in subjects of both African descent and European descent.
Figure 2.
Mean global RNFLT (retinal nerve fiber layer thickness) decreases with age in subjects of both African descent and European descent.
Figure 3.
Mean (±SD) global and regional Bruch's membrane opening-minimum rim width (BMO-MRW) in micrometers does not vary by race. (T, Temporal; ST, Superotemporal; IT, Inferotemporal; N, Nasal; SN, Superonasal; IN, Inferonasal.)
In the crude analysis, the mean global BMO-MRW was approximately 2.3 μm lower in AD compared to ED eyes; however, this difference was not statistically significant after adjusting for age, gender, and BMO area (P = 0.60) (Table 2). Regionally, the mean BMO-MRW was lower in the crude model among AD eyes in the temporal, superotemporal, and nasal regions and higher in the inferotemporal, superonasal, and inferonasal regions. However, in the adjusted model, these differences were not statistically significant.
Table 2.
Crude and adjusted models comparing Bruch's membrane opening-minimum rim width (BMO-MRW) global and regional measurements (μm) by race
| BMO-MRW Region | Crude | Adjusteda | |
|---|---|---|---|
| Parameter (SE) | Parameter (SE) | P-value | |
| Global | −2.3 (9.0) | 5.2 (9.8) | 0.60 |
| Temporal | −11.1 (7.7) | −8.0 (8.4) | 0.34 |
| Superotemporal | −0.05 (10.4) | 0.6 (11.7) | 0.96 |
| Inferotemporal | 6.7 (9.5) | 6.9 (10.6) | 0.51 |
| Nasal | −5.6 (11.3) | 9.5 (11.9) | 0.43 |
| Superonasal | 8.9 (12.1) | 16.5 (13.4) | 0.22 |
| Inferonasal | 4.2 (10.6) | 14.5 (12.1) | 0.23 |
Note: European descent is the referent group. Adjusteda includes the variables age, gender, and Bruch's membrane opening area. N=1 missing scan in African descent group, N=5 missing scans in European descent group.
Abbreviations: μm, Micrometers; SE, Standard Error.
Overall, mean global RNFL thickness values were higher in AD than ED eyes; however, this difference was not statistically significant in the adjusted model (P = 0.12) (Table 3). Regionally, RNFL thickness values were lower among AD eyes in the temporal and superotemporal regions and higher in the nasal, inferotemporal, inferonasal, and superonasal regions, with the largest differences in the latter two. After adjusting for age, gender, and BMO area, significant differences in RNFL thickness persisted in the temporal, superotemporal, superonasal, and inferonasal regions between AD and ED eyes (Table 3). The interaction term of age and race was not significant in any of the models.
Table 3.
Crude and adjusted models comparing retinal nerve fiber layer thickness (RNFLT) global and regional measurements (μm) by race
| RNFLT Region | Crude | Adjusteda | |
|---|---|---|---|
| Parameter (SE) | Parameter (SE) | P-value | |
| Global | 5.7 (1.5) | 2.7 (1.7) | 0.12 |
| Temporal | −2.8 (1.7) | −4.4 (1.9) | 0.024 |
| Superotemporal | −6.4 (3.4) | −11.8 (3.6) | 0.0010 |
| Inferotemporal | 6.4 (3.2) | 1.8 (3.7) | 0.63 |
| Nasal | 5.5 (2.0) | 3.4 (2.2) | 0.12 |
| Superonasal | 24.4 (3.6) | 21.4 (4.0) | < 0.0001 |
| Inferonasal | 18.2 (3.4) | 13.5 (3.9) | 0.0006 |
Note: European descent is the referent group. Adjusteda includes the variables age, gender, and Bruch's membrane opening area. N=1 missing scan in African descent group, N=5 missing scans in European descent group.
Abbreviations: μm, Micrometers; SE, Standard Error.
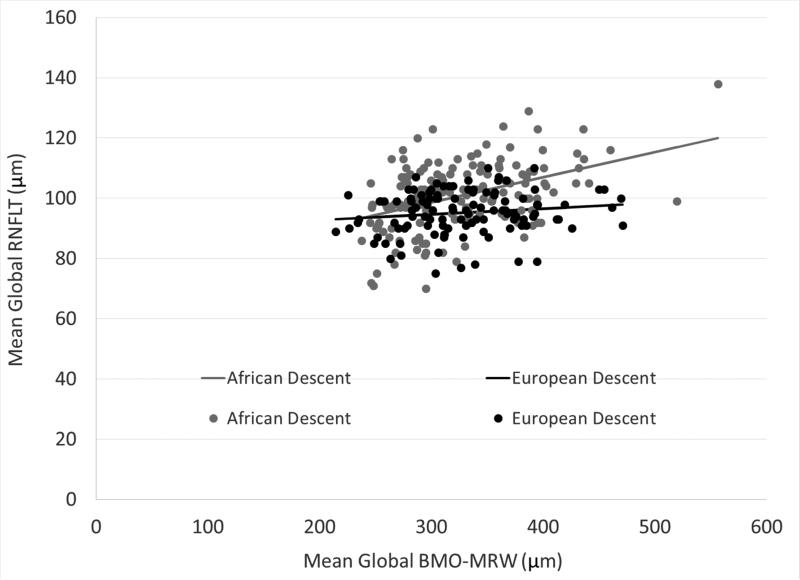
There was a positive correlation between mean global BMO-MRW and RNFL thickness among AD and ED eyes, but the strength of the correlation varied by race (Figure 4) (AD: rho = 0.42, P < 0.0001; ED: rho = 0.14, P = 0.14). The BMO-MRW values in the AD group were restricted to those less than 500 μm in case the wider range of values was driving the correlation but the pattern persisted. After adjusting for age, there was minimal change to the strength of the partial correlation (AD: rho = 0.39, P < 0.0001; ED: rho = 0.12, P = 0.23).
Figure 4.
A positive correlation exists between mean global BMO-MRW (Bruch's membrane opening-minimum rim width) and mean global RNFLT (retinal nerve fiber layer thickness) that varies by race.
Discussion
In the current study, BMO-MRW did not vary by race among AD and ED groups in non-glaucomatous eyes. However, RNFL thickness showed significant differences across racial groups, specifically with a lower RNFL thickness in AD eyes in areas of the ONH thought to be more affected in early glaucomatous injury. While there was a significant correlation between BMO-MRW and RNFL thickness similar to findings by Chauhan et al.28, the correlation varied by race, with a stronger correlation among the AD group than ED group. Current normative databases used in the analysis of SDOCT scans of the ONH were initially created using data from a majority ED population.28 This study suggests that an AD race-specific normative database utilizing BMO-MRW may not be necessary since BMO-MRW did not vary across the two races. Additionally, the more complex SDOCT scanning protocols used in this study, performed in a retail-based community setting by a technician with minimal training, demonstrated high mean image quality scores indicating that this approach can be practically deployed in these settings.
Our results showing age-related decline in both BMO-MRW and RNFL thickness unrelated to race are consistent with several previous studies.12,28,31 The thinner temporal RNFL in the AD group also corresponds to results by Girkin et al. showing a thinner temporal RNFL, macula, and macular retinal ganglion cell layer in AD groups.12
A strength of this study is the large sample size including a large number of AD participants, not adequately represented in previous studies on BMO-MRW. Limitations of the study are also acknowledged. While BMO-MRW was analyzed across AD and ED racial groups, further analysis is needed in other racial groups. Another limitation is that the definition of normal eyes in this study did not require participants to demonstrate a normal visual field. Since the study was performed in a retail-based community setting under usual care, it was not feasible to perform a visual field on every EQUALITY study participant. If there had been a large amount of glaucomatous eyes that were unrecognized on the optometrist's exam, the results would likely have shown greater variability in the BMO-MRW and RNFL thickness than was found.
In summary, this study demonstrated that while RNFL thickness differs significantly between racial groups (AD vs. ED), BMO-MRW does not. Given the prior work demonstrating improved diagnostic efficacy using the BMO-MRW approach, this implies that race-specific normative data using BMO-MRW with respect to the AD and ED populations may not be needed to apply this approach to the at-risk AD populations for disease detection.
Acknowledgements
a. Funding/Support: This work was supported by a cooperative agreement with the Centers for Disease Control and Prevention (#1U58DP004061) and a National Eye Institute grant (1K23EY025724-01A1), with supplemental support from the EyeSight Foundation of Alabama, Birmingham, AL, and Research to Prevent Blindness, New York, NY.
c. Other Acknowledgments: None.
Footnotes
Publisher's Disclaimer: This is a PDF file of an unedited manuscript that has been accepted for publication. As a service to our customers we are providing this early version of the manuscript. The manuscript will undergo copyediting, typesetting, and review of the resulting proof before it is published in its final citable form. Please note that during the production process errors may be discovered which could affect the content, and all legal disclaimers that apply to the journal pertain.
b. Financial Disclosures: The authors report no financial disclosures.
References
- 1.Sommer A, Tielsch JM, Katz J, et al. Racial differences in the cause-specific prevalence of blindness in east Baltimore. N Engl J Med. 1991 Nov 14;325(20):1412–1417. doi: 10.1056/NEJM199111143252004. [DOI] [PubMed] [Google Scholar]
- 2.Tielsch JM, Sommer A, Katz J, Royall RM, Quigley HA, Javitt J. Racial variations in the prevalence of primary open-angle glaucoma. The Baltimore Eye Survey. JAMA. 1991 Jul 17;266(3):369–374. [PubMed] [Google Scholar]
- 3.Varma R, Tielsch JM, Quigley HA, et al. Race-, age-, gender-, and refractive error-related differences in the normal optic disc. Arch Ophthalmol. 1994 Aug;112(8):1068–1076. doi: 10.1001/archopht.1994.01090200074026. [DOI] [PubMed] [Google Scholar]
- 4.Sommer A. Glaucoma risk factors observed in the Baltimore Eye Survey. Curr Opin Ophthalmol. 1996 Apr;7(2):93–98. doi: 10.1097/00055735-199604000-00016. [DOI] [PubMed] [Google Scholar]
- 5.Friedman DS, Wolfs RC, O'Colmain BJ, et al. Prevalence of open-angle glaucoma among adults in the United States. Arch Ophthalmol. 2004;122:532–538. doi: 10.1001/archopht.122.4.532. [DOI] [PMC free article] [PubMed] [Google Scholar]
- 6.Hoffmann EM, Zangwill LM, Crowston JG, Weinreb RN. Optic disk size and glaucoma. Surv Ophthalmol. 2007 Jan-Feb;52(1):32–49. doi: 10.1016/j.survophthal.2006.10.002. [DOI] [PMC free article] [PubMed] [Google Scholar]
- 7.Beck RW, Messner DK, Musch DC, Martonyi CL, Lichter PR. Is there a racial difference in physiologic cup size? Ophthalmology. 1985 Jul;92(7):873–876. doi: 10.1016/s0161-6420(85)33942-8. [DOI] [PubMed] [Google Scholar]
- 8.Chi T, Ritch R, Stickler D, Pitman B, Tsai C, Hsieh FY. Racial differences in optic nerve head parameters. Arch Ophthalmol. 1989 Jun;107(6):836–839. doi: 10.1001/archopht.1989.01070010858029. [DOI] [PubMed] [Google Scholar]
- 9.Dandona L, Quigley HA, Brown AE, Enger C. Quantitative regional structure of the normal human lamina cribrosa. A racial comparison. Arch Ophthalmol. 1990 Mar;108(3):393–398. doi: 10.1001/archopht.1990.01070050091039. [DOI] [PubMed] [Google Scholar]
- 10.Quigley HA, Brown AE, Morrison JD, Drance SM. The size and shape of the optic disc in normal human eyes. Arch Ophthalmol. 1990 Jan;108(1):51–57. doi: 10.1001/archopht.1990.01070030057028. [DOI] [PubMed] [Google Scholar]
- 11.Budenz DL, Anderson DR, Varma R, et al. Determinants of normal retinal nerve fiber layer thickness measured by Stratus OCT. Ophthalmology. 2007 Jun;114(6):1046–1052. doi: 10.1016/j.ophtha.2006.08.046. [DOI] [PMC free article] [PubMed] [Google Scholar]
- 12.Girkin CA, Sample PA, Liebmann JM, et al. African Descent and Glaucoma Evaluation Study (ADAGES): II. Ancestry differences in optic disc, retinal nerve fiber layer, and macular structure in healthy subjects. Arch Ophthalmol. 2010 May;128(5):541–550. doi: 10.1001/archophthalmol.2010.49. [DOI] [PMC free article] [PubMed] [Google Scholar]
- 13.Girkin CA, McGwin G, Jr., Sinai MJ, et al. Variation in optic nerve and macular structure with age and race with spectral-domain optical coherence tomography. Ophthalmology. 2011 Dec;118(12):2403–2408. doi: 10.1016/j.ophtha.2011.06.013. [DOI] [PubMed] [Google Scholar]
- 14.Rhodes LA, Huisingh C, Johnstone J, et al. Variation of laminar depth in normal eyes with age and race. Invest Ophthalmol Vis Sci. 2014 Dec;55(12):8123–8133. doi: 10.1167/iovs.14-15251. [DOI] [PMC free article] [PubMed] [Google Scholar]
- 15.Rhodes LA, Huisingh C, Johnstone J, et al. Peripapillary choroidal thickness variation with age and race in normal eyes. Invest Ophthalmol Vis Sci. 2015 Mar;56(3):1872–1879. doi: 10.1167/iovs.14-16179. [DOI] [PMC free article] [PubMed] [Google Scholar]
- 16.Knight OJ, Girkin CA, Budenz DL, Durbin MK, Feuer WJ, Cirrus OCTNDSG Effect of race, age, and axial length on optic nerve head parameters and retinal nerve fiber layer thickness measured by Cirrus HD-OCT. Arch Ophthalmol. 2012 Mar;130(3):312–318. doi: 10.1001/archopthalmol.2011.1576. [DOI] [PMC free article] [PubMed] [Google Scholar]
- 17.Tsai CS, Zangwill L, Gonzalez C, et al. Ethnic differences in optic nerve head topography. J Glaucoma. 1995 Aug;4(4):248–257. [PubMed] [Google Scholar]
- 18.Povazay B, Hofer B, Hermann B, et al. Minimum distance mapping using three-dimensional optical coherence tomography for glaucoma diagnosis. J Biomed Opt. 2007 Jul-Aug;12(4):041204. doi: 10.1117/1.2773736. [DOI] [PubMed] [Google Scholar]
- 19.Chen TC. Spectral domain optical coherence tomography in glaucoma: qualitative and quantitative analysis of the optic nerve head and retinal nerve fiber layer (an AOS thesis). Trans Am Ophthalmol Soc. 2009 Dec;107:254–281. [PMC free article] [PubMed] [Google Scholar]
- 20.Strouthidis NG, Fortune B, Yang H, Sigal IA, Burgoyne CF. Longitudinal change detected by spectral domain optical coherence tomography in the optic nerve head and peripapillary retina in experimental glaucoma. Invest Ophthalmol Vis Sci. 2011 Mar;52(3):1206–1219. doi: 10.1167/iovs.10-5599. [DOI] [PMC free article] [PubMed] [Google Scholar]
- 21.Reis AS, O'Leary N, Yang H, et al. Influence of clinically invisible, but optical coherence tomography detected, optic disc margin anatomy on neuroretinal rim evaluation. Invest Ophthalmol Vis Sci. 2012 Apr;53(4):1852–1860. doi: 10.1167/iovs.11-9309. [DOI] [PMC free article] [PubMed] [Google Scholar]
- 22.Reis AS, Sharpe GP, Yang H, Nicolela MT, Burgoyne CF, Chauhan BC. Optic disc margin anatomy in patients with glaucoma and normal controls with spectral domain optical coherence tomography. Ophthalmology. 2012 Apr;119(4):738–747. doi: 10.1016/j.ophtha.2011.09.054. [DOI] [PMC free article] [PubMed] [Google Scholar]
- 23.Chauhan BC, O'Leary N, Almobarak FA, et al. Enhanced detection of open-angle glaucoma with an anatomically accurate optical coherence tomography-derived neuroretinal rim parameter. Ophthalmology. 2013 Mar;120(3):535–543. doi: 10.1016/j.ophtha.2012.09.055. [DOI] [PMC free article] [PubMed] [Google Scholar]
- 24.Chauhan BC, Burgoyne CF. From clinical examination of the optic disc to clinical assessment of the optic nerve head: a paradigm change. Am J Ophthalmol. 2013 Aug;156(2):218–227. e212. doi: 10.1016/j.ajo.2013.04.016. [DOI] [PMC free article] [PubMed] [Google Scholar]
- 25.Gardiner SK, Ren R, Yang H, Fortune B, Burgoyne CF, Demirel S. A method to estimate the amount of neuroretinal rim tissue in glaucoma: comparison with current methods for measuring rim area. Am J Ophthalmol. 2014 Mar;157(3):540–549. e541–542. doi: 10.1016/j.ajo.2013.11.007. [DOI] [PMC free article] [PubMed] [Google Scholar]
- 26.Mizumoto K, Gosho M, Zako M. Correlation between optic nerve head structural parameters and glaucomatous visual field indices. Clin Ophthalmol. 2014;8:1203–1208. doi: 10.2147/OPTH.S62521. [DOI] [PMC free article] [PubMed] [Google Scholar]
- 27.Pollet-Villard F, Chiquet C, Romanet JP, Noel C, Aptel F. Structure-function relationships with spectral-domain optical coherence tomography retinal nerve fiber layer and optic nerve head measurements. Invest Ophthalmol Vis Sci. 2014 May;55(5):2953–2962. doi: 10.1167/iovs.13-13482. [DOI] [PubMed] [Google Scholar]
- 28.Chauhan BC, Danthurebandara VM, Sharpe GP, et al. Bruch's Membrane Opening Minimum Rim Width and Retinal Nerve Fiber Layer Thickness in a Normal White Population: A Multicenter Study. Ophthalmology. 2015 Sep;122(9):1786–1794. doi: 10.1016/j.ophtha.2015.06.001. [DOI] [PMC free article] [PubMed] [Google Scholar]
- 29.Danthurebandara VM, Sharpe GP, Hutchison DM, et al. Enhanced structure-function relationship in glaucoma with an anatomically and geometrically accurate neuroretinal rim measurement. Invest Ophthalmol Vis Sci. 2015 Jan;56(1):98–105. doi: 10.1167/iovs.14-15375. [DOI] [PubMed] [Google Scholar]
- 30.Owsley C, Rhodes LA, McGwin G, Jr., et al. Eye Care Quality and Accessibility Improvement in the Community (EQUALITY) for adults at risk for glaucoma: study rationale and design. Int J Equity Health. 2015;14(1):135. doi: 10.1186/s12939-015-0213-8. [DOI] [PMC free article] [PubMed] [Google Scholar]
- 31.Leung CK, Yu M, Weinreb RN, et al. Retinal nerve fiber layer imaging with spectral-domain optical coherence tomography: a prospective analysis of age-related loss. Ophthalmology. 2012 Apr;119(4):731–737. doi: 10.1016/j.ophtha.2011.10.010. [DOI] [PubMed] [Google Scholar]


