
Fig. 1.
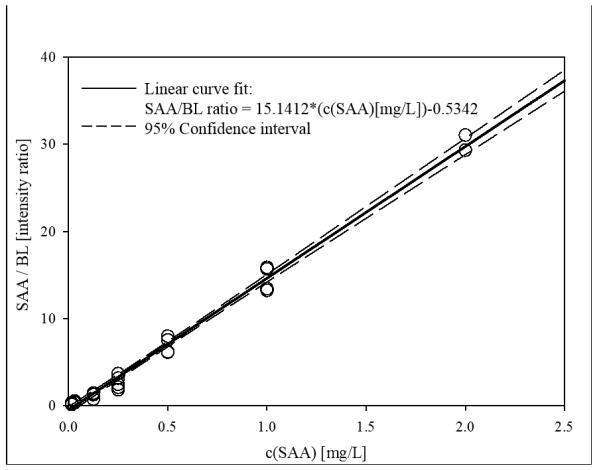
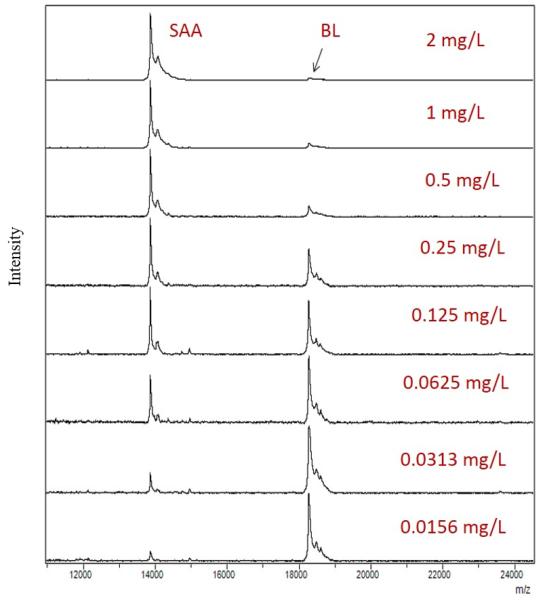
a) Example SAA standard curve with BL as an IRS; b) Representative mass spectra from generated standard curve, showing peaks for SAA and BL in different SAA concentrations.
Official websites use .gov
A
.gov website belongs to an official
government organization in the United States.
Secure .gov websites use HTTPS
A lock (
) or https:// means you've safely
connected to the .gov website. Share sensitive
information only on official, secure websites.
a) Example SAA standard curve with BL as an IRS; b) Representative mass spectra from generated standard curve, showing peaks for SAA and BL in different SAA concentrations.