

Abstract
Summary
Most RNA molecules form internal base pairs, leading to a folded secondary structure. Some of these structures have been demonstrated to be functionally significant. High-throughput RNA structure chemical probing methods generate millions of sequencing reads to provide structural constraints for RNA secondary structure prediction. At present, processed data from these experiments are difficult to access without computational expertise. Here we present FoldAtlas, a web interface for accessing raw and processed structural data across thousands of transcripts. FoldAtlas allows a researcher to easily locate, view, and retrieve probing data for a given RNA molecule. We also provide in silico and in vivo secondary structure predictions for comparison, visualized in the browser as circle plots and topology diagrams. Data currently integrated into FoldAtlas are from a new high-depth Structure-seq data analysis in Arabidopsis thaliana, released with this work.
Availability and Implementation
The FoldAtlas website can be accessed at www.foldatlas.com. Source code is freely available at github.com/mnori/foldatlas under the MIT license. Raw reads data are available under the NCBI SRA accession SRP066985.
Supplementary information
Supplementary data are available at Bioinformatics online.
1 Introduction
RNA structure plays an important role in all steps of gene expression and regulation (Mortimer et al., 2014; Sharp, 2009). Earlier studies inferred the secondary structures of individual RNA sequences using low throughput in vitro probing or in silico prediction approaches. More recently, genome-wide in vivo structure probing methods have emerged, allowing structures to be determined across the transcriptomes of living cells (Ding et al., 2014; Rouskin et al., 2014; Spitale et al., 2015; Talkish et al., 2014; Tang et al., 2015).
Chemical probing methods can be used to determine RNA secondary structure in living cells (Kwok et al., 2013; McGinnis and Weeks, 2014; Spitale et al., 2013). These methods include dimethyl sulfate (DMS) probing and selective 2'-hydroxyl acylation analyzed by primer extension (SHAPE). In DMS probing, the N1 position of adenine and the N3 position of cytosine are methylated when the base is not involved in Watson–Crick base pairing. In SHAPE, all unpaired bases are modified.
Chemically modified bases lead to stalling of reverse transcriptase. With reverse transcription, PCR, deep sequencing and normalization, reactivities can be assigned to individual RNA sequence positions. These reactivities describe the extent of exposure of a nucleotide to solution, and can be exploited as pseudo-free energy constraints for RNA secondary structure prediction. At present, raw and processed reactivity data are hard to access without computational expertise.
Here we introduce FoldAtlas, a repository and web interface for accessing genome-scale RNA structure probing data. We also provide visualization of data-constrained RNA structures across the genome. The data included with FoldAtlas are from a new high-depth Structure-seq DMS analysis in Arabidopsis thaliana, covering over 11 000 transcripts.
2 Results
FoldAtlas allows a researcher without computational expertise to select a transcript of interest and retrieve its corresponding raw and processed structure probing data, along with pre-generated RNA structure predictions. FoldAtlas is the first tool that provides this functionality across the genome. When a transcript is selected and loaded, the d3nome genome browser (Fig. 1A) released with this work, displays the splicing configuration of the selected transcript, along with alternative splice isoforms, where relevant. An overview of the normalized chemical reactivities (Fig. 1B) is also shown, which can be expanded to show detailed nucleotide-resolution chemical reactivities. The reactivities are generated as described in the Supplementary Results section of the Supplementary Material. Tab delimited text files containing normalized chemical reactivities are available for download. We also provide corresponding raw read termination counts from 3 independent biological replicates, allowing the significance of structure probing data to be estimated by assigning errors to reactivities.
Fig. 1.
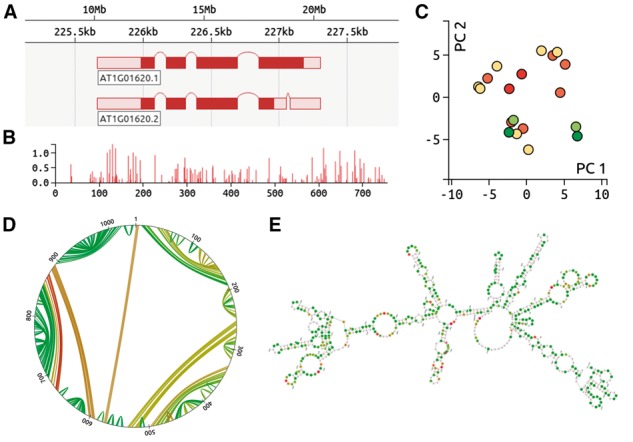
(A) d3nome genome browser, indicating splice isoforms. (B) Normalized reactivities. The sequence position is shown on the x axis, whilst the y axis provides the normalized reactivity value. (C) Principal components analysis, indicating structural similarity. Each dot represents a single RNA structure prediction, with red dots indicating the lowest free energies. Structures with similar base pair configurations are plotted in close proximity to each other. (D) Circle plot describing a single RNA structure prediction. Sequence positions are indicated around the edge of the plot, with lines between positions indicating base pairs. Green lines indicate high base pair probability. (E) RNA fold prediction diagram. Bases with high reactivities are in red, whilst green indicates little or no reactivity
For each transcript, we include the 20 lowest free energy unconstrained in silico and data-constrained in vivo structures generated by using the Fold program, from version 5.7 of the RNAstructure package (Reuter and Mathews, 2010), with default slope and intercept parameters of 1.8 and -0.6 kcal/mol respectively. The structure prediction set includes the MFE structure alongside suboptimal low free energy structures. Differences and similarities between these structures are visualized using a Principal Components Analysis (PCA) view (Fig. 1C). PCA plots were generated using a previously described method (Halvorsen et al., 2010). Each structure can also be visualized using both circle plots (Fig. 1D) and structure diagrams (Fig. 1E) generated using the ViennaRNA package (Hofacker, 2013; Kerpedjiev et al., 2015, Lorenz et al., 2011). The corresponding MFE structures can be downloaded as tab-delimited text files.
The FoldAtlas chemical reactivity data are from a DMS chemical modification experiment in Arabidopsis thaliana. These data were generated by using a previously established Structure-seq method (Ding et al., 2014, 2015), but with two rounds of poly-A selection to enrich the proportion of mRNA. Detailed analysis of this experiment is provided in the Supplementary Results section of the Supplementary Material.
3 Conclusions and future work
FoldAtlas provides convenient access to in vivo RNA structure probing data across thousands of transcripts. The current release, 1.1, includes data from a high depth genome-scale probing experiment in Arabidopsis thaliana. To predict structure for a transcript, we generated up to 20 secondary structures using the RNAstructure Fold tool, and visualized the structure ensemble using PCA plots. In this work, our preference to use RNAstructure is due to the ability to specify experimental constraints, and is consistent with the approach taken in our earlier work (Ding et al., 2014). In future versions of FoldAtlas, we plan to also provide options to visualize structure predictions made using other methods, including SeqFold (Ouyang et al., 2013), and Vienna RNAfold, which now allows experimental constraints (Lorenz et al., 2011, 2015). We are also considering including SHAPE probing data, in vitro data, reactivities calculated using alternative normalization methods, data from other organisms, and data from other studies.
Supplementary Material
Acknowledgements
This research was supported in part by the NBIP Computing infrastructure for Science (CiS) group through the provision of a High Performance Computing Cluster.
Funding
This work was supported by the Biotechnology and Biological Sciences Research Council (BBSRC) [BB/L025000/1 to M.N. and Y.D. and BB/N022572/1 to M.N. Y.D and S.A.]; and the National Institutes of Health [HG006860 to S.A.].
Conflict of Interest: none declared.
References
- Ding Y. et al. (2014) In vivo genome-wide profiling of RNA secondary structure reveals novel regulatory features. Nature, 505, 696–700. [DOI] [PubMed] [Google Scholar]
- Ding Y. et al. (2015) Genome-wide profiling of in vivo RNA structure at single-nucleotide resolution using structure-seq. Nat. Protoc., 10, 1050–1066. [DOI] [PubMed] [Google Scholar]
- Halvorsen M. et al. (2010) Disease-associated mutations that alter the RNA structural ensemble. PLoS Genet., 6, e1001074. [DOI] [PMC free article] [PubMed] [Google Scholar]
- Hofacker I.L. (2003) Vienna RNA secondary structure server. Nucleic Acids Res., 31, 3429–3431. [DOI] [PMC free article] [PubMed] [Google Scholar]
- Kerpedjiev P. et al. (2015) Forna (force-directed RNA): simple and effective online RNA secondary structure diagrams. Bioinformatics, 31, 3377–3379. [DOI] [PMC free article] [PubMed] [Google Scholar]
- Kwok C.K. et al. (2013) Determination of in vivo RNA structure in low-abundance transcripts. Nat. Commun., 4, 2971. [DOI] [PubMed] [Google Scholar]
- Lorenz R. et al. (2011) ViennaRNA package 2.0. Algorithms Mol. Biol., 6, 26. [DOI] [PMC free article] [PubMed] [Google Scholar]
- Lorenz R. et al. (2015) SHAPE directed RNA folding. Bioinformatics, btv523. [DOI] [PMC free article] [PubMed] [Google Scholar]
- McGinnis J.L., Weeks K.M. (2014) Ribosome RNA assembly intermediates visualized in living cells. Biochemistry, 53, 3237–3247. [DOI] [PMC free article] [PubMed] [Google Scholar]
- Mortimer S.A. et al. (2014) Insights into RNA structure and function from genome-wide studies. Nat. Rev. Genet., 15, 469–479. [DOI] [PubMed] [Google Scholar]
- Ouyang et al. (2013) SeqFold: genome-scale reconstruction of RNA secondary structure integrating high-throughput sequencing data. Genome Res., 23, 377–387. [DOI] [PMC free article] [PubMed] [Google Scholar]
- Reuter J.S., Mathews D.H. (2010) RNAstructure: software for RNA secondary structure prediction and analysis. BMC Bioinformatics, 11, 129. [DOI] [PMC free article] [PubMed] [Google Scholar]
- Rouskin S. et al. (2014) Genome-wide probing of RNA structure reveals active unfolding of mRNA structures in vivo. Nature, 505, 701–705. [DOI] [PMC free article] [PubMed] [Google Scholar]
- Sharp P.A. (2009) The centrality of RNA. Cell, 136, 577–580. [DOI] [PubMed] [Google Scholar]
- Spitale R.C. et al. (2013) RNA SHAPE analysis in living cells. Nat. Chem. Biol., 9, 18–20. [DOI] [PMC free article] [PubMed] [Google Scholar]
- Spitale R.C. et al. (2015) Structural imprints in vivo decode RNA regulatory mechanisms. Nature, 519, 486–490. [DOI] [PMC free article] [PubMed] [Google Scholar]
- Talkish J. et al. (2014) Mod-seq: high-throughput sequencing for chemical probing of RNA structure. RNA, 20, 713–720. [DOI] [PMC free article] [PubMed] [Google Scholar]
- Tang Y. et al. (2015) StructureFold: genome-wide RNA secondary structure mapping and reconstruction in vivo. Bioinformatics, 31, 2668–2675. [DOI] [PMC free article] [PubMed] [Google Scholar]
Associated Data
This section collects any data citations, data availability statements, or supplementary materials included in this article.