Significance
Understanding the mechanisms by which the immune system and local microorganisms coexist in the oral cavity is important, as disruption of this delicate balance could cause oral and systemic diseases. We revealed that growth arrest specific 6 (GAS6), a ligand of the TYRO3–AXL–MERTK signaling system, plays a critical role in this process. Upon birth, microorganisms residing in the oral cavity induce expression of GAS6 in oral tissues; GAS6 in turn regulates antibacterial function in these tissues. We also found that GAS6 expressed by cells of the immune system further contributes to its regulatory role in oral tissues. Collectively, this work proposes that GAS6 restrains the immune response in the oral cavity to maintain coexistence with favorable microorganisms residing within the oral cavity.
Keywords: oral mucosa, GAS6, TAM, homeostasis, microbiota
Abstract
The oral epithelium contributes to innate immunity and oral mucosal homeostasis, which is critical for preventing local inflammation and the associated adverse systemic conditions. Nevertheless, the mechanisms by which the oral epithelium maintains homeostasis are poorly understood. Here, we studied the role of growth arrest specific 6 (GAS6), a ligand of the TYRO3–AXL–MERTK (TAM) receptor family, in regulating oral mucosal homeostasis. Expression of GAS6 was restricted to the outer layers of the oral epithelium. In contrast to protein S, the other TAM ligand, which was constitutively expressed postnatally, expression of GAS6 initiated only 3–4 wk after birth. Further analysis revealed that GAS6 expression was induced by the oral microbiota in a myeloid differentiation primary response gene 88 (MyD88)-dependent fashion. Mice lacking GAS6 presented higher levels of inflammatory cytokines, elevated frequencies of neutrophils, and up-regulated activity of enzymes, generating reactive nitrogen species. We also found an imbalance in Th17/Treg ratio known to control tissue homeostasis, as Gas6-deficient dendritic cells preferentially secreted IL-6 and induced Th17 cells. As a result of this immunological shift, a significant microbial dysbiosis was observed in Gas6−/− mice, because anaerobic bacteria largely expanded by using inflammatory byproducts for anaerobic respiration. Using chimeric mice, we found a critical role for GAS6 in epithelial cells in maintaining oral homeostasis, whereas its absence in hematopoietic cells synergized the level of dysbiosis. We thus propose GAS6 as a key immunological regulator of host–commensal interactions in the oral epithelium.
The stratified epithelium covering the oral mucosa is continuously challenged by an immense amount of diverse microorganisms, some of which might be pathogenic. Emerging evidence suggests that mucosal epithelial cells in simple epithelial tissues, such as in the intestine and lung, are an essential component of a communications network. As such, they transmit and receive signals from cells in the underlying mucosal layers, which are critical to coordinate homeostatic and inflammatory functions (1, 2). Oral epithelial cells were also found to respond to various microbial challenges and to produce proinflammatory and antimicrobial molecules (3, 4). Therefore, the stratified oral epithelium not only forms a physical barrier to oral microorganisms, but actively participates in inducing immunity, thus providing an immunological barrier. Nevertheless, whereas much attention was given in recent years to study oral mucosal immunity in a setting of infection or immunization, less attention was given to mechanisms engaged by the oral mucosa to maintain homeostasis. Perhaps the most challenging role in this regard is the task of the gingival epithelium, which monitors biofilm development on the tooth surface. The teeth represent the only hard tissue in our body exposed to the hostile external environment, and bacteria colonize tooth enamel and adjacent soft tissues to form a persistent and chronic biofilm (5). An excessive inflammatory response against the oral biofilm results in periodontal diseases, and can facilitate intravascular dissemination of microorganisms throughout the body that is associated with adverse systemic conditions (6). Therefore, understanding the immune mechanisms engaged by the oral mucosal epithelium to maintain immunological homeostasis is of major importance for human health.
Maintaining immune homeostasis is an active and complex process requiring vast interplays among hematopoietic and nonhematopoietic cells such as epithelial cells. Recently, the TAM receptors: TYRO3, AXL, and MERTK and their ligands: growth arrest-specific 6 (GAS6) and protein S (PROS1) were shown to play a critical role in the resolution of inflammation (7). This is achieved by the ability of TAM signaling to down-regulate innate inflammatory responses, mediate efferocytosis, and restore vascular integrity (8). Despite the high structural homology between GAS6 and PROS1, both ligands have distinct affinities to the TAM receptors and are also differentially expressed in various cell types (9). Furthermore, whereas the functions of GAS6 seem to be limited to those caused by activation of the TAM receptors, PROS1 has TAM receptor-dependent and independent activities (8, 10–12). In line with their discrete properties, GAS6 and PROS1 were shown to control distinct immune mechanisms in vitro and in vivo (7).
Due to the aforementioned function of TAM signaling, we envisaged that TAM receptors and their cognate ligands might be expressed in the oral mucosa and could play a role in regulating mucosal immunity. Indeed, we revealed that expression of GAS6 in the oral epithelium is induced by oral microbiota and plays a critical role in maintaining immunological and microbial oral homeostasis. We thus propose a fundamental role for GAS6 in regulating host–commensal interactions in the oral mucosa.
Results
Expression of GAS6 and PROS1 in the Oral Mucosa.
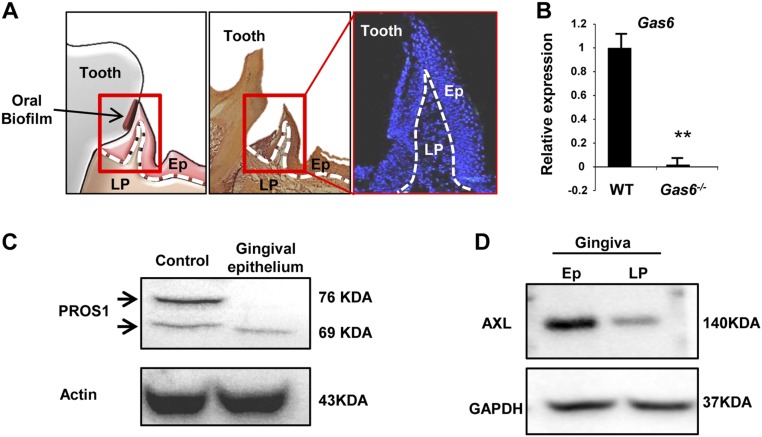
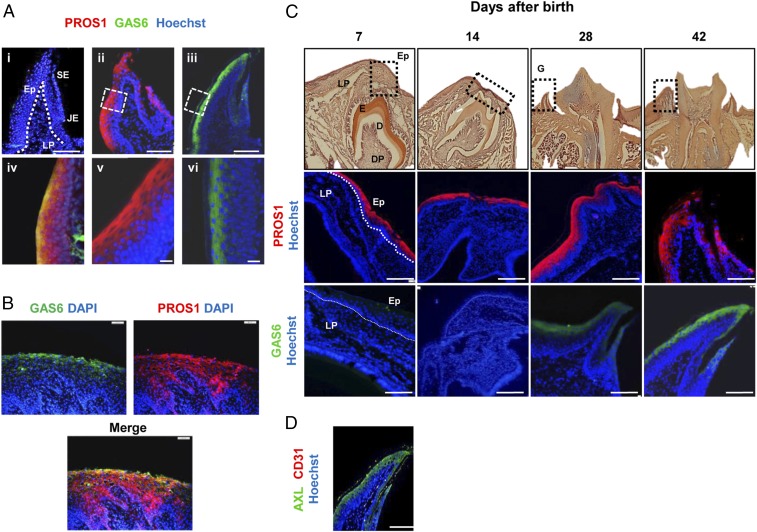
We first sought to characterize expression of the two TAM ligands in the oral mucosa. The gingiva represents the tissue surrounding and monitoring the oral biofilm (Fig. S1A), and thus we analyzed expression of these ligands in gingival cross-sections. Expression of GAS6 and PROS1 was mainly observed in the gingival epithelium, as demonstrated by immunofluorescence, real-time PCR and Western blot analyses (Fig. 1A and Fig. S1 B and C). Within the epithelium, GAS6 was detected only in the most peripheral epithelial layers, whereas PROS1 was also expressed in deeper layers of the epithelium. In line with these observations, colocalization of both ligands was observed in the external layers of the epithelium (Fig. 1A, iv). Importantly, similar expression patterns of GAS6 and PROS1 were also observed in human gingival tissues (Fig. 1B). Because the gingiva is not completely developed until the teeth are erupted, a process occurring in mice between the second and third weeks of life, we next assessed expression kinetics from birth to adulthood. As depicted in Fig. 1C, GAS6 and PROS1 displayed distinct expression dynamics. Whereas PROS1 was constitutively expressed after birth, GAS6 was detected in the epithelium only after the teeth eruption, ∼3–4 wk after birth. Studies have shown that among the three TAM receptors, GAS6 binds to AXL with highest affinity in vivo (13), thus we next assessed expression of AXL in the gingiva. Similar to GAS6 expression, AXL was mainly expressed in the peripheral layers of the oral epithelium (Fig. 1D and Fig. S1D). Taken together, our data demonstrate that whereas both TAM ligands, GAS6 and PROS1, are expressed in the oral epithelium, they have distinct kinetics and pattern of expression in mice and also in human. Furthermore, the similar expression pattern of AXL and GAS6 in the epithelium suggests that GAS6 might act via AXL in the oral mucosa.
Fig. S1.
Additional validations for expression of GAS6, PROS1, and AXL in the murine gingiva. (A) Schematic presentation (Left), H&E (Center), and outline of nuclei (Right) stainings of gingival cross-sections demarcating the epithelium (Ep) and lamina propria (LP) by dotted lines. (B) Quantification of Gas6 expression in the gingiva by RT-qPCR in WT and Gas6−/− mice. (C) Western blot analysis showing the presence of PROS1 in the gingival epithelium and lamina propria. PROS1-expressing cell line was used as a positive control. Representative data of one of two independent experiments are shown. (D) Western blot analysis showing the presence of AXL in the gingival epithelium and lamina propria. Representative data of one of two independent experiments are shown.
Fig. 1.
Expression profiles of GAS6, PROS1, and AXL in the oral mucosa. (A) Gingival cross-sections of adult B6 mice were stained with antibodies against GAS6 (green), PROS1 (red), and Hoechst (nuclei, blue) for immunofluorescence analysis. (i) No primary antibody control, (ii and v) PROS1, (iii and vi) GAS6, and (iv) colocalization of GAS6 and PROS1. Representative images of at least six independent experiments are shown. (Scale bars, 50 µm.) (B) Gingival cross-sections of human gingival tissues were stained with antibodies against GAS6 (green), PROS1 (red), and DAPI (nuclei, blue) for immunofluorescence analysis. (Scale bars, 200 µm.) (C) Gingival tissues were harvested at different time points after birth for H&E and immunofluorescence analysis: PROS1 (red), GAS6 (green), and Hoechst (blue). Representative images of two independent experiments are shown (n = 12). (Scale bars, 50 µm.) (D) Immunofluorescence analysis of gingival cross-sections of adult B6 mice stained with antibodies against AXL (green) and Hoechst (nuclei, blue). Representative images of at least five independent experiments are shown (n = 10). (Scale bars, 50 µm.) Ep, epithelium; LP, lamina propria; SE, sulcular epithelium; JE, junctional epithelium. E, enamel; D, dentin; and DP, dental papilla.
Expression of GAS6 in the Epithelium Is Induced by Oral Commensals.
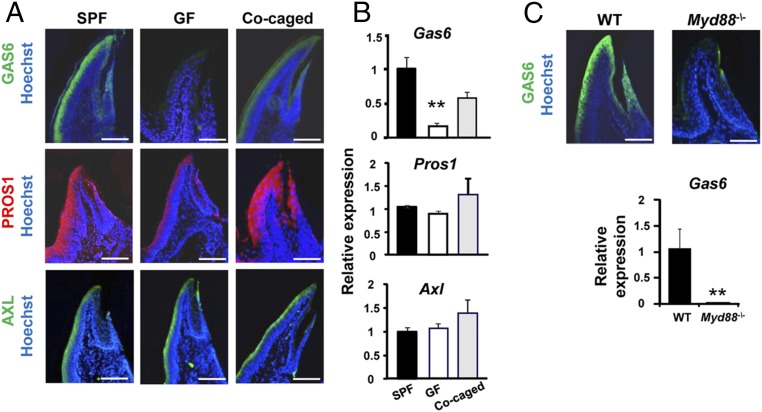
During the first weeks after birth, the murine oral microbiota undergoes dramatic changes, as the mice are weaned and the biofilm starts to develop on the newly erupted teeth (14). We thus hypothesized that expression of GAS6 in the oral epithelium might be induced by such microbial changes. To address this issue, we examined expression of GAS6 in the gingival epithelium of germ-free (GF) mice by immunofluorescence and RT-quantitative PCR (RT-qPCR). Age- and sex-matched adult male Swiss Webster mice housed under GF or specific pathogen-free (SPF) conditions were analyzed. In contrast to SPF mice, GAS6 was not expressed in the gingiva of GF mice (Fig. 2 A and B). Colonization of GF mice with bacteria following cocaging with SPF mice for 2 mo restored GAS6 expression, though not to similar levels as in SPF mice. We next assessed expression of PROS1 in GF mice and found that PROS1 was not significantly altered by bacterial colonization in these mice. Similarly, expression of AXL was not affected by the presence or absence of the oral microbiota (Fig. 2 A and B). To examine whether the induction of GAS6 expression by oral bacteria involves recognition via Toll-like receptor (TLR) signaling, we analyzed mice lacking myeloid differentiation primary response gene 88 (MyD88), a molecule mediating intracellular signaling of most TLRs. As demonstrated in Fig. 2C, GAS6 expression was abolished in Myd88−/− mice that were house in SPF conditions, as demonstrated by immunofluorescence and RT-qPCR analyses. These data suggest that oral microbiota induces expression of GAS6 in the gingival epithelium in a MYD88-dependent signaling pathway.
Fig. 2.
GAS6 expression is induced by oral microbiota in a MYD88-dependent fashion. (A) Gingival cross-sections from adult Swiss Webster SPF mice, germ-free mice (GF), and GF mice cocaged with SPF mice for 2 mo, stained with antibodies against PROS1 (red), GAS6 (green), AXL (green), and Hoechst (blue). (Scale bars, 50 µm.) (B) RT-qPCR analysis quantifying expression of PROS1, GAS6, and AXL in the gingiva of the noted mice. Data indicate the relative expression levels of the noted gene among SPF, GF, and cocaged mice and represent the mean of five mice ± SEM. Representative data of one of two independent experiments are shown. (C) Gingival cross-sections from B6 and Myd88−/− mice stained with antibody against GAS6 (green) and Hoechst (blue). (Scale bars, 50 µm.) Bar graph illustrates levels of Gas6 expression in B6 and Myd88−/− mice and represent the mean of three mice ± SEM. Representative data of one of two independent experiments are shown.
GAS6 Regulates Oral Mucosal Immunity at Steady State.
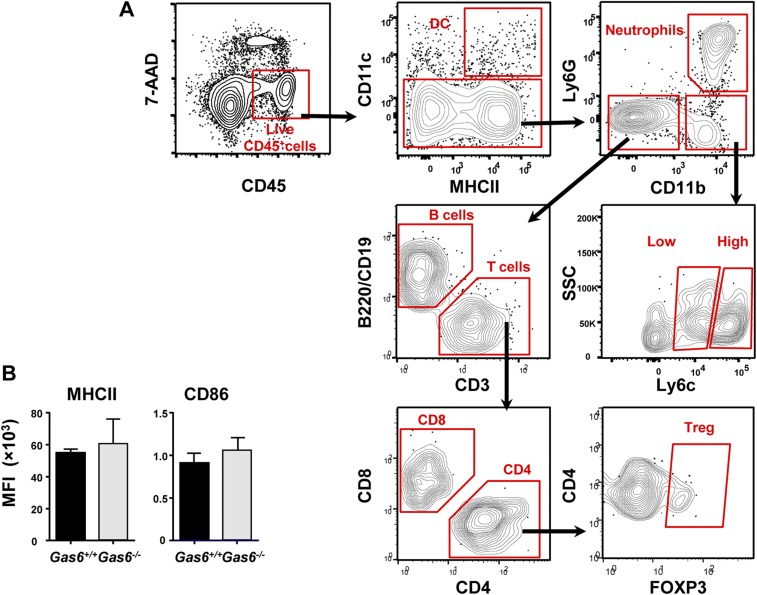
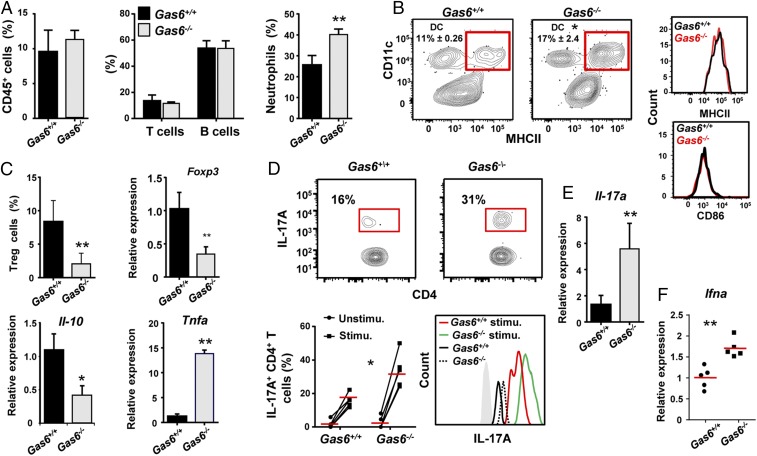
Induction of GAS6 expression in the epithelium by oral microbiota might indicate that GAS6 regulates mucosal immune responses to the colonizing bacteria. We thus examined how the absence of GAS6 impacts oral mucosal immunity in Gas6+/+ and Gas6−/− littermate controls. Using flow cytometry analysis (gating strategies are provided in Fig. S2A), we first found similar numbers of total leukocytes, T and B lymphocytes in the gingiva of adult Gas6−/− and Gas6+/+ mice maintained under SPF conditions (Fig. 3A). Nevertheless, compared with Gas6+/+ mice, Gas6−/− mice have elevated numbers of neutrophils (CD45+CD11b+Ly6G+ cells) (Fig. 3A). A significant increase in the frequencies of gingival dendritic cells (DCs) (CD45+CD11c+MHCII+ cells) was also detected in Gas6−/− mice. However, their activation state, based on MHCII and CD86 expression levels, was not significantly altered due to the absence of GAS6 (Fig. 3B and Fig. S2B). We next focused our analysis on T regulatory (Treg) and Th17 cells, which are known to have a critical role in tissue homeostasis (15). As illustrated in Fig. 3C, the frequencies of FOXP3+ CD4+ T cells were significantly higher in the gingiva of Gas6+/+ in comparison with Gas6−/− mice. Using RT-qPCR, we also found elevated levels of Foxp3 mRNA in the gingiva of Gas6+/+ relative to Gas6−/− mice. We then quantified mRNA levels of IL-10 and TNF-α in the gingiva, and concurring with our results, IL-10 was highly expressed in Gas6+/+ mice, whereas TNF-α was predominantly expressed in Gas6−/− mice (Fig. 3C). To quantify the frequencies of Th17 in the gingiva, gingival cells were isolated, stimulated with phorbol 12-myristate 13-acetate (PMA)/ionomycin and IL-17A+ CD4+ T cells were identified by intracellular cytokine staining (ICS). As demonstrated in Fig. 3D, the gingiva of Gas6−/− mice contained significantly higher percentages of IL-17A-producing CD4+ T cells than Gas6+/+ mice. Furthermore, the amount of IL-17A per cell was higher in gingival CD4+ T cells of Gas6−/− compared with Gas6+/+ mice. In line with these findings, we also found in the gingiva of Gas6−/− mice higher levels of IL-17A and IFN-α mRNA, the latter known, even at low expression levels, to shape tonic signals by modulating cytokine expression and therefore regulating tissue homeostasis (Fig. 3 E and F) (16). Collectively, these results indicate that the lack of GAS6 resulted in an increased inflammatory milieu in the oral mucosa.
Fig. S2.
Characterization of gingival immune cells at steady state. (A) Gating strategy to identify various immune cells in the gingival mucosa following exclusion of dead cells using 7-AAD. (B) Bar graphs illustrating the MFI of MHCII and CD86 on gingival DCs in Gas6+/+ and Gas6−/− mice (n = 5) at steady state.
Fig. 3.
Elevated inflammatory milieu in the gingiva of Gas6−/− mice at steady state. (A–C) Gingival tissues of adult naive Gas6+/+ and Gas6−/− littermate controls were processed and analyzed by flow cytometry. (A) Frequencies of total CD45+ leukocytes, T and B lymphocytes, and neutrophils. (B, Left) Representative FACS plots demonstrating the presence of DCs (CD11c+MHCII+) in the gingiva of each group; numbers indicate the percentages of DCs from CD45+ cells. (Right) Representative histogram plots showing expression levels of MHCII and CD86 on DCs. (C) Frequencies of Treg cells in the gingiva, and relative mRNA expression levels of Foxp3, Il-10, and Tnf-a quantified by RT-qPCR on total gingival tissues. Data represent the mean of five mice ± SEM. Representative data of one of three independent experiments are shown. (D) IL-17A expression produced in CD4+ T cells was determined by ICS from gingival cells prepared from naive and PMA/ionomycin-stimulated Gas6+/+ and Gas6−/− mice. Representative FACS plots and graphs demonstrate the frequencies of IL-17A+ CD4+ T cells in Gas6+/+ and Gas6−/− mice, as well as the intensity of IL-17A expression. Data represent the mean of five mice ± SEM. Representative data from one of three independent experiments are shown. (E and F) Bar graph depicts the relative mRNA levels of Il-17a (E) and Ifna (F) in the whole gingiva using RT-qPCR and represents the mean of five mice ± SEM. Representative data of one of three independent experiments are shown.
Gas6−/− DCs Preferentially Induce Th17 Rather than Treg Cells.
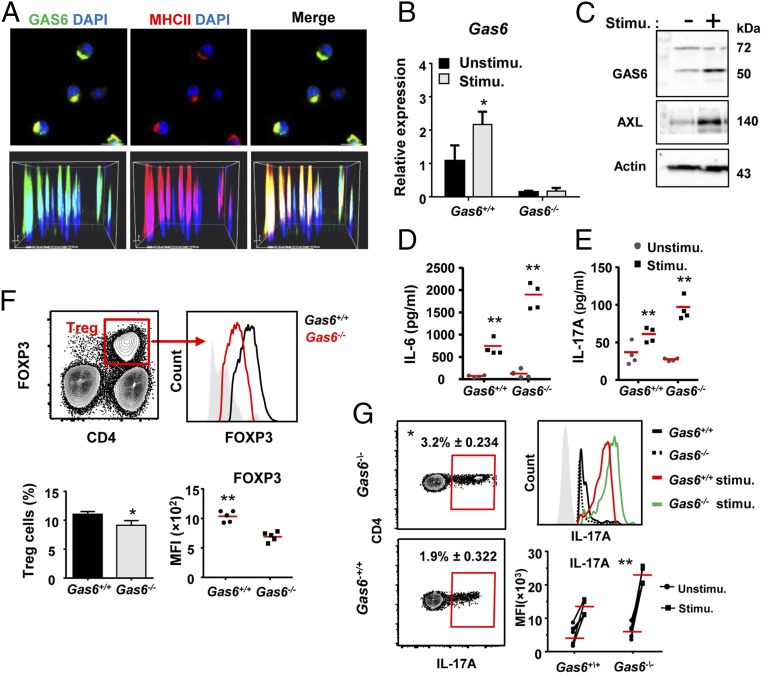
As T-cell polarization is executed by DCs, we next analyzed the impact of GAS6 on the capacity of DCs to stimulate T cells. First, we examined whether GAS6 is expressed in DCs by performing immunofluorescence analysis on MHCIIhighCD11c+ cells sorted from the oral mucosa-draining lymph nodes (LNs) of Gas6+/+ mice. GAS6 was clearly identified in DCs, and appeared to colocalize with the MHCII molecule in the cytoplasm (Fig. 4A). The presence of GAS6 in DCs was also found in bone-marrow–generated DCs (BMDCs) using RT-qPCR and Western blot analyses (Fig. 4 B and C). Expression of GAS6 as well as its receptor AXL were up-regulated in BDMCs upon stimulation with LPS (Fig. 4 B and C). Furthermore, stimulated Gas6−/− BMDCs secreted higher levels of IL-6 compared with Gas6+/+ BMDCs, a cytokine known to be involved in Th17/Treg polarization (Fig. 4D). Such secretion was able to promote ex vivo the differentiation of naive OT-II CD4+ T cells into IL-17A secreting cells upon coculturing and stimulation with LPS and the OVA223–239 peptide (Fig. 4E).
Fig. 4.
Expression of GAS6 in DCs alters the polarization of Treg and Th17 cells. (A) Immunofluorescence analysis of DCs (MHCII+CD11c+ cells) sorted from cervical LNs of Gas6+/+ mice, fixed on slides and stained with antibodies against GAS6 (green), MHCII (red), and Hoechst (blue). (Scale bar, 10 µm.) (Lower) Superimposed Z stacks of the stained DCs. (B) Quantification by RT-qPCR of GAS6 expression levels in BMDCs prepared from Gas6+/+ and Gas6−/− mice stimulated or not with LPS. Data represent the mean of five mice per group ± SEM. Representative data of one of two independent experiments are shown. (C) Western blot analysis showing the presence of GAS6 and AXL in Gas6+/+ BMDCs, either with or without LPS stimulation. (D) Concentration of IL-6 (quantified by ELISA) secreted by Gas6+/+ or Gas6−/− BMDC cultured with or without LPS stimulation; data represent the mean of five replicates ± SEM. (E) IL-17A concentrations quantified by ELISA in the supernatant of Gas6+/+ or Gas6−/− BDMCs cocultured with OT-II CD4+ T cells and stimulated with LPS and OVA223–239 peptide. Data represent the mean of five replicates ± SEM. Representative data of one of two to three independent experiments are shown. (F) Cervical LN cells were collected from Gas6+/+ and Gas6−/− mice and analyzed by flow cytometry. Representative FACS plots and graphs demonstrate the frequencies of Treg cells and mean fluorescence intensity (MFI) of FOXP3 in Treg cells. Data represent the mean of five mice ± SEM. Representative data of one of two independent experiments are shown. (G) Cervical LN cells were collected from Gas6+/+ and Gas6−/− mice, stimulated with PMA/ionomycin, and analyzed by ICS. Representative FACS plots and graphs demonstrate the frequencies of IL-17A+ CD4+ T cells, and the MFI of IL-17A in these cells. Data represent the mean of five mice ± SEM. Representative data of one of two independent experiments are shown.
Because polarization of T cells occurs in the LNs by DCs migrating from the tissue, we analyzed Treg and Th17 cells in the oral-mucosa–draining LNs. Parallel to the gingiva, Gas6−/− mice have slightly reduced frequencies of Tregs in the LNs (Fig. 4F). Furthermore, the amount of FOXP3 expressed per cell was significantly reduced in Gas6−/− mice in comparison with Gas6+/+ mice (Fig. 4F). Such a reduction in cellular FOXP3 levels was shown previously to severely impair Treg capability to regulate immunity (17). In contrast to Tregs, Th17 cells, identified by ICS on PMA/ionomycin-stimulated LN cells, were significantly higher in Gas6−/− mice compared with Gas6+/+ mice (Fig. 4G). Akin to the gingiva, the amount of IL-17A per cell was considerably higher in Gas6−/− mice. Altogether, these data indicate that in the absence of GAS6, Treg/Th17 balance is skewed toward Th17 cells, leading to an increased inflammatory milieu in the oral mucosa at steady state. GAS6 thus plays a critical regulatory role in maintaining immunological homeostasis in the oral mucosa.
The Absence of GAS6 Alters the Load and Diversity of Oral Microbiota.
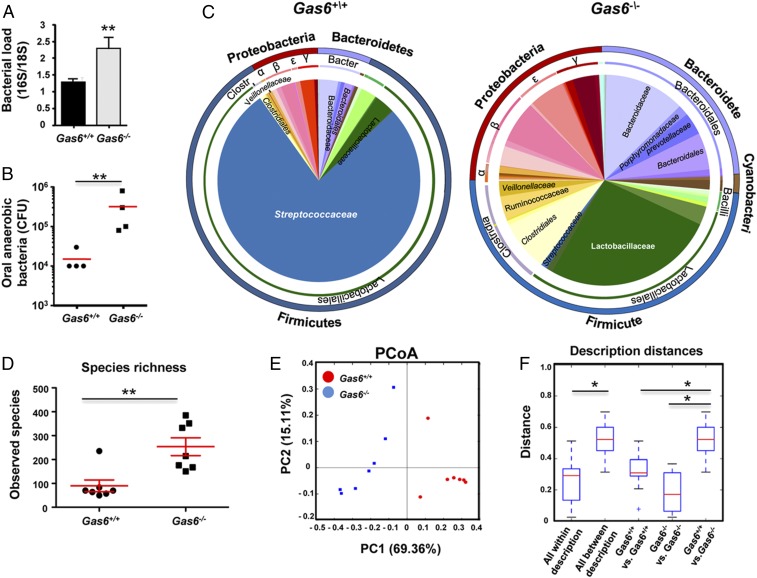
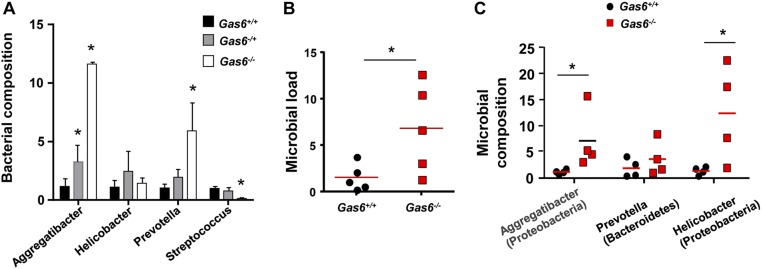
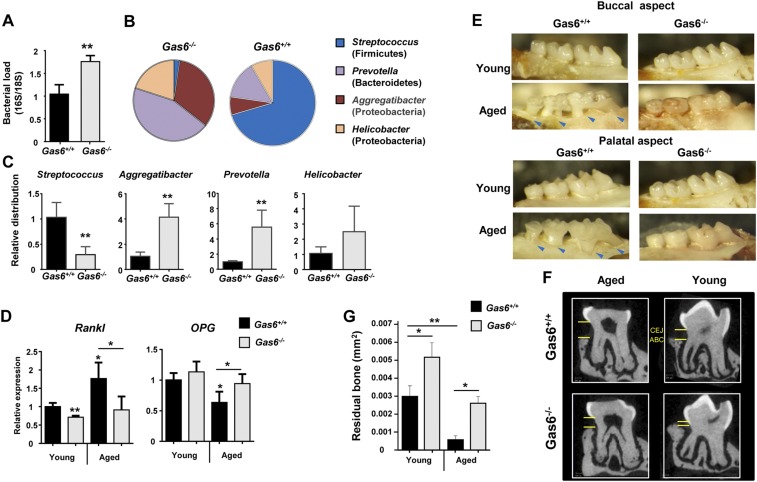
We next sought to examine whether the absence of GAS6 would also have an impact on the oral microbiota. For this purpose, littermate controls of Gas6+/+ and Gas6−/− mice were used. We first sampled bacteria using oral swabs from the oral cavity of individual age- and sex-matched Gas6−/− and Gas6+/+ littermates born and housed under identical conditions. DNA was then extracted and the ratio of ribosomal 16S/18S genes was quantified to compare the microbial load in these mice. As demonstrated in Fig. 5A, the oral cavity of Gas6−/− mice sheltered an overall elevated bacterial load, about twofold higher, compared with Gas6+/+ mice. We further compared the load of oral anaerobic bacteria in these mice, by plating oral swab samples on blood agar under anaerobic conditions. A considerable elevation of about 1.2 logs in the load of cultivated anaerobic bacteria was found in Gas6−/− mice in comparison with Gas6+/+ mice (Fig. 5B). To test whether changes in the oral microbial load of Gas6−/− mice affects bacterial diversity, we performed a taxonomic analysis of the oral microbiota. As depicted in Fig. 5C, the absence of GAS6 led to a considerable shift in oral microbiota composition. Whereas the oral mucosa of Gas6+/+ mice was mainly colonized by bacteria of the Firmicutes phylum, Gas6−/− mice contained three main phyla: Firmicutes, Proteobacteria, and Bacteriodetes. Moreover, the presence of Streptococcaceae (Firmicutes), representing the most common bacterial family in Gas6+/+ mice, was drastically reduced in Gas6−/− mice, whereas other families of this phylum such as Lactobacillaceae and Clostridiaceae, were largely expanded (Fig. 5C). Alpha diversity analysis clearly confirmed the higher taxa richness in Gas6−/− mice compared with Gas6+/+ mice (P = 0.005) (Fig. 5D). Moreover, the taxa present in these mice varied significantly as indicated by a weighted beta diversity and distance analyses (Fig. 5 E and F). We also tested Gas6−/+ (heterozygous) mice for oral bacterial composition using specific primers against certain bacterial families largely altered in our system. Partial alterations of the examined bacterial families were found, suggesting that expression of GAS6 from two alleles might be required for maintaining microbial homeostasis (Fig. S3A). It should be mentioned that the microbial dysbiosis was not limited to the oral mucosa, as we also found an increase of total bacteria in feces of Gas6−/− mice accompanied by an expansion of certain bacterial families (Fig. S3 B and C).
Fig. 5.
Expansion of anaerobic bacteria in oral mucosa of Gas6−/− mice. (A) Total bacteria were enumerated in oral swabs taken from Gas6−/− and Gas6+/+ littermate control mice by RT-qPCR of the 16S rRNA gene. Bar graphs present the 16S/18S ratio in each group and represent the mean values ± SEM (n = 6–10). (B) The oral cavities of Gas6−/− and B6 mice were sampled and plated on blood agar under anaerobic conditions. Cfu data of total cultivable oral anaerobic bacteria are shown for each individual mouse with horizontal lines denoting mean values. Representative data of one of three independent experiments are shown. (C) Relative abundance of taxa in oral swabs sampled from Gas6+/+ and Gas6−/− mice. Pie charts represent the average distribution of sequences in operational taxonomic units (OTUs) assigned to each genus. (D) Alpha diversity plot representing taxa richness in samples of Gas6+/+ and Gas6−/− mice. Data represent the mean of seven to eight mice ± SEM. (E) Principal coordinates analysis (PCoA) of weighted UniFrac distances based on 16S rRNA of Gas6+/+ versus Gas6−/−. (F) Box plot of distances described in E. Nonparametric P value of 0.01 (Bonferroni corrected) is presented as *. Representative taxonomic data of one of two independent experiments are shown.
Fig. S3.
An alteration in oral and gut microbiota of Gas6−/− mice. (A) Bacterial composition of certain bacterial families in oral swabs taken from Gas6+/+, Gas6−/−, and Gas6−/+ mice. Bar graph presents the average relative frequency of each family examined and represent the mean of five mice ± SEM. (B) Feces samples were taken from adult Gas6+/+ and Gas6−/− mice and total bacteria were calculated by RT-qPCR. Graphs present the 16S/18S ratio in each group and represent the mean of five mice ± SEM. (C) Bacterial composition of certain bacterial families were quantified using specific primers for their ribosomal 16S genes. Data present the average relative frequency of each family examined and represent the mean of four mice ± SEM.
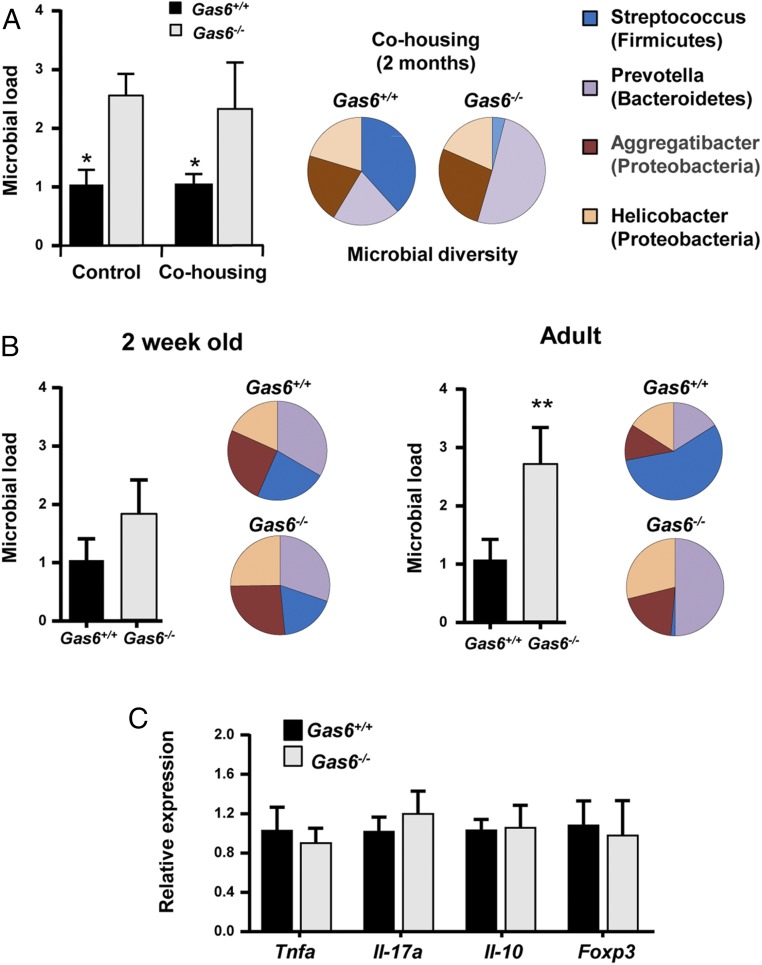
To further verify the role of GAS6 in homeostatic regulation, we first cohoused Gas6−/− and Gas6+/+ mice for 2 mo and examined whether this procedure alters their oral microbiota. As depicted in Fig. 6A, housing the mice in the same cage did not alter the load of oral microbiota either in Gas6−/− or Gas6+/+ mice. Using specific primers to identify ribosomal 16S gene of distinct bacterial families, we verified that each group of mice maintained its original diversity of oral bacteria (Fig. 6A). We then analyzed the microbial and immunological status of Gas6−/− and Gas6+/+ mice 2 wk after birth, a time at which GAS6 is not yet expressed in the oral epithelium. As demonstrated in Fig. 6B, the overall bacterial load in 2-wk-old mice was comparable in Gas6−/− and Gas6+/+ mice, in contrast to adult mice. We also found that bacterial composition was similar in the oral cavities of 2-wk-old Gas6+/+ and Gas6−/− mice but not in adult mice (Fig. 6B). We next quantified expression levels of TNF-α, IL-17A, FOXP3, and IL-10, which were differentially expressed in the oral mucosa of adult Gas6−/− and Gas6+/+ mice (Fig. 3). Our analysis clearly indicated that these molecules were equally expressed in the oral mucosa of 2-wk-old mice of both groups of mice (Fig. 6C and Fig. S4). Collectively, our data suggest that expression of GAS6 induced by the oral microbiota a few weeks after birth is crucial to maintain microbial homeostasis.
Fig. 6.
The oral microbiota in Gas6−/− and Gas6+/+ mice is terminally defined during maturation to adulthood and is not altered by cocaging. (A) Adult Gas6−/− and Gas6+/+ mice were cohoused or housed separately. Two months later, oral swabs were taken from the mice to quantify total bacteria by RT-qPCR of the 16S rRNA gene. Bar graphs present the 16S/18S ratio in each group and represent the mean values of five mice ± SEM. To examine bacterial composition, the levels of certain bacterial families were quantified using specific primers for their ribosomal 16S genes. Pie charts represent the average relative frequency of each bacterial family examined. (B) Oral swabs were taken from 2-wk-old and adult (8 wk old) mice and total bacteria as well as the diversity of certain bacterial families were determined and presented as described above. (C) Bar graph depicts the relative mRNA levels of various immunological molecules in the gingiva of Gas6+/+ and Gas6−/− mice using RT-qPCR and represents the mean of five mice ± SEM. Representative data of one of two independent experiments are shown.
Fig. S4.
Cytokine expression levels in 2-wk-old mice in comparison with adult mice. Bar graph depicts the relative mRNA levels of various immunological molecules in the gingiva of 2-wk-old or adult Gas6+/+ and Gas6−/− mice using RT-qPCR and represents the mean of five mice ± SEM.
Oral Bacteria Expanded in Gas6−/− Mice Are Capable of Using Nitrate Reactive Intermediates for Anaerobic Respiration.
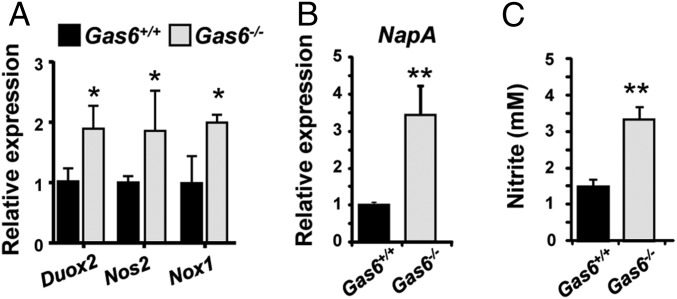
Because a large fraction of the expanded bacteria in Gas6−/− mice are known to use nitrate reactive intermediates for anaerobic respiration (18, 19), we hypothesized that the microbial dysbiosis observed in Gas6−/− mice might be related, in part, to the elevated inflammatory milieu found in their oral mucosa. By expressing enzymes such as nitrate reductase, these anaerobic bacteria can use electron acceptors generated as a byproduct of inflammation to support their growth by anaerobic respiration (18). To examine this hypothesis, we first quantified expression of three major enzymes Doux2, Nos2 (iNOS), and NOX1 induced in epithelial cells and neutrophils, which produce reactive oxygen (O2−) and nitrogen (NO−) species. As depicted in Fig. 7A, higher expression levels of the noted enzymes were found in the oral mucosa of Gas6−/− compared with Gas6+/+ mice. We next tested expression of nitrate reductase in RNA generated from oral bacterial samples and found significant higher expression levels of this enzyme in Gas6−/− mice (Fig. 7B). Analysis of the mouse saliva also revealed increased levels of nitrite (NO2−), the direct product of reduced NO3−, in Gas6−/− mice saliva samples compared with the Gas6+/+ mice (Fig. 7C). Taken together, these results suggest that the elevated production of reactive nitrate intermediates in the oral mucosa of Gas6−/− mice facilitates expansion of anaerobic bacteria expressing nitrate reductase for anaerobic respiration.
Fig. 7.
Oral bacteria expanded in Gas6−/− mice are capable of using nitrate reactive intermediates for anaerobic respiration. (A) Quantification by RT-qPCR showing relative expression levels of Duox2, Nos2, and Nox1 in the gingiva of Gas6+/+ and Gas6−/− littermates. Data represent the mean of 5 mice ± SEM. (B) Relative expression levels of nitrate reductase NapA gene in RNA purified from bacterial samples obtained from Gas6+/+ and Gas6−/− mice. Data represent the mean of 5 mice ± SEM. (C) Concentrations of nitrite (NO2−) in the saliva of Gas6+/+ and Gas6−/− mice. Data represent the mean of 13 mice ± SEM. Representative data of one of two to three independent experiments are shown.
Expression of GAS6 in Epithelial Cells Rather than Hematopoietic Cells Shapes Oral Mucosal Homeostasis.
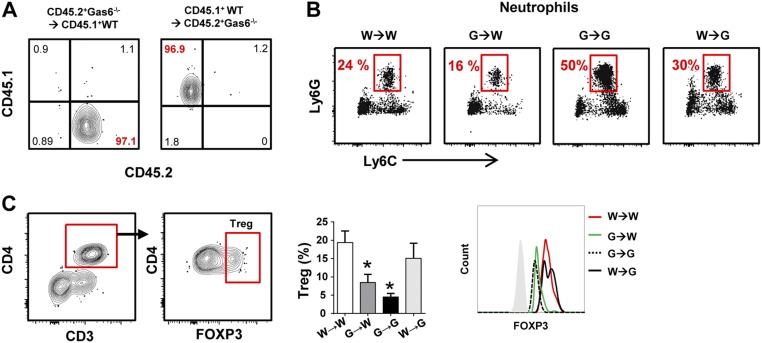
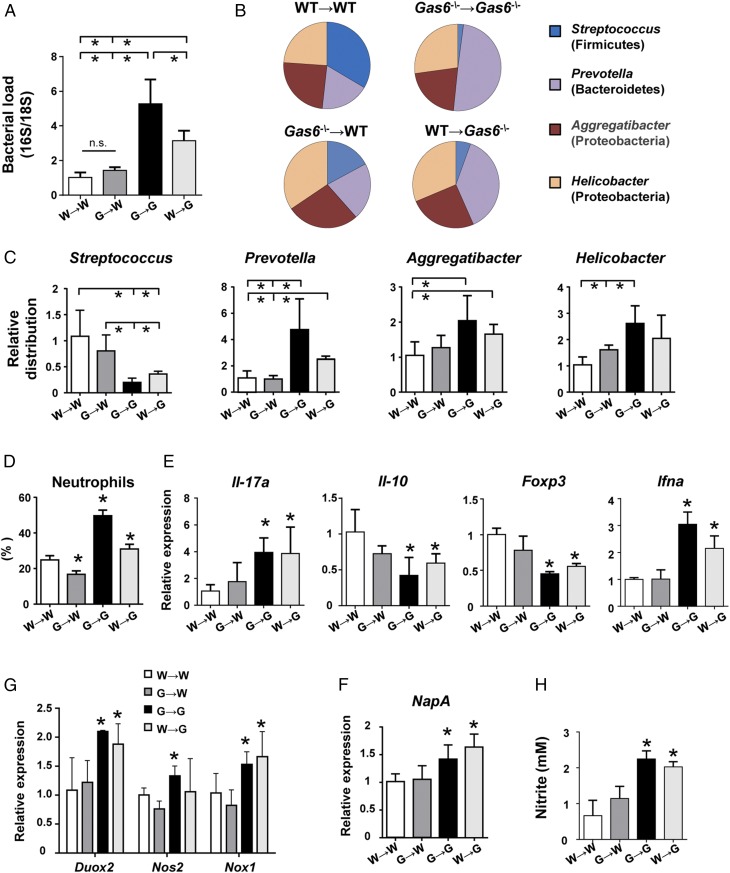
We next sought to dissect the role of GAS6 expressed by epithelial cells versus hematopoietic cells such as DCs in maintaining oral homeostasis. For this step, we lethally irradiated CD45.2+ Gas6−/− and CD45.1+ B6 WT mice and reconstituted their immune system with BM purified from Gas6−/− or WT mice. Eight weeks later successful BM reconstitution was verified in the blood (Fig. S5A), and then microbial and immunological status of the mice were examined as described above. We first established that reconstitution of Gas6−/− (G) and WT (W) mice with their own BM cells (G→G and W→W, respectively) restored the microbial differences found in these mice without irradiation (Fig. 8 A–C). However, whereas reconstitution of WT mice with BM of Gas6−/− mice (G→W) had no impact on the load and diversity of oral microbiota, administration of WT BM cells into Gas6−/− mice (W→G) resulted in a significant alteration of the oral microbiota. However, the changes in the load and diversity of the oral microbiota in W→G were less than those observed in G→G mice, suggesting that, whereas only the absence of epithelial GAS6 enables microbial dysbiosis, its absence in hematopoietic cells further amplifies this process. Next, we examined immunological functions in the chimeric mice. Flow cytometry analysis revealed higher frequencies of neutrophils in G→G and W→G mice in comparison with the other two groups (Fig. 8D and Fig. S5B). However, the percentages of these cells in the oral mucosa of G→G mice were significantly higher than in W→G mice, in correlation to the level of microbial dysbiosis found in these groups. Using RT-qPCR analysis, we found an elevation in IL-17A and IFN-α expression, but a reduction in IL-10 and FOXP3 expression levels, in the oral mucosa of G→G and W→G mice compared with the other groups (Fig. 8E). With regards to FOXP3, flow cytometry analysis of the LN revealed reduced numbers of Treg cells, as well as lower FOXP3 expression per cell, only in mice in which GAS6 was deleted in hematopoietic cells (G→G and G→W mice) (Fig. S5C). Whereas this suggests that the impairment in Treg activity is intrinsic to this cell compartment, its impact on the oral mucosa is predominantly determined by oral epithelial cells. In agreement with the capacity of epithelial cells to express Duox2 and Nox1, the absence of GAS6 in the epithelium of G→G and W→G mice resulted in an overexpression of these molecules compared with WT recipient mice (Fig. 8F). Expression of iNOS (Nos2), however, which is expressed by both neutrophils and epithelial cells, was significantly up-regulated only in G→G mice, demonstrating the importance of GAS6 deletion in both hematopoietic and nonhematopoietic cells to this process. Finally, higher expression levels of NapA were found in G→G and W→G mice, as well as elevated nitrite levels, in line with the expansion of anaerobic bacteria observed in these mice (Fig. 8 F–H). Taken together, these data highlight the critical role of GAS6 in epithelial cells in maintaining oral homeostasis, whereas the absence of GAS6 in hematopoietic cells synergizes the level of dysbiosis.
Fig. S5.
Analysis of chimeric mice. CD45.2+ Gas6−/− and CD45.1+ WT B6 mice were lethally irradiated and 24 h later received BM purified from either CD45.2+ Gas6−/− or CD45.1+ WT B6 mice. (A) Representative FACS plots demonstrating the presence of CD45.1+ and CD45.2+ cells on blood lymphocytes in G→W and W→G mice 8 wk after bone marrow reconstitution. (B) Representative FACS plots indicating the percentages of neutrophils (CD45+Ly6cintLy6Ghi) in the gingiva of chimeric mice. (C) Flow cytometry analysis of Tregs in the LN. Bar graphs present the frequencies of Tregs based on the provided gating strategy, Data represent the mean of three mice ± SEM. Representative histogram FACS plot demonstrating the intensity of FOXP3 expression in Treg cells across the various chimeric mice.
Fig. 8.
GAS6 expressed by epithelial cells rather than by hematopoietic cells controls oral mucosal homeostasis. CD45.2+ Gas6−/− and CD45.1+ WT B6 mice were lethally irradiated and 24 h later received BM purified from either CD45.2+ Gas6−/− or CD45.1+ WT B6 mice. Eight weeks after bone marrow reconstitution, the mice were analyzed. (A) Oral swabs were taken from the mice to quantify total bacteria by RT-qPCR. Bar graphs present the 16S/18S ratio in each group and represent the mean values of three mice ± SEM. Diversity of certain bacterial families was quantified using specific primers for their ribosomal 16S genes. (B) Pie charts represent the average relative frequency of each bacterial family examined. (C) Bar graphs present the relative distribution of each bacterial family among the various groups of irradiated mice. (D) Frequencies of neutrophils in the oral mucosa as determined by flow cytometry. (E) Quantification by RT-qPCR the mRNA levels of Il-17a, Il-10, Foxp3, and Ifna in the gingiva. (F) Quantification by RT-qPCR the relative expression levels of Duox2, Nos2, and Nox1 in the gingiva. (G) Relative expression levels of nitrate reductase NapA gene in RNA purified from bacterial samples obtained from the mice. (H) Concentrations of nitrite (NO2−) in the saliva of the chimeric mice. Data represent the mean of three mice ± SEM. Representative data of one of two independent experiments are shown. n.s., no statistical significance; W, WT; G, Gas6−/−.
Gas6−/− Mice Are Protected from Age-Associated Periodontitis Despite the Presence of Gingival Immunological and Microbial Dysbiosis.
It has been suggested that microbial dysbiosis can lead to an inflammation-driven bone loss, the hallmark of periodontitis (20). Moreover, commensal bacteria were also implicated in instigating age-associated periodontitis as they induce a low-grade chronic inflammation in the gingiva (20). Our results clearly demonstrate the presence of higher inflammatory response in the gingiva of Gas6−/− mice in comparison with Gas6+/+ mice (Fig. 3). Consequently we studied the microbiota located in the gingiva that contains the dental biofilm, rather than examining the microbiota of the whole oral cavity obtained by oral swabs. Similar to what we described in the whole oral cavity samples, elevated bacterial load as well as altered diversity were found in gingiva of Gas6−/− mice in comparison with Gas6+/+ mice (Fig. S6 A–C). Because the observed microbial and immunological dysbiosis is hypothesized to induce alveolar bone loss, we examined age-associated periodontitis in the gingiva of young (2–4 mo) versus aged (20–24 mo) Gas6−/− and Gas6+/+ mice. First, we quantified gingival expression levels of receptor activator of nuclear factor κ B ligand (RANKL) and osteoprotegerin (OPG), critical regulators of osteoclastogenesis and bone resorption (21). Despite their immunological and microbial dysbiosis, RANKL and OPG levels were not significantly changed during aging in Gas6−/−, whereas in Gas6+/+ mice, increased RANKL expression and reduced OPG expression resulted in a reduced RANKL/OPG ratio that favors bone resorption (Fig. S6E) (21). Examining the alveolar bone morphology and quantifying residual alveolar bone confirmed these results, demonstrating considerable bone loss in aged Gas6+/+ mice but not in aged Gas6−/− mice (Fig. S6 E–G). Whereas the lack of alveolar bone loss in aged Gas6−/− mice does not reflect the immunological and microbial status of their gingiva, it is in agreement with previous studies reporting that GAS6 is crucial for the resorption function of mature osteoclasts (22, 23). Therefore, although Gas6−/− mice should have an increased periodontal bone loss based on their periodontal immunological and microbial dysbiosis, the lack of Gas6 that prevents osteoclast function, ultimately, protects these mice from alveolar bone loss.
Fig. S6.
Age-associated periodontitis in Gas6+/+ and Gas6−/− mice. (A) Gingival tissues were excised from individual mice and total DNA was prepared. Total bacteria were enumerated by RT-qPCR of the 16S rRNA gene. Bar graphs present the 16S/18S ratio in each group and represent the mean values ± SEM (n = 5). (B) Pie charts represent the average relative frequency of each bacterial family examined. (C) Bar graphs present the relative distribution of each bacterial family in the gingiva of Gas6+/+ and Gas6−/− mice. (D) Bar graph depicts the relative mRNA levels of Rankl and OPG in the gingiva of young and aged (20–24 mo old) Gas6+/+ and Gas6−/− mice, representing the mean of five mice ± SEM (n = 5). (E) Representative images of the alveolar bone (both buccal and palatal aspects) of young and aged Gas6+/+ and Gas6−/− mice. Arrows indicate areas in which the tooth root is exposed due to an extensive bone loss. (F) Representative μCT sections of the second upper molar demonstrating the impact of age on bone structure. CEJ, cementoenamel junction; ABC, alveolar bone crest. (G) A 3D quantification of the residual alveolar bone. Data are presented as the volume of alveolar bone in the buccal plate and represent the means of five mice per group ± SEM.
Discussion
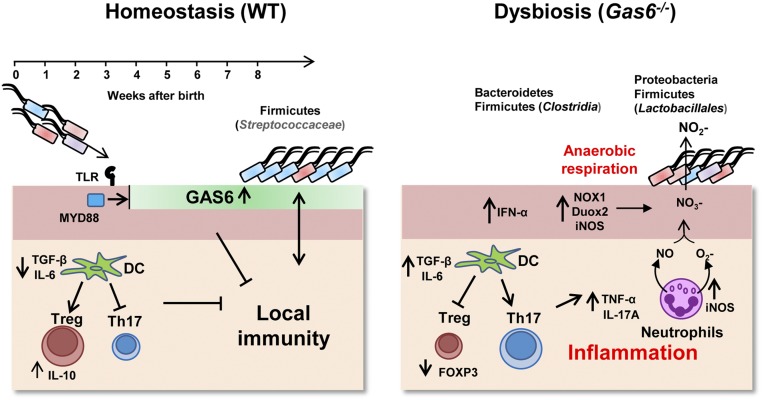
In this study, we first demonstrated that GAS6 plays a fundamental role in maintaining oral mucosal homeostasis. Induction of GAS6 expression in epithelial cells by oral bacteria reduced steady-state antimicrobial immune responses, suggesting that GAS6 provokes epithelial changes, facilitating adaption to the developing microbiota (Fig. S7). The similar immunological and microbial status observed in 2-wk-old Gas6−/− and Gas6+/+ mice, a period in which GAS6 is not normally expressed, further indicates the critical role of GAS6 in this process. Interestingly, PROS1 levels were unchanged, indicating that both TAM ligands are differentially regulated in this setting. The MYD88-dependent expression of GAS6 is likely to be induced via TLR signaling, because TAM molecules are known to be up-regulated upon TLR stimulation (24). Moreover, oral mucosal epithelial cells constitutively express TLR2 and TLR4, recognizing bacterial peptidoglycans and lipopolysaccharides, respectively (25). Nevertheless, despite the absolute dependence of GAS6 expression on oral microbiota, GAS6 was not expressed 1–3 wk after birth, a time in which bacteria are already present in the oral cavity. It is possible that alteration in the oral microbial load or composition occurring during the first few weeks after birth, presumably related to the weaning procedure or tooth eruption, stimulate GAS6 expression. An additional explanation could be postnatal developmental changes in the oral mucosa that are driven by commensals, similar to other mucosal sites (26). We have shown recently that Langerhans cells gradually populate the oral epithelium 2 mo after birth (27), thus supporting the idea of gradual maturation of the epithelium during this period. Such homeostatic innate and adaptive responses are critical to adjust the mucosa to meet environmental requirements, particularly during the transition from the protected fetal life to the intense postnatal interactions with oral commensals.
Fig. S7.
A proposed model for the role of GAS6 in maintaining oral mucosal homeostasis. Under homeostatic conditions, 3–4 wk after birth, oral microbiota induces expression of GAS6 in the oral epithelium in a MYD88-dependent pathway, most likely via triggering TLR2/4 known to be expressed on oral epithelial cells. Expression of GAS6 inhibits activation of epithelial cells by microbiota by down-regulating secretion of proinflammatory cytokines and production of free radicals. In addition, GAS6 induces the differentiation of Treg rather than Th17 cells by controlling IL-6 expression in DCs. These conditions favor the colonization of the Firmicutes phylum, particularly Streptococcaceae, hallmarks of microbial homeostasis in the oral mucosa. In the absence of GAS6, the oral epithelium becomes activated and DCs induce Th17 cells, while reducing Treg numbers and function. As a result, the oral mucosa becomes inflamed, resulting in up-regulation of the enzymes, iNOS, NOX1, and DUOX2 in epithelial cells and neutrophils, which generate reactive nitrogen species (NO) and reactive oxygen species (O2−). Respiratory electron acceptors (NO3−) generated as a byproduct of the host inflammatory response support growth of the Proteobacteria phylum and Lactobacillales (Firmicutes) that express nitrate reductase and by anaerobic respiration convert NO3− to NO2−. Other bacterial populations, Firmicutes (Chlostridia) and Bacteroidetes are also preferentially expanded under inflammatory conditions, whereas the latter phylum contains several important oral pathogens that exist in periodontal inflammation disease.
Our study demonstrates irrefutably the expression of GAS6 in freshly purified murine DCs. Expression of GAS6 by DCs enables tolerogenic immune responses to the microbiota by regulating IL-6 levels favoring the differentiation of Treg over Th17 cells in vivo. Such a GAS6-mediated reduction of IL-6 expression was previously reported in vitro using monocyte/macrophage cells (28). Of note, the absence of GAS6 not only reduced the frequencies of Treg cells, but also decreased FOXP3 expression levels on a per-cell basis. This finding suggests that the regulatory function of Treg cells was severely impaired in Gas6−/− mice (17). Nevertheless, the ability of GAS6 to modulate polarization of Treg/Th17 in DCs in vivo is instructed by signals initiated by epithelial cells, because the absence of Gas6 in hematopoietic cells alone (Gas6−/−→ WT) had no significant impact on the mice. Previous studies have shown that Th17 and Treg cells play an important role in the development of experimental periodontitis (29, 30). It was also suggested that periodontitis could be a result of oral microbial dysbiosis induced by periodontal pathogens (20). Because we found that GAS6 expression is controlled by bacteria, it is tempting to hypothesize that oral pathogens might have the capacity to modulate GAS6 levels and by that to alter Th17/Treg balance, to induce microbial dysbiosis and subsequently periodontitis. Regardless of the precise mechanism, the direct impact of GAS6 on these two periodontitis-associated causes strongly suggests the involvement of GAS6 in periodontitis. Although the critical role of GAS6 on osteoclast function precludes an impact on the oral mucosa with periodontal bone loss, further studies developing novel cell-specific ablation of GAS6 might be able to show such connection.
The dysbiosis observed in our study is likely to be associated with both host–microbe and microbe–microbe interactions. The host inflammatory response developed in the absence of GAS6 probably eliminated certain bacteria, whereas the ability to use inflammation byproducts for anaerobic respiration facilitates the growth of others. A similar phenomenon was recently observed in the intestine at various experimental settings (31–33). Expansion of Proteobacteria in Gas6−/− mice correlates well with their superior capacity to produce nitrate reductase (18). Such activity might also explain the striking shift from Streptococcaceae to Lactobacillaceae within the Firmicutes phylum, as the latter are also capable of denitrification, which could be used for anaerobic respiration (19). Augmentation of the Bacteroidetes phylum in the oral mucosa of Gas6−/− mice, particularly the Porphyromonadaceae and Prevotellaceae families, is highly relevant to oral health. These populations include several key oral pathogens such as Porphyromonas gingivalis, Prevotella intermedia, and Tannerella forsythia that flourish in periodontal inflammation and are closely associated with tissue destruction (34).
As a ligand of the TAM signaling system, GAS6 is expressed by many cell types and could act on its receptors either locally or remotely (9). We demonstrate in this work that GAS6 and its potent receptor AXL are expressed by epithelial cells as well as DCs. The results obtained by the chimeric mice experiments suggest that GAS6 is likely to act in an autocrine/paracrine fashion on epithelial cells. With regard to DCs, the higher expression of IL-6 by these cells upon stimulation in vitro suggests that GAS6 can also act in an autocrine/paracrine fashion on DCs, but this might not accurately reflect the situation in vivo. Indeed, the precise mechanisms by which TAM ligands engage their receptors are not fully understood, and further investigation is required to address this issue.
In summary, this study reveals a critical role for epithelial GAS6 in regulating host–commensal homeostatic interactions in the murine oral mucosa. The similarity in the pattern of GAS6 and PROS1 expression among mouse and human gingival tissues strongly suggest a role for TAM signaling in maintaining oral mucosal homeostasis also in human. The present data thus expand our capacity to understand oral diseases, which might facilitate the development of novel therapeutic strategies.
Experimental Procedures
Mice.
C57BL/6JOlaHsd (B6) were purchased from Harlan. Gas6−/− mice were kindly provided by Greg Lemke, Salk Institute, La Jolla, CA. For most of the studies described in this work littermate controls of Gas6+/+ and Gas6−/− mice were used. All animal protocols were approved by the Hebrew University Institutional Animal Care and Ethics Committee. Germ-free (GF) or SPF adult male outbred Swiss Webster mice (a widely used mouse strain in GF experiments) were maintained in sterile isolators at the Weizmann Institute. For cohousing experiments GF mice were housed with SPF mates for 2 mo. All GF studies were approved by the Institutional Animal Care and Use Committee of the Weizmann Institute of Science. The identity of the mice used for experiments is described in SI Materials and Methods.
Antibodies and Reagents.
Antibodies and reagents are described in SI Materials and Methods.
Immunofluorescence Staining.
The murine maxilla was treated as described in SI Materials and Methods. Staining of human gingival cross-section was performed on freshly isolated tissues as described above, under the approval obtained by the Hadassah Medical Center Institutional Review Board. Informed consent was provided in accordance with the Declaration of Helsinki.
RNA Extraction and Real-Time PCR.
For RNA isolation the maxilla was homogenized in 1 mL TRI reagent (Sigma) using an electric homogenizer, and RNA was extracted as described in SI Materials and Methods. Sequences of primers that were used for RT-qPCR are listed in Table S1.
Table S1.
List of primers used in this study
| Gene | Forward | Reverse |
| RANKL | TCG TTG GAT CAC AGC ACA TCA | TAT GGG AAC CAG ATG GGA TGT C |
| GAS6 | AGG TCT GCC ACA ACA AAC CA | GCG TAG TCT AAT CAC GGG GG |
| IL-17 | CAC TTT GCC TCC CAG ATC AC | ACC AAT CCC AAA AGG TCC TC |
| TBP | GAG CTG TGA TGT GAA GTT CCC | TCT GGG TTT GAT CAT TCT GTA G |
| IL-6 | AGT TGC CTT CTT GGG ACT G | CAG AAT TGC CAT TGC ACA A |
| 16S | AGA GTT TGA TCC TGG CTC | TGC TGC CTC CCG TAG GAG T |
| 18S | CGG CTA CCA CAT CCA AGG AA | GGG CCT CGA AAG AGT CCT GTA T |
| ProS | GCA CAG TGC CCT TTG CCT | CAA ATA CCA CAA TAT CCT GAG ACG TT |
| AXL | ATG CCA GTC AAG TGG ATT GCT | CAC ACA TCG CTC TTG CTG GT |
| TNF-α | CCC AGG GAC CTC TCT CTA ATC A | AGC TGC CCC TCA GCT TGA G |
| Helicobacter | CGG AATCACTGGGCGTAAAGA | ACGGATTTTACCCCTACACCAA |
| Foxp3 | TGC TGA CCC CAA GAA GGA AT | TTT GGT TCC GAT CCA GGT TTT |
| Aggregatibacter | CCG AAG CTAACGTGATAAATCGA | AGGTAAGGTTCTTCGCGTTGC |
| Nox1 | CCATCCAGTCTCCAAACATGAC | TCCTGCGGATAAACTCCATAGC |
| Nos2 | CCAGCTGCAGCTCCACAAG | CCAGTCATTGTACTCTGAGGGCT |
| Duox2 | TTCACCATGATGCGGTCCTT | TCCTTGTCCTGGAACCCAGA |
| napA | GGA CAT CGG CTA GGT TTA CG | GTA TAC TCG GCA ACG AAG GCT T |
| IL-10 | GGT TGC CAA GCC TTA TCG GA | ACC TGC TCC ACT GCC TTG CT |
| Streptococcus | CCT ACG GGA GGC A | CAA CAG AGC TTT ACG ATC CGA AA |
| Prevotella | CAC CAA GGC GAC GAT CA | GGA TAA CGC CCG GAC CT |
Analysis of T Cells in the LNs.
Cervical LNs were collected from Gas6+/+ or Gas6−/− mice and treated as explained in SI Materials and Methods.
Isolation and Processing of Gingival Tissue.
Gingival and skin cells were isolated as explained in SI Materials and Methods.
Preparation and Simulation of BMDCs.
BMDCs were prepared and stimulated as described in SI Materials and Methods.
Cultivation of Oral Microbiota.
Oral cavity of anesthetized individual Gas6+/+ or Gas6−/− littermate control mice were swabbed for 30 s and the swabs were then inserted into Eppendorf tubes containing 100 µL of Wilkins-Chalgren medium (Oxoid). The samples were serially diluted and plated on blood agar for 2 d under anaerobic conditions at 37 °C and colonies were enumerated to determine the colony-forming units (cfus) of total cultivatable oral anaerobic bacteria.
In Vivo BM Reconstitution Assays.
Eight-week-old recipient CD45.2+ Gas6−/− or CD45.1+ B6 mice were lethally irradiated with 950 rad and 24 h later the mice were injected i.v. with 5 × 10⁶ BM cells obtained from either congenic CD45.2+ Gas6−/− or CD45.1+ B6 mice to allow identification of donor-derived cells. The chimerism was verified in the blood as indicated in the text.
Western Blot.
Gingival tissues were isolated and homogenized in ice-cold lysis buffer (50 mM Tris pH 7.5, 150 mM NaCl, 1% Triton X-100, 0.5% Nonidet P-40, 0.1% SDS, 0.5 mM EDTA) supplemented with a protease inhibitor mixture (Sigma). Following lysate incubation for 30 min on ice, tissue debris were removed by centrifugation as described in SI Materials and Methods.
Taxonomic Microbiota Analysis.
For 16S amplicon pyrosequencing, PCR amplification was performed spanning the V1/2 region of the 16S rRNA gene and subsequently sequenced using 500-bp paired-end sequencing (Illumina MiSeq). Reads were then processed using the QIIME (quantitative insights into microbial ecology) analysis pipeline with USEARCH against the Greengenes Database.
Statistical Analysis.
Data were expressed as means ± SEM. Statistical tests were performed using one-way analysis of variance (ANOVA) and Student’s t test. P < 0.05 was considered significant. *P < 0.05; **P < 0.01.
SI Materials and Methods
Mice.
C57BL/6JOlaHsd (B6) were purchased from Harlan. Gas6−/− mice were kindly provided by Greg Lemke, Salk Institute, La Jolla, CA. For most of the studies described in this work, littermate controls of Gas6+/+ and Gas6−/− mice were used. The identity of the mice used for experiments was confirmed by genotyping with the following PCR primers: forward, GAGTGCCGTGATTCTGGTC; middle, CCACTAAGGAAACAATAACTG; and reverse, ATCTCTCGTGGGATCATT. The mice were maintained under SPF conditions and analyzed between 8 and 12 wk of age unless described elsewhere in the text. All animal protocols were approved by the Hebrew University Institutional Animal Care and Ethics Committee. Germ-free (GF) or SPF adult male outbred Swiss Webster mice (a widely used mouse strain in GF experiments) were maintained in sterile isolators at the Weizmann Institute. For cohousing experiments GF mice were housed with SPF mates for 2 mo. All GF studies were approved by the Institutional Animal Care and Use Committee of the Weizmann Institute of Science.
Antibodies and Reagents.
The following fluorochrome-conjugated monoclonal antibodies and the corresponding isotype controls were purchased from BioLegend: I-A/I-E (M5/114.15.2), CD45.2 (104), B220 (RA3-6B2), CD86 (PO3), CD45.1 (A20), Gr-1 (RB6-8C5), Ly6G (1A8), Ly6C (HK1.4), CD3 (17A2), B220 (RA3-6B2), CD11b (M1/70), CD8α (53-6.7), FOXP3 (MF-14), and CD11c (N418). Primary antibodies for Western blot analysis were purchased from R&D Systems: goat anti-MERTK (AF591) and goat anti-GAS6 (AF986); Santa Cruz Biotechnology: goat anti-AXL (sc-1096) and goat anti-Actin (sc-1616); and Millipore: rabbit anti-protein S (AB15928). Horseradish peroxidase (HRP)-conjugated secondary antibodies were purchased from Abcam: donkey anti-goat IgG H&L (ab7125) and goat anti-rabbit IgG H&L (ab97080). CFSE was purchased from Molecular Probes. Escherichia coli LPS were purchased from Sigma. The 7-AAD viability staining solution was purchased from BioLegend.
Immunofluorescence Staining.
The murine maxilla was fixed overnight at 4 °C in 4% (vol/vol) paraformaldehyde/PBS solution, and then washed for 1 wk in EDTA 0.5 M/PBS that was changed every other day. The tissue was cryopreserved in 30% sucrose (overnight at 4 °C), embedded in OCT, and cryosectioned into 10-μm-thick sections. The cross-sections, as well as the separated epithelium, were washed three times in PBS, blocked in a blocking buffer [5% (vol/vol) FCS, 0.1% Triton X-100 in PBS] for 1 h at room temperature, and incubated with primary antibodies: goat anti-Gas6 (clone sc-1935, Santa Cruz Biotechnology), rabbit anti-PROS1 (clone 2428718, Millipore), rat anti-CD31 (clone 550274, BioLegend), and goat anti-Axl (clone sc-1096, Santa Cruz Biotechnology) overnight at 4 °C. Following three washing steps in PBS, the samples were incubated with a secondary antibody: donkey anti-goat IgG, donkey anti-rat IgG, or donkey anti-rabbit IgG (Jackson ImmunoResearch) diluted 1:100 in blocking buffer for 1 h at RT, washed three times, stained with Hoechst, and mounted. As a negative staining control, primary antibody was omitted and replaced by blocking buffer. Signals were visualized and digital images were obtained using an Olympus BX51 fluorescence microscope.
For detection of Gas6 in DCs, cervical LN cells were pooled from eight Gas6+/+ or Gas6−/− mice and DCs were sorted using flow cytometry based on the expression of MHCII and CD11c. The sorted DCs were treated with 0.5 M NaCl, 0.5% acetic acid solution at pH 3 for 90 s to remove the antibodies used for sorting and washed with complete medium. DCs (2.5 × 10⁵ cells) were directly placed on prepolyornithine (0.5 mg/mL, Sigma) sterile cover slides, allowed to adhere overnight at 37 °C in 5% CO2, and fixed in 4% PFA. The slides were washed three times in PBS and blocked with blocking buffer (3% FBS, 0.2% Triton X-100 in PBS) for 1 h at room temperature, followed by incubation with primary antibodies goat anti-Gas6 clone sc-1935 (Santa Cruz Biotechnology) and rat anti-MHCII clone M5/114.15.2 (BioLegend) overnight at 4 °C. The slides were then washed three times in PBS, incubated with fluorophore-coupled secondary antibody: donkey anti-goat IgG and donkey anti-rat IgG (Jackson ImmunoResearch), diluted 1:100 in blocking buffer for 1 h at room temperature, washed three times in PBS, dipped in Hoechst for nuclear staining, and mounted with Fluoromount G (Southern Biotech). Images were taken using a Nikon C2 confocal LASER scanning microscope.
RNA Extraction and Real-Time PCR.
For RNA isolation the maxilla was homogenized in 1 mL TRI reagent (Sigma) using an electric homogenizer, and RNA was extracted according to the manufacturer’s instructions. cDNA synthesis was performed using the qScript cDNA Synthesis Kit (Quanta-BioSciences). Real-time qPCR reactions (20 µL volume) were performed using Power SYBR Green PCR Master Mix (Quanta-BioSciences). The following reaction conditions were used: 10 min at 95 °C, 40 cycles of 15 s at 95 °C, and 60 s at 60 °C. The samples were normalized to the TATA box binding protein (TBP) as control mRNA, by change in cycling threshold (ΔCT) method and calculated based on 2-ΔΔCT. To detect IFN-α, universal primers were designed to amplify effectively the majority of IFN-a subtypes (11 of 13 known subtypes).
Analysis of T Cells in the LNs.
Cervical LNs were collected from Gas6+/+ or Gas6−/− mice and treated with collagenase type II (1 mg/mL) and DNase I (1 mg/mL) solution in PBS plus 2% (vol/vol) FCS for 20 min at 37 °C in a shaker bath. A total of 20 µL of 0.5 M EDTA per 2 mL sample was added to the digested LNs and incubated for an additional 10 min. Foxp3+ T cells in the LN cell population were identified using the Foxp3 Fix/Perm Buffer Set (BioLegend) stained with CD3, CD4, and Foxp3 antibodies according to the manufacturer’s instructions. To quantify IL-17A+ cells, the LN cells were incubated with PMA (1 µg/mL)/ionomycin (1 µg/mL) and Golgi Plug (2 µL/mL) for 8 h and then stained with CD3, CD4, and IL-17A (intracellularly) antibodies. The stained samples were run in the LSR II (BD Biosciences) flow cytometer and analyzed using FlowJo software (Tree Star).
Isolation and Processing of Gingival Tissue.
The gingiva were excised, minced, and treated with collagenase type II (2 mg/mL; Worthington Biochemicals) and DNase I (1 mg/mL; Roche) solution in PBS plus 2% (vol/vol) FCS for 25 min at 37 °C in a shaker bath. A total of 20 μL of 0.5 M EDTA per 2-mL sample was added to the digested tissues and incubated for an additional 10 min. The cells were washed, filtered with a 70-μM filter, and stained with antibodies as indicated in the text. In some experiments, Foxp3 staining was performed using the Foxp3 Fix/Perm Buffer Set (BioLegend) according to the manufacturer’s instructions. For the identification of IL-17A-producing CD4+ T cells, gingival cells were stimulated with PMA (1 µg/mL)/ionomycin (1 µg/mL) and Golgi Plug (2 µL/mL) for 8 h and the cells were stained with CD45, CD3, CD4 ,and IL-17A (intracellularly) antibodies.
Preparation and Simulation of BMDCs.
The femur was isolated from the mice, cleaned from soft tissues in RPMI 1640, and soaked in 70% ethanol for 1 min for sterilization. The femur was then washed with sterile PBS and the bone ends was removed by sterile scissors. Bone marrow (BM) cells eluted from the bone by flushing them several times using a sterile syringe filled with RPMI 1640, and the cells were then washed, treated with ACK solution for 3 min on ice, washed again, and counted. BM cells (5 × 10⁵ cells per well) in 24-well plates (Nunc) were cultured with complete RPMI media [450 mL RPMI 1640, 50 mL FCS, 5 mL l-glutamine, 50 µM β-mercaptoethanol, penicillin (100 units/mL), streptomycin (100 µg/mL), and gentamicin (50 µg/mL)] supplemented with GM-SCF (20 ng/mL) for 4 d to induce their differentiation into BMDCs (CD11C+MHCIIhigh). The cultures were then exposed to LPS (Sigma) (100 ng/mL) for 24 h and supernatants were collected to quantify IL-6 by ELISA (BioLegend). The stimulated BMDCs were washed and stained with the noted antibodies for analysis of their maturation state by flow cytometry. For cytokine production, the BDMCs were cocultured with OT-II CD4+ T cells, purified by negative selection with the EasyStep mouse CD4+ T-cell enrichment kit, for 3 d in the presence of LPS (100 ng/mL) and OVA223–239 peptide (1 µg/mL). The levels of IL-17A were measured in the supernatant by ELISA (BioLegend) according to the manufacturer’s instructions.
Cultivation of Oral Microbiota.
Oral cavity of anesthetized individual Gas6+/+ or Gas6−/− littermate control mice were swabbed for 30 s and the swabs were then inserted into Eppendorf tubes containing 100 µL of Wilkins-Chalgren medium (Oxoid). The samples were serially diluted and plated on blood agar for 2 d under anaerobic conditions at 37 °C and colonies were enumerated to determine the colony-forming units (cfus) of total cultivatable oral anaerobic bacteria.
In Vivo BM Reconstitution Assays.
Eight-week-old recipient CD45.2+ Gas6−/− or CD45.1+ B6 mice were lethally irradiated with 950 rad, and 24 h later the mice were injected i.v. with 5 × 10⁶ BM cells obtained from either congenic CD45.2+ Gas6−/− or CD45.1+ B6 mice to allow identification of donor-derived cells. The chimerism was verified in the blood as indicated in the text.
Western Blot.
Gingival tissues were isolated and homogenized in ice-cold lysis buffer (50 mM Tris pH 7.5, 150 mM NaCl, 1% Triton X-100, 0.5% Nonidet P-40, 0.1% SDS, 0.5 mM EDTA) supplemented with a protease inhibitor mixture (Sigma). Following lysate incubation for 30 min on ice, tissue debris were removed by centrifugation (15,000 × g for 30 min at 4 °C) and protein concentration in the supernatant was determined using Pierce BSA Protein Assay Kit (Thermo Scientific). Samples of 20 µg of total protein were loaded onto 10% acrylamide gel and subject to SDS/PAGE. Proteins were transferred to a PVDF membrane (Millipore), the membrane was blocked in 5% skim milk for 30 min at room temperature, and reacted with primary antibody overnight at 4 °C. The membrane was then washed three times in TBST for 10 min at room temperature, incubated with secondary HRP-conjugated antibody in blocking buffer for 1 h at room temperature and washed three times in TBST before the blots were reacted with ECL substrate (Western blot detection kit, Advansta). Images were captured using a ChemiDoc MP Image System (Bio-Rad).
Acknowledgments
This work was supported by United States–Israel Binational Science Foundation Grant 2015209 (to A.-H.H.), and Israel Science Foundation Grant 1764/12 (to T.B.-C.).
Footnotes
The authors declare no conflict of interest.
This article is a PNAS Direct Submission.
This article contains supporting information online at www.pnas.org/lookup/suppl/doi:10.1073/pnas.1614926114/-/DCSupplemental.
References
- 1.Kagnoff MF. The intestinal epithelium is an integral component of a communications network. J Clin Invest. 2014;124(7):2841–2843. doi: 10.1172/JCI75225. [DOI] [PMC free article] [PubMed] [Google Scholar]
- 2.Whitsett JA, Alenghat T. Respiratory epithelial cells orchestrate pulmonary innate immunity. Nat Immunol. 2015;16(1):27–35. doi: 10.1038/ni.3045. [DOI] [PMC free article] [PubMed] [Google Scholar]
- 3.Eskan MA, et al. TLR4 and S1P receptors cooperate to enhance inflammatory cytokine production in human gingival epithelial cells. Eur J Immunol. 2008;38(4):1138–1147. doi: 10.1002/eji.200737898. [DOI] [PMC free article] [PubMed] [Google Scholar]
- 4.Greer A, Zenobia C, Darveau RP. Defensins and LL-37: A review of function in the gingival epithelium. Periodontol 2000. 2013;63(1):67–79. doi: 10.1111/prd.12028. [DOI] [PMC free article] [PubMed] [Google Scholar]
- 5.Kolenbrander PE, Palmer RJ, Jr, Periasamy S, Jakubovics NS. Oral multispecies biofilm development and the key role of cell-cell distance. Nat Rev Microbiol. 2010;8(7):471–480. doi: 10.1038/nrmicro2381. [DOI] [PubMed] [Google Scholar]
- 6.Hajishengallis G. Periodontitis: From microbial immune subversion to systemic inflammation. Nat Rev Immunol. 2015;15(1):30–44. doi: 10.1038/nri3785. [DOI] [PMC free article] [PubMed] [Google Scholar]
- 7.Rothlin CV, Carrera-Silva EA, Bosurgi L, Ghosh S. TAM receptor signaling in immune homeostasis. Annu Rev Immunol. 2015;33:355–391. doi: 10.1146/annurev-immunol-032414-112103. [DOI] [PMC free article] [PubMed] [Google Scholar]
- 8.Lemke G, Burstyn-Cohen T. TAM receptors and the clearance of apoptotic cells. Ann N Y Acad Sci. 2010;1209:23–29. doi: 10.1111/j.1749-6632.2010.05744.x. [DOI] [PMC free article] [PubMed] [Google Scholar]
- 9.Lemke G, Rothlin CV. Immunobiology of the TAM receptors. Nat Rev Immunol. 2008;8(5):327–336. doi: 10.1038/nri2303. [DOI] [PMC free article] [PubMed] [Google Scholar]
- 10.van der Meer JH, van der Poll T, van ’t Veer C. TAM receptors, Gas6, and protein S: Roles in inflammation and hemostasis. Blood. 2014;123(16):2460–2469. doi: 10.1182/blood-2013-09-528752. [DOI] [PubMed] [Google Scholar]
- 11.Burstyn-Cohen T, et al. Genetic dissection of TAM receptor-ligand interaction in retinal pigment epithelial cell phagocytosis. Neuron. 2012;76(6):1123–1132. doi: 10.1016/j.neuron.2012.10.015. [DOI] [PMC free article] [PubMed] [Google Scholar]
- 12.Burstyn-Cohen T, Heeb MJ, Lemke G. Lack of protein S in mice causes embryonic lethal coagulopathy and vascular dysgenesis. J Clin Invest. 2009;119(10):2942–2953. doi: 10.1172/JCI39325. [DOI] [PMC free article] [PubMed] [Google Scholar]
- 13.Nagata K, et al. Identification of the product of growth arrest-specific gene 6 as a common ligand for Axl, Sky, and Mer receptor tyrosine kinases. J Biol Chem. 1996;271(47):30022–30027. doi: 10.1074/jbc.271.47.30022. [DOI] [PubMed] [Google Scholar]
- 14.Rodrigue L, Barras MJ, Marcotte H, Lavoie MC. Bacterial colonization of the oral cavity of the BALB/c mouse. Microb Ecol. 1993;26(3):267–275. doi: 10.1007/BF00176958. [DOI] [PubMed] [Google Scholar]
- 15.Littman DR, Rudensky AY. Th17 and regulatory T cells in mediating and restraining inflammation. Cell. 2010;140(6):845–858. doi: 10.1016/j.cell.2010.02.021. [DOI] [PubMed] [Google Scholar]
- 16.Gough DJ, Messina NL, Clarke CJ, Johnstone RW, Levy DE. Constitutive type I interferon modulates homeostatic balance through tonic signaling. Immunity. 2012;36(2):166–174. doi: 10.1016/j.immuni.2012.01.011. [DOI] [PMC free article] [PubMed] [Google Scholar]
- 17.Wan YY, Flavell RA. Regulatory T-cell functions are subverted and converted owing to attenuated Foxp3 expression. Nature. 2007;445(7129):766–770. doi: 10.1038/nature05479. [DOI] [PubMed] [Google Scholar]
- 18.Winter SE, Bäumler AJ. Dysbiosis in the inflamed intestine: Chance favors the prepared microbe. Gut Microbes. 2014;5(1):71–73. doi: 10.4161/gmic.27129. [DOI] [PMC free article] [PubMed] [Google Scholar]
- 19.Xu J, Verstraete W. Evaluation of nitric oxide production by lactobacilli. Appl Microbiol Biotechnol. 2001;56(3–4):504–507. doi: 10.1007/s002530100616. [DOI] [PubMed] [Google Scholar]
- 20.Hajishengallis G, et al. Low-abundance biofilm species orchestrates inflammatory periodontal disease through the commensal microbiota and complement. Cell Host Microbe. 2011;10(5):497–506. doi: 10.1016/j.chom.2011.10.006. [DOI] [PMC free article] [PubMed] [Google Scholar]
- 21.Cochran DL. Inflammation and bone loss in periodontal disease. J Periodontol. 2008;79(8) Suppl:1569–1576. doi: 10.1902/jop.2008.080233. [DOI] [PubMed] [Google Scholar]
- 22.Katagiri M, et al. Mechanism of stimulation of osteoclastic bone resorption through Gas6/Tyro 3, a receptor tyrosine kinase signaling, in mouse osteoclasts. J Biol Chem. 2001;276(10):7376–7382. doi: 10.1074/jbc.M007393200. [DOI] [PubMed] [Google Scholar]
- 23.Nakamura YS, et al. Tyro 3 receptor tyrosine kinase and its ligand, Gas6, stimulate the function of osteoclasts. Stem Cells. 1998;16(3):229–238. doi: 10.1002/stem.160229. [DOI] [PubMed] [Google Scholar]
- 24.Rothlin CV, Ghosh S, Zuniga EI, Oldstone MB, Lemke G. TAM receptors are pleiotropic inhibitors of the innate immune response. Cell. 2007;131(6):1124–1136. doi: 10.1016/j.cell.2007.10.034. [DOI] [PubMed] [Google Scholar]
- 25.Sugawara Y, et al. Toll-like receptors, NOD1, and NOD2 in oral epithelial cells. J Dent Res. 2006;85(6):524–529. doi: 10.1177/154405910608500609. [DOI] [PubMed] [Google Scholar]
- 26.Fulde M, Hornef MW. Maturation of the enteric mucosal innate immune system during the postnatal period. Immunol Rev. 2014;260(1):21–34. doi: 10.1111/imr.12190. [DOI] [PubMed] [Google Scholar]
- 27.Capucha T, et al. Distinct murine mucosal Langerhans cell subsets develop from pre-dendritic cells and monocytes. Immunity. 2015;43(2):369–381. doi: 10.1016/j.immuni.2015.06.017. [DOI] [PubMed] [Google Scholar]
- 28.Alciato F, Sainaghi PP, Sola D, Castello L, Avanzi GC. TNF-alpha, IL-6, and IL-1 expression is inhibited by GAS6 in monocytes/macrophages. J Leukoc Biol. 2010;87(5):869–875. doi: 10.1189/jlb.0909610. [DOI] [PubMed] [Google Scholar]
- 29.Arizon M, et al. Langerhans cells down-regulate inflammation-driven alveolar bone loss. Proc Natl Acad Sci USA. 2012;109(18):7043–7048. doi: 10.1073/pnas.1116770109. [DOI] [PMC free article] [PubMed] [Google Scholar]
- 30.Gaffen SL, Hajishengallis G. A new inflammatory cytokine on the block: Re-thinking periodontal disease and the Th1/Th2 paradigm in the context of Th17 cells and IL-17. J Dent Res. 2008;87(9):817–828. doi: 10.1177/154405910808700908. [DOI] [PMC free article] [PubMed] [Google Scholar]
- 31.Winter SE, et al. Gut inflammation provides a respiratory electron acceptor for Salmonella. Nature. 2010;467(7314):426–429. doi: 10.1038/nature09415. [DOI] [PMC free article] [PubMed] [Google Scholar]
- 32.Winter SE, et al. Host-derived nitrate boosts growth of E. coli in the inflamed gut. Science. 2013;339(6120):708–711. doi: 10.1126/science.1232467. [DOI] [PMC free article] [PubMed] [Google Scholar]
- 33.Smith PM, et al. The microbial metabolites, short-chain fatty acids, regulate colonic Treg cell homeostasis. Science. 2013;341(6145):569–573. doi: 10.1126/science.1241165. [DOI] [PMC free article] [PubMed] [Google Scholar]
- 34.Socransky SS, Haffajee AD, Cugini MA, Smith C, Kent RL., Jr Microbial complexes in subgingival plaque. J Clin Periodontol. 1998;25(2):134–144. doi: 10.1111/j.1600-051x.1998.tb02419.x. [DOI] [PubMed] [Google Scholar]


