Significance
Human blood cell production is coordinated to ensure balanced levels of all lineages. The basis of this regulation remains poorly understood. Identification of genetic differences in human populations associated with blood cell measurements can shed light on such regulatory mechanisms. Here, we used whole-genome sequencing data to perform a genetic association study in a population-based biobank from Estonia. We identified a number of potential causal variants and underlying mechanisms. For example, we identified a regulatory element that is necessary for basophil production, which acts specifically during this process to regulate expression of the transcription factor CEBPA. We demonstrate how genome sequencing, genetic fine-mapping, and functional data can be integrated to gain important insight into blood cell production.
Keywords: genome sequencing, GWAS, basophils, hematopoiesis, CEBPA
Abstract
Genetic variants affecting hematopoiesis can influence commonly measured blood cell traits. To identify factors that affect hematopoiesis, we performed association studies for blood cell traits in the population-based Estonian Biobank using high-coverage whole-genome sequencing (WGS) in 2,284 samples and SNP genotyping in an additional 14,904 samples. Using up to 7,134 samples with available phenotype data, our analyses identified 17 associations across 14 blood cell traits. Integration of WGS-based fine-mapping and complementary epigenomic datasets provided evidence for causal mechanisms at several loci, including at a previously undiscovered basophil count-associated locus near the master hematopoietic transcription factor CEBPA. The fine-mapped variant at this basophil count association near CEBPA overlapped an enhancer active in common myeloid progenitors and influenced its activity. In situ perturbation of this enhancer by CRISPR/Cas9 mutagenesis in hematopoietic stem and progenitor cells demonstrated that it is necessary for and specifically regulates CEBPA expression during basophil differentiation. We additionally identified basophil count-associated variation at another more pleiotropic myeloid enhancer near GATA2, highlighting regulatory mechanisms for ordered expression of master hematopoietic regulators during lineage specification. Our study illustrates how population-based genetic studies can provide key insights into poorly understood cell differentiation processes of considerable physiologic relevance.
The human hematopoietic system is among the best understood paradigms of cell differentiation in physiology (1). However, despite our sophisticated understanding, many aspects of this process remain poorly understood. In particular, although hematopoiesis is perturbed in a variety of human blood disorders and shows considerable interindividual variation, the underlying basis of the disease etiology and variation remains incompletely understood. Genetic variation in hematopoiesis can be reflected in commonly measured laboratory values, such as hemoglobin levels or blood cell counts. Rare mutations disrupting genes involved in hematopoiesis can result in severe abnormalities in various blood cell counts (2). Common genetic variants affecting hematopoiesis can also subtly influence blood cell measurements in the general population and can alter the clinical manifestations in rare blood disorders (1, 3–5). Genetic studies offer a unique opportunity to gain insight into the hematopoietic system without being biased by our prior knowledge.
The Estonian Biobank is a population-based biobank that has collected DNA samples from 51,535 individuals representing ∼5% of the Estonian population (6). This cohort is composed of adults representative of the larger Estonian population in terms of age, sex, and geographic distribution. The biobank has particular value because electronic medical records (EMRs) in Estonia are centralized and all participants have consented to allow full access to their medical records, providing an excellent resource to investigate the underlying genetic basis for a variety of traits and diseases. Moreover, many of the samples from the biobank have undergone extensive genomic characterization, including single-nucleotide polymorphism (SNP) genotyping from 14,904 nonoverlapping individuals and PCR-free, high-coverage whole-genome sequencing (WGS) from 2,284 individuals. Here, to gain insight into hematopoiesis and regulatory mechanisms underlying this process, we have taken advantage of the valuable resource afforded by the Estonian Biobank to perform genetic association studies of all blood cell measurements available in this large population-based cohort.
Results
Study Overview.
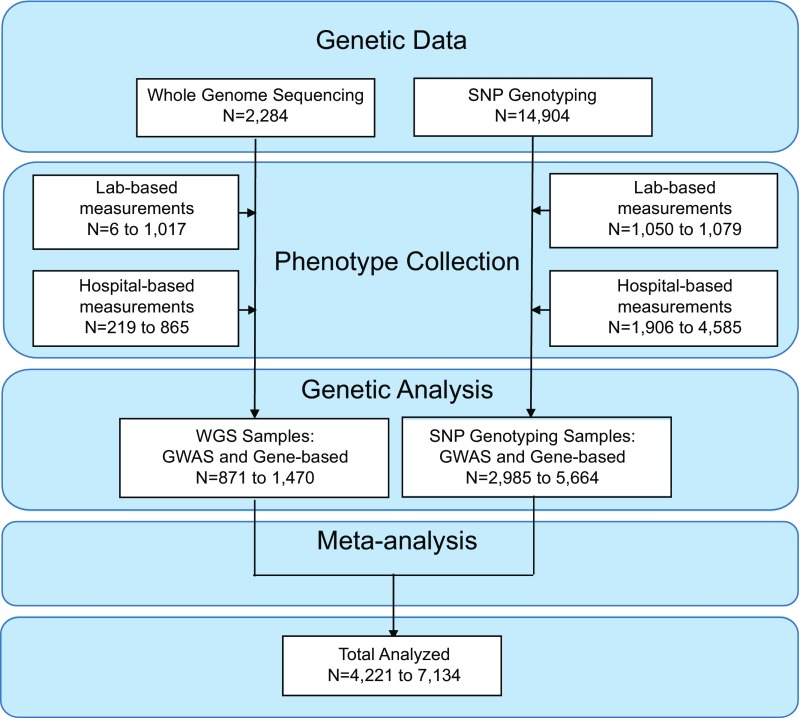
To perform the genetic association studies for blood cell traits, we used the WGS of 2,284 individuals and the SNP genotypes of 14,904 individuals from the Estonian Biobank. The WGS data underwent joint variant calling, followed by extensive sample and variant-level quality control (QC) (Dataset S1 and Fig. S1). The SNP genotypes were imputed to a custom reference panel constructed from the high-coverage Estonian Biobank WGS data. The custom imputation panel included all single-nucleotide variants present in the WGS with allele count of ≥3 in the WGS, representing a total of 16,536,512 imputed variants.
Fig. S1.
Flow diagram for genetic studies.
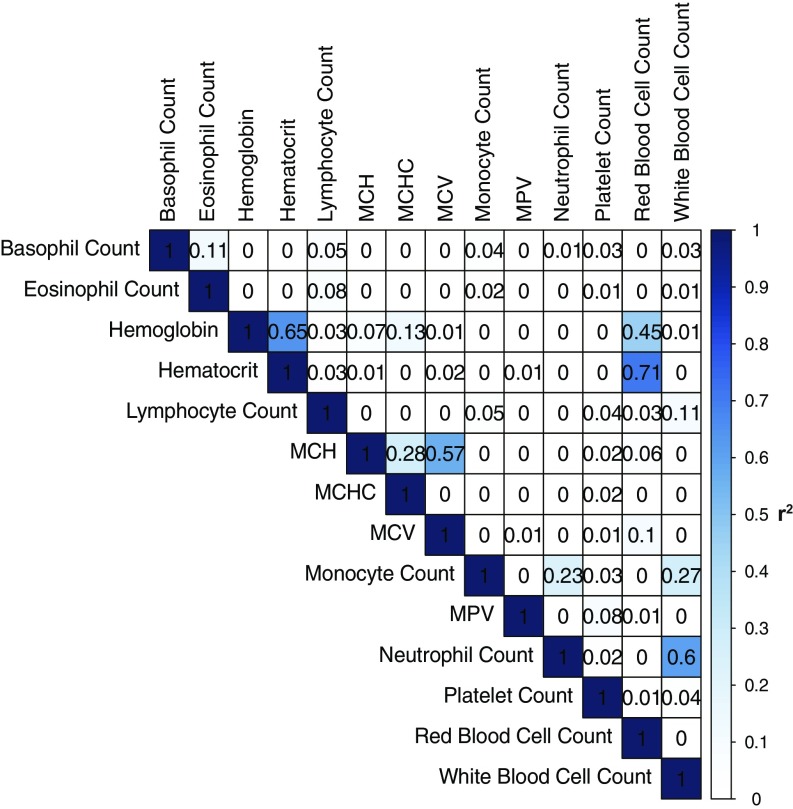
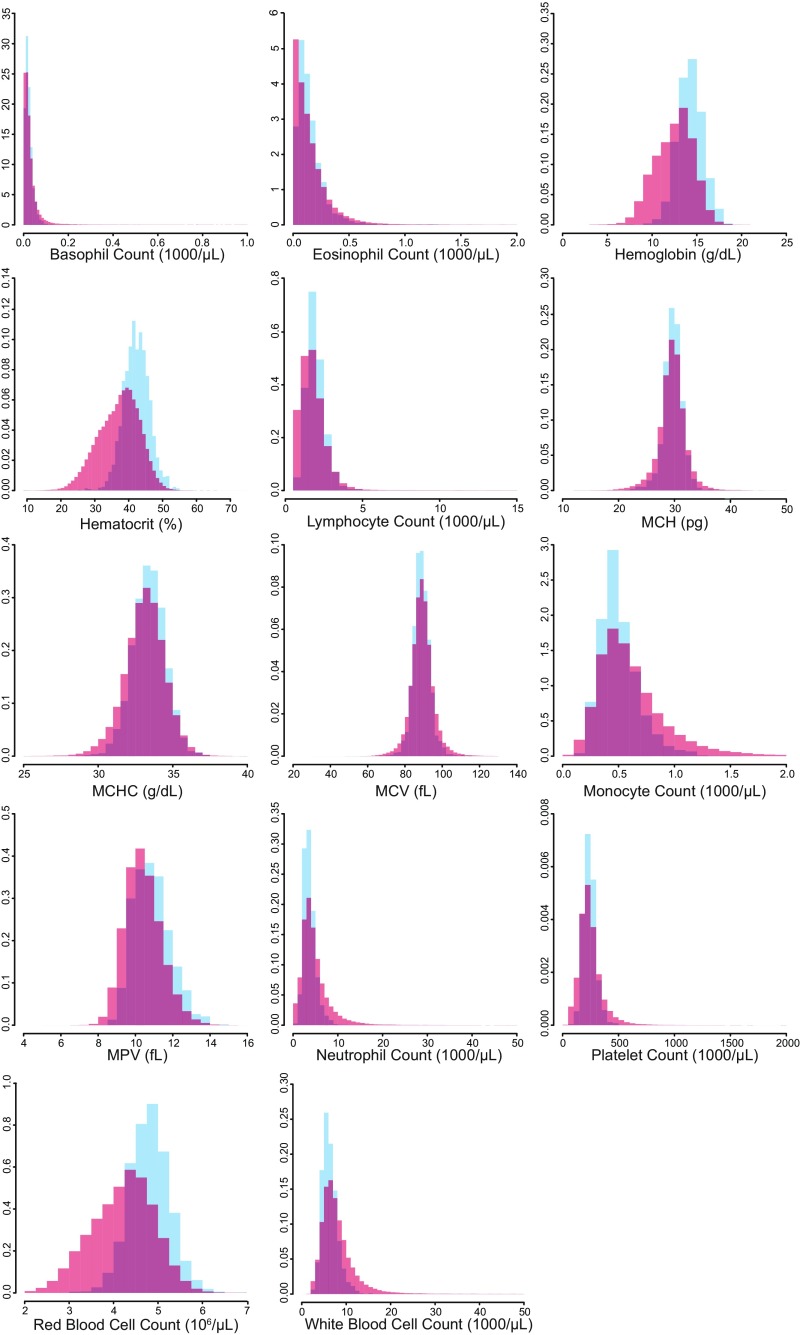
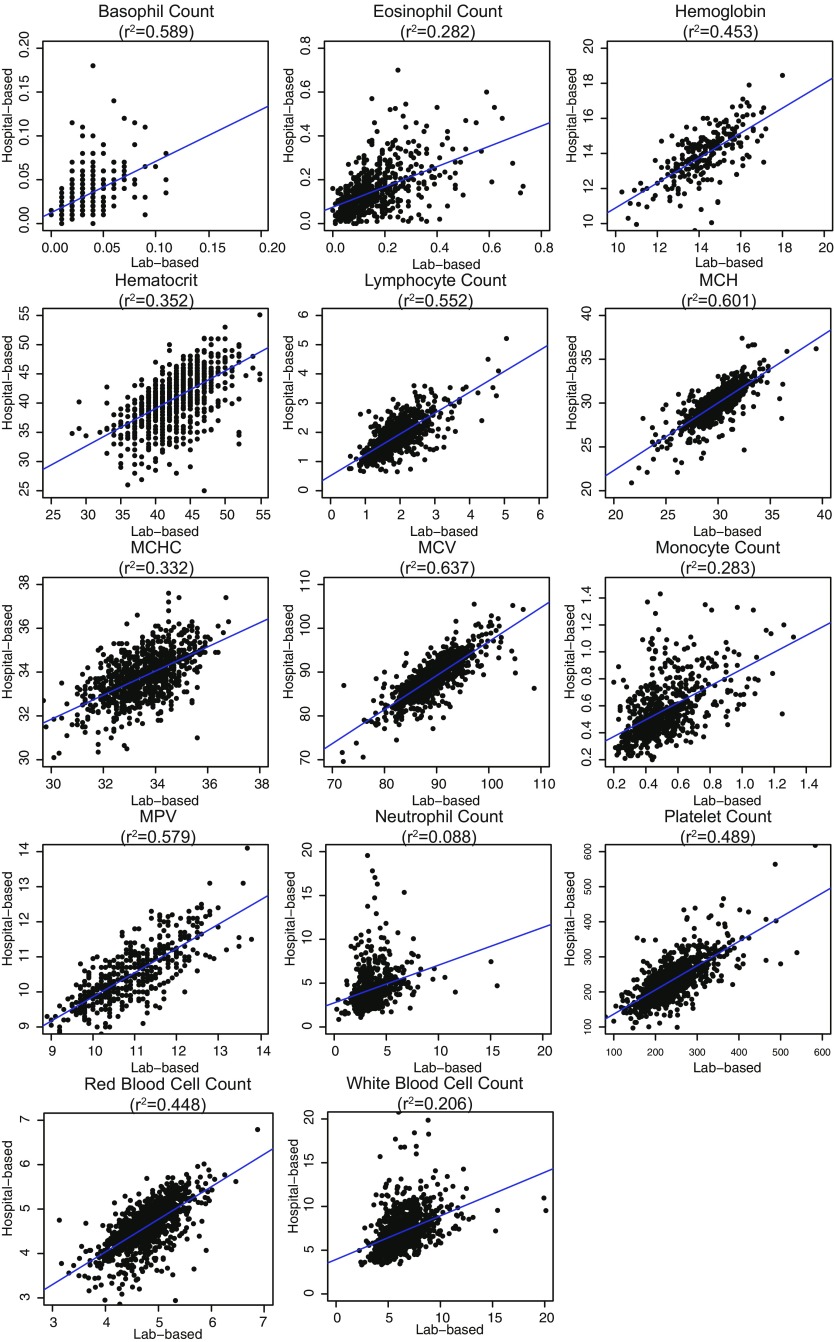
Using the genotype data described above, we tested for associations with 14 blood cell measurements. This included measurements reflective of red blood cell (RBC) numbers, size, and other related parameters [hemoglobin, hematocrit, RBC count, mean corpuscular volume (MCV), mean corpuscular hemoglobin (MCH), and mean corpuscular hemoglobin concentration (MCHC)]; platelet numbers and size [mean platelet volume (MPV)]; as well as white blood cell subtype numbers (absolute numbers of neutrophils, monocytes, lymphocytes, eosinophils, and basophils). As expected, these measurements are often strongly correlated with each other (Fig. S2). Because all individuals in the Estonian Biobank consented to provide access to their corresponding EMR data, we were able to greatly expand sample sizes in a resource-efficient manner. For a subset of randomly selected individuals, blood cell measurements were directly assayed in a clinical laboratory (hereafter referred to as “lab-based”) (Datasets S2 and S3 and Figs. S3 and S4). For most individuals, we mined the EMR to extract blood cell measurements when available. As each individual might have multiple measurements in the EMR, we used the median value for each individual after correcting for age, sex, location, and type of measurement (laboratory or EMR-based). In general, the laboratory-based and EMR-based values were strongly correlated; however, the measurements of certain traits, especially of white blood cell subtypes, were variable and had lower correlations (Fig. S4). In total, for each trait, we had between 4,221 and 7,134 samples with genotype and phenotype data (Dataset S2). We performed single-variant association analyses on all variants with a minor allele count of ≥3. We also performed gene-based burden testing of rare variants [minor allele frequency (MAF) < 5%] using SKAT-O (7).
Fig. S2.
Pairwise correlations of each of the 14 traits. Correlation r2 values are shown in the grid.
Fig. S3.
Trait histograms for each blood cell trait. For each blood trait, the distribution of laboratory-based measurements is shown in blue and measurements extracted from EMR records is shown in red.
Fig. S4.
Correlations of laboratory-based measurements (x axis) with EMR-based records (y axis) based on individuals with data from both sources.
Blood Cell Trait Associations in the Estonian Biobank.
The single-variant analysis revealed a total of 17 genome-wide significant associations (P < 5 × 10⁻⁸) across the various blood cell measurements (Table 1). Sixteen of these associations had been identified previously and highlight important biological mechanisms, such as associations at the HBS1L-MYB locus that contains at least three independent variants showing pleiotropy with multiple blood cell measurements (Dataset S4) (3, 8, 9). This locus is of considerable interest because the blood trait-associated variants within this region are associated with the severity of the major hemoglobin disorders, sickle cell disease and β-thalassemia (9–11). Other loci that we identified here contain well-known hematopoietic regulators such as JAK2 (associated with platelet counts) (12, 13) and F2RL2 (associated with MPV) (14). In contrast to the genome-wide association studies (GWASs) involving common variants, the gene-based burden testing (which seeks to aggregate rare variants in each gene) did not identify any significant associations (at P < 8.33 × 10⁻⁷). Although studies (such as ours) that use whole-genome sequencing rather than genotyping a fixed set of genetic markers have obvious advantages in terms of detecting rare variants (15), we note that our sample is likely underpowered for comprehensive rare-variant analysis, which is expected to require sample sizes in the range of tens of thousands of individuals (16).
Table 1.
Detailed summary of significant associations
| Locus | Position | Ref/Alt | rsID | MAF | WGS P value | Combined P value | Effect size | Variance explained | Trait | Gene | CS | CS+NDR |
| 19q13 | 33754548 | C/T | rs78744187 | 0.104 | 1.25 × 10⁻¹⁴ | 6.19 × 10−38 | −0.0059 (1,000/μL) | 0.044 | Basophil count | CEBPA* | 1 | 1 |
| 12q24 | 122216910 | A/G | rs11553699 | 0.100 | 0.0016 | 7.04 × 10⁻²⁰ | 0.048 (fL) | 0.011 | MPV | WDR66 | 1 | 1 |
| 3p14 | 56849749 | T/C | rs1354034 | 0.317 | 0.0012 | 1.29 × 10⁻¹⁴ | −0.033 (fL) | 0.012 | MPV | ARHGEF3 | 1 | 1 |
| 10q21 | 65063844 | T/A | rs61855497 | 0.369 | 0.0065 | 3.72 × 10⁻¹⁴ | −0.023 (fL) | 0.0085 | MPV | JMJD1C | 18 | 4 |
| 6q23 | 135423209 | T/C | rs9373124 | 0.308 | 0.00014 | 6.86 × 10⁻¹⁴ | 0.073 (pg) | 0.010 | MCH | HBS1L/MYB | 19 | 7 |
| 6q23 | 135419631 | A/G | rs9389268 | 0.304 | 0.0014 | 1.23 × 10⁻¹³ | 0.19 (fL) | 0.0070 | MCV | HBS1L/MYB | 21 | 8 |
| 6q23 | 135419636 | C/T | rs9376091 | 0.304 | 0.011 | 6.96 × 10⁻¹² | −0.021 (106/μL) | 0.0044 | Red blood cell count | HBS1L/MYB | 20 | 10 |
| 3q21 | 128296273 | G/A | rs2465283 | 0.101 | 0.0014 | 9.99 × 10⁻¹² | −0.0028 (1,000/μL) | 0.0077 | Basophil count | GATA2 | 11 | 1 |
| 7q22 | 106370644 | C/G | rs342292 | 0.487 | 0.00062 | 3.26 × 10⁻¹¹ | 0.032 (fL) | 0.013 | MPV | PIK3CG | 46 | 6 |
| 9q31 | 113918856 | A/G | rs10980802 | 0.491 | 3.04 × 10⁻⁶ | 5.06 × 10⁻¹¹ | −0.020 (1,000/μL) | 0.016 | Monocyte count | LPAR1† | 18 | 0 |
| 9p24 | 4763491 | G/A | rs12005199 | 0.332 | 0.028 | 1.17 × 10⁻⁹ | 2.8 (1,000/μL) | 0.0033 | Platelet count | JAK2 | 1 | 1 |
| 3p14 | 56849749 | T/C | rs1354034 | 0.319 | 0.015 | 4.40 × 10⁻⁹ | 2.6 (1,000/μL) | 0.0040 | Platelet count | ARHGEF3 | 1 | 1 |
| 6q23 | 135431640 | T/C | rs9494142 | 0.254 | 2.16 × 10⁻⁵ | 7.51 × 10⁻⁹ | 5.3 (1,000/μL) | 0.012 | Platelet count | HBS1L/MYB | 22 | 7 |
| 11p15 | 242859 | A/G | rs55781332 | 0.264 | 0.043 | 1.42 × 10⁻⁸ | −0.022 (fL) | 0.0047 | MPV | PSMD13 | 35 | 6 |
| 6p21 | 33545125 | A/G | rs5745587 | 0.274 | 0.0011 | 2.81 × 10⁻⁸ | 4.1 (1,000/μL) | 0.0072 | Platelet count | BAK1 | 23 | 2 |
| 5q13 | 75935631 | A/T | rs114685606 | 0.0230 | 0.53 | 3.41 × 10⁻⁸ | 0.011 (fL) | 0.00046 | MPV | F2RL2 | 3 | 1 |
| 22q12 | 37470224 | T/C | rs2413450 | 0.459 | 0.0052 | 3.58 × 10⁻⁸ | 0.060 (pg) | 0.0054 | MCH | TMPRSS6† | 5 | 0 |
Both the WGS and combined (WGS plus SNP genotyping) P values are listed. Effect sizes (per minor allele) are based on untransformed trait values in the WGS only. Variance explained is based on inverse normal transformed trait values in the WGS only. CS column shows the number of variants in the CS. CS+NDR column shows the number of CS variants overlapping an ATAC-seq NDR.
Indicates previously undiscovered locus.
Indicates presence of a genic variant in CS.
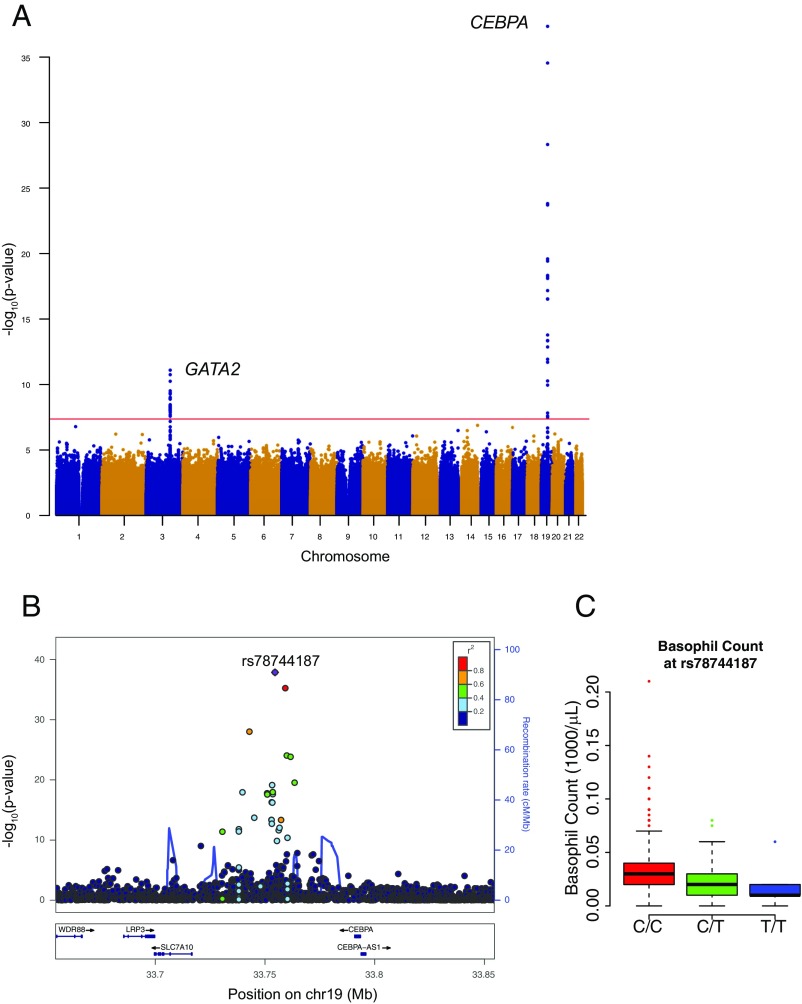
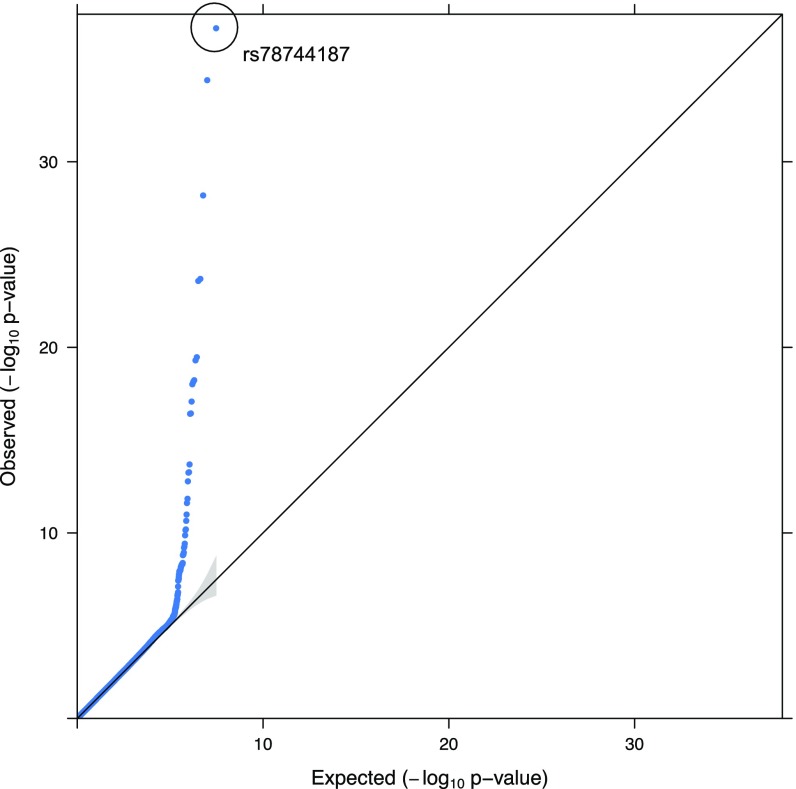
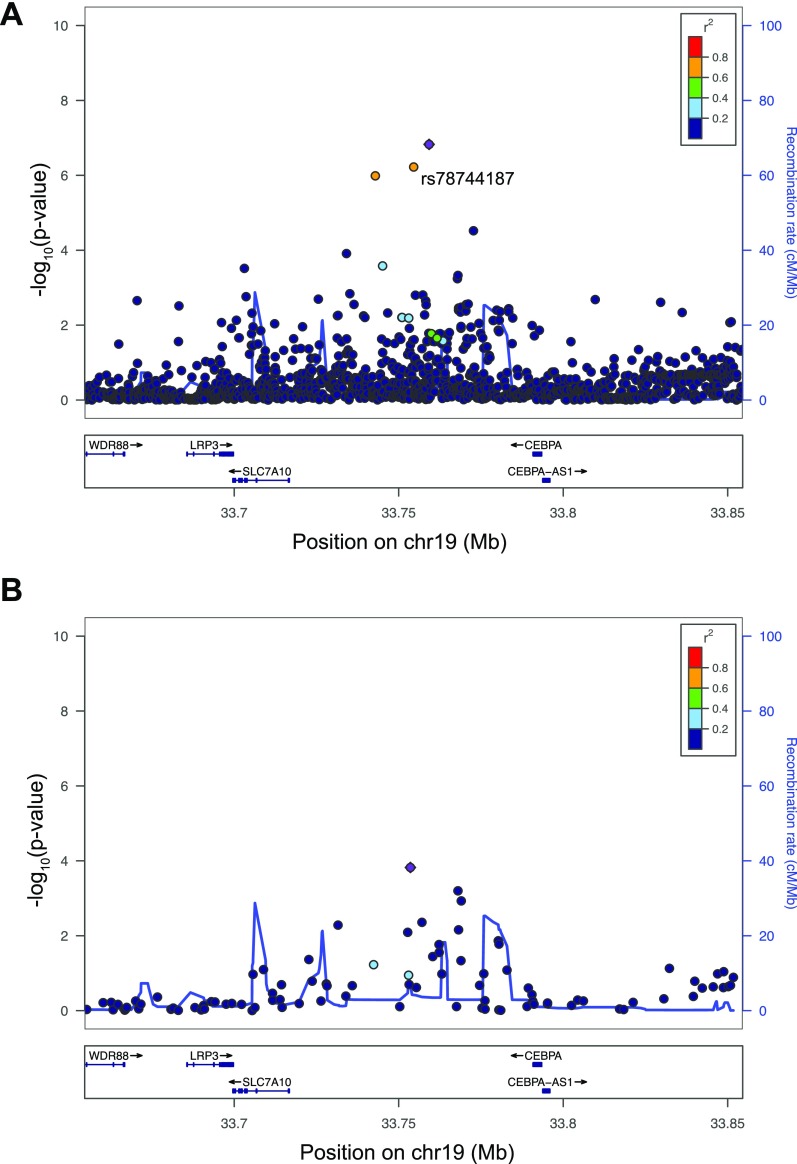
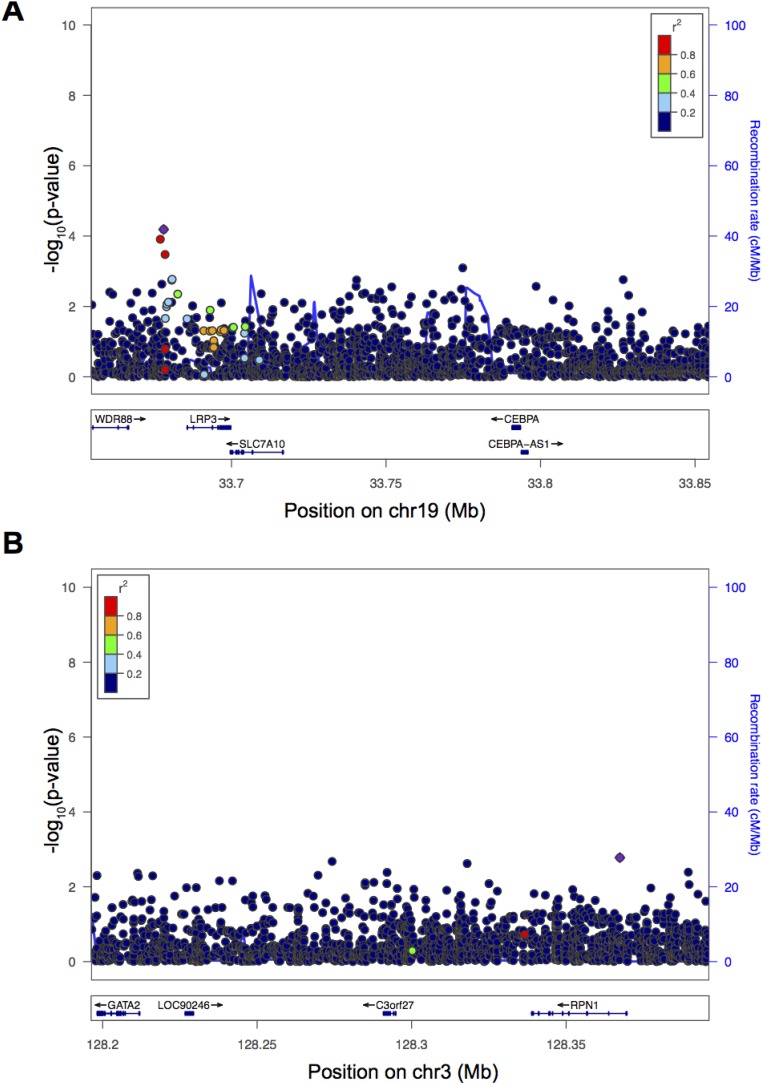
The strongest effect identified was a previously undiscovered association with basophil counts near the gene encoding CCAAT/enhancer-binding protein alpha (CEBPA) (rs78744187; P = 6.19 × 10−38) (Fig. 1 and Fig. S5). Each minor allele of this SNP is associated with a 5.9 (per microliter) decrease in basophil counts and the SNP remarkably explains 4.4% of phenotypic variance (Table 1). To ensure that this association is not driven by extreme or spurious values from EMR-based measurements, we validated the association using only laboratory-based measurements with outliers removed (P = 3.31 × 10⁻¹⁵). Furthermore, to ensure that this association is not population-specific, we examined this SNP in 7,488 individuals from three US-based European ancestry cohorts and observed a significant association with basophil counts (P = 5.99 × 10⁻⁷; Fig. S6A). Despite the remarkably large effect size of this SNP, previous GWAS for basophil counts have not detected this association (17–19). This is likely because previous studies were imputed to a sparser reference panel (HapMap). Because none of the variants present in HapMap tag rs78744187 strongly, these studies would have failed to detect this association (Fig. S6B). This observation demonstrates how denser reference panels or comprehensive genome sequencing data can enable the discovery of additional common variants associated with human traits and diseases.
Fig. 1.
Basophil count association near CEBPA. (A) Manhattan plot for single-variant association study for basophil counts. Genome-wide significant associations near GATA2 and CEBPA are marked. (B) Locuszoom plot shows association strength, LD, and recombination event frequency. (C) Basophil counts by genotype of rs78744187.
Fig. S5.
Quantile–quantile (QQ) plot for basophil count association. The lead SNP (rs78744187) near CEBPA is marked. The 95% confidence interval is shown as a gray band.
Fig. S6.
Replication of rs78744187 association in dbGaP cohorts. (A) Locuszoom plot of basophil count in three US-based dbGaP cohorts when imputed to 1000 Genomes phase 1. (B) Locuszoom plot of basophil count in the same three US-based dbGaP cohorts when imputed to HapMap phase 3.
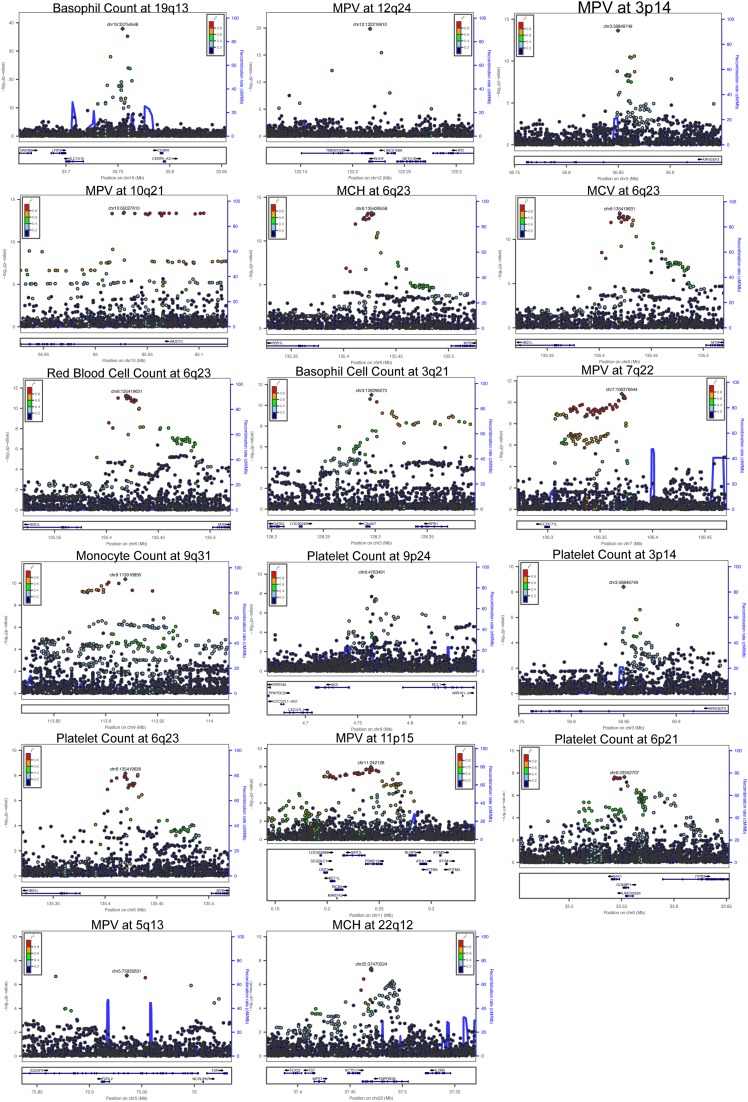
To assess the comprehensiveness of our analysis (Fig. S7), we compared all of the variants identified by genome sequencing at each locus with the 1000 Genomes (1000G) reference panel (20). Although our study identified variants in significant linkage disequilibrium (LD) with the lead SNP (r2 > 0.5) that were absent from the 1000G phase 1 reference panel, all of these variants were present in phase 3 (21). Importantly, no variants identified in significant LD with the lead SNP (r2 > 0.5) in 1000G were missing from our analysis. In addition, there were no copy number variants (CNVs) within 1 Mb that were in LD (r2 > 0.5) with any of the observed associations (Dataset S5). Given these results, we were confident that all potential causal variants had been captured by our analyses and our custom WGS-based reference panel was genuinely reflective of the study population, which are both important prerequisites for fine-mapping.
Fig. S7.
Locuszoom plots showing association signals performed using the pre-QC Estonian WGS as an imputation panel.
Fine-Mapping Genetic Associations.
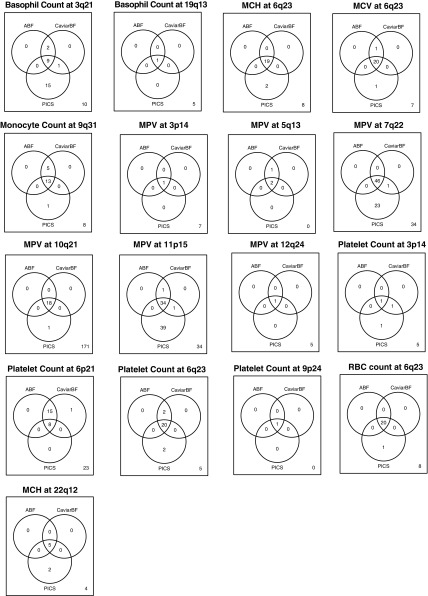
Although most of the associations have been previously detected, none have yet been pinpointed to specific variants. To attempt to identify the likely causal variant at each locus, we performed statistical fine-mapping analyses, which use LD patterns and association statistics to generate the probability that any particular variant at a locus of interest is causal. We applied three methods for fine-mapping [approximate Bayes factor (ABF), CaviarBF, and PICS] (22–24) and, for each, generated a credible set (CS) of variants, which has a 97.5% probability of containing the casual variant. The CSs generated with ABF and CaviarBF exhibited near-perfect concordance, whereas the CSs generated with PICS, although in strong agreement at most loci, included substantially more variants for three of the loci (Fig. S8). As these additional variants nominated solely by PICS were generally of low r2 to the sentinel association, the intersection of ABF and CaviarBF was chosen as the final CS. Remarkably, at 4 of the 13 independent loci (MPV/platelet counts at 3p14, platelet counts at 9p24, MPV at 12q24, and basophil counts at 19q13), our fine-mapping results resolved the association signal to a single putative causal variant. At two other loci, the CSs had three and five variants (Table 1 and Dataset S6). Thus, by resolving association signals to a finer resolution, we are able to generate experimentally tractable hypotheses about potential causal mechanisms, as we discuss in detail below. For the remaining 10 associations, the CSs have between 11 and 46 variants (median of 20).
Fig. S8.
Venn diagrams comparing fine-mapping procedures are shown for the overlap of variants in 97.5% CSs derived using ABF, CaviarBF, and PICS.
Overlap with Epigenomic Data Suggests Causal Mechanisms.
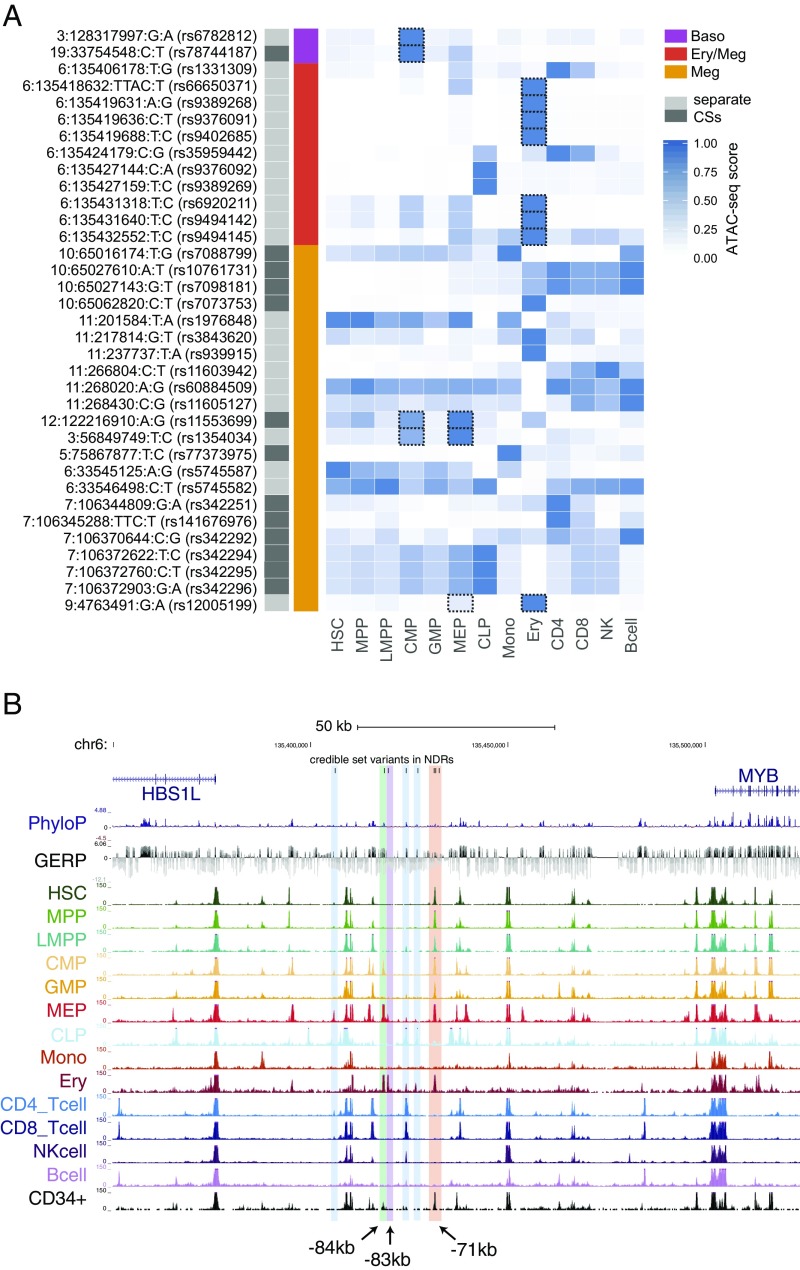
An estimated 80–90% of causal GWAS signals are noncoding variants that presumably act by altering expression of nearby genes (25, 26). To define potential causal mechanisms of the variants, we overlapped CS variants with nucleosome-depleted regions (NDRs) identified by assay for transposase-accessible chromatin with high-throughput sequencing (ATAC-seq) from 13 primary human cell types (27), comprising the majority of the hematopoietic hierarchy. For 35 CS variants (out of 186 variants from 17 loci; 18.8%), we identified an overlap with hematopoietic NDRs, a significant enrichment compared with non-CS variants in moderate to high LD (r2 > 0.5) (OR = 2.41, P = 0.0009). Additionally, a permutation test involving local shifting of the NDRs around the CS variants revealed a significant enrichment (1.87-fold change in overlap, P = 0.00042) (28). Furthermore, at 11 of 13 independent loci (85%), at least one CS variant overlapped a NDR (Fig. 2A). Of note, only the remaining two loci contained a genic variant in their CSs (Table 1). At TMPRSS6 associated with MCH, there is a missense variant (rs855791, p.V736A) in strong LD with the lead SNP (r2 = 0.82). Rare damaging mutations in TMPRSS6 cause iron-refractory iron-deficient anemia, and this particular variant has been previously reported to influence iron homeostasis (29, 30). At the 9q31 locus associated with monocyte counts, there are two variants (rs59364245 and rs60698178) located in an uncharacterized long noncoding RNA.
Fig. 2.
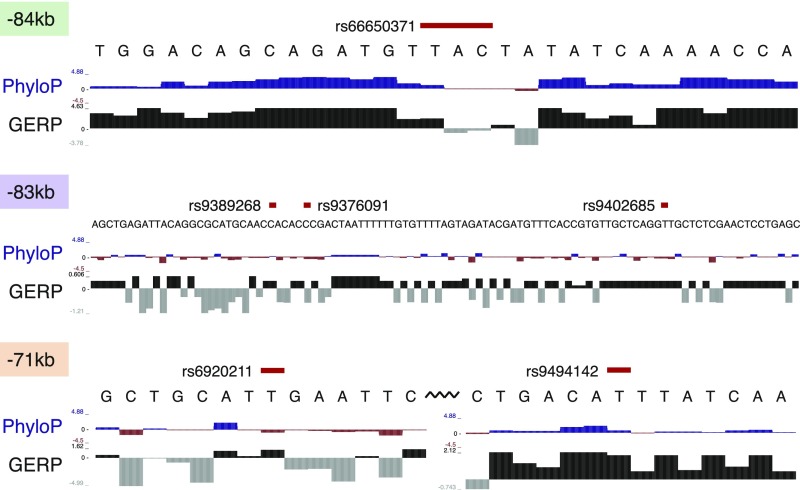
Integration of ATAC-seq data with fine-mapping results sheds mechanistic insights. (A) CS variants that overlap with NDRs in the 13 hematopoietic cell types are shown. Quantile-normalized read counts per million were min-max scaled for each row. Based upon manual investigation, variants that overlapped with a NDR that was not within the top 20% of NDRs for at least 1 of the 13 cell types were excluded. Variants that fall within lineage-specific NDRs of clear relevance to their associated phenotypes are highlighted with dashed boxes. (B) Eleven of the variants in the combined CS for the HSB1L/MYB locus association with multiple red cell and platelet associations lie within six separate hematopoietic enhancer elements. The three MEP/erythroid-specific elements are shown in green (−84 kb), purple (−83 kb), and red (−71 kb). rs9494145 resides within a weaker −70-kb element and is included in the same highlight as the substantially more nucleosome-depleted −71-kb element.
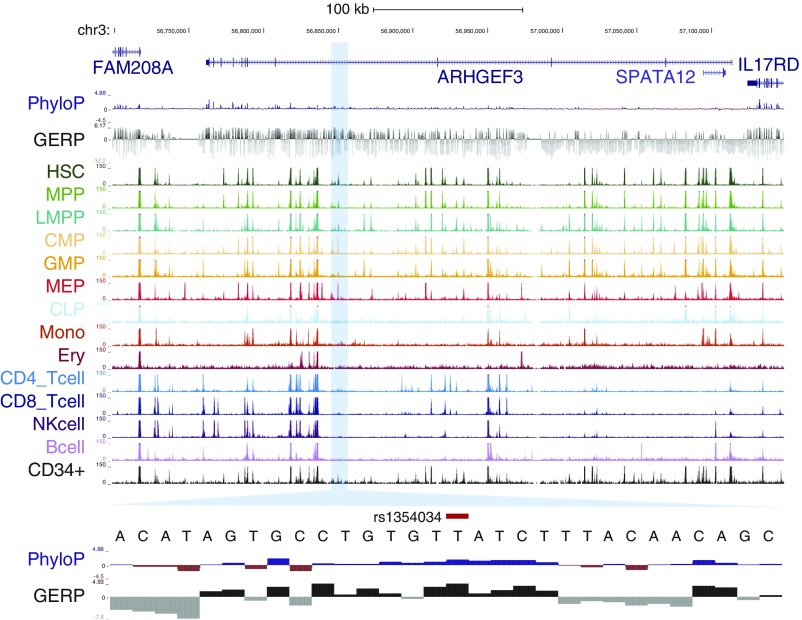
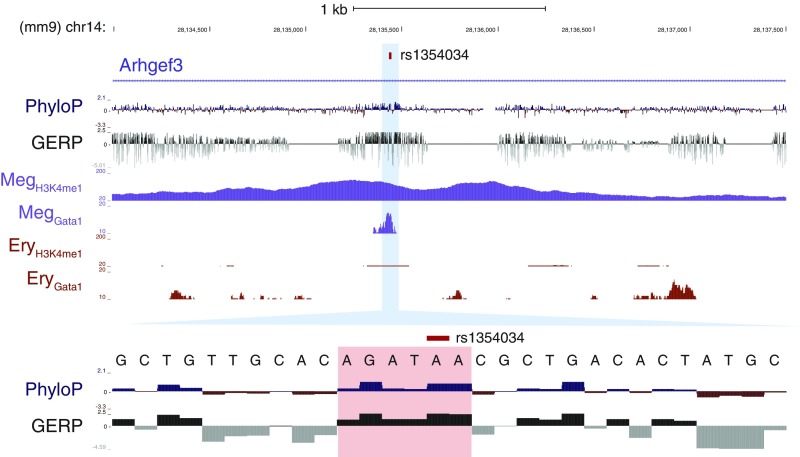
For example, at the well-known HBS1L-MYB locus (8), 11 variants associated with multiple red blood cell and platelet traits overlap with a NDR in at least one stage of hematopoiesis. Seven of these variants overlap with predominately erythroid-specific NDRs (Fig. 2 A and B). Although our results agreed with previous studies that variants in the −84- and −71-kb elements are putative functional variants (31), we also identified a previously uncharacterized −83-kb erythroid element harboring three CS variants that may also have regulatory function (Fig. S9). Notably, for all four of the association signals that we fine-mapped to a single variant, the identified variant overlaps with a hematopoietic NDR (Table 1). As an example, we were able to fine-map the association with MPV and platelet counts on 3p14 to rs1354034. This variant overlaps with a common-myeloid progenitor (CMP)- and megakaryocyte-erythroid progenitor (MEP)-specific regulatory element that has previously been shown to affect the transcription of nearby ARHGEF3, a factor implicated in hematopoiesis (Fig. 2A and Fig. S10) (32). Interestingly, the rs1354034 variant is associated (in trans) with the expression of von Willebrand factor (VWF) and other key platelet/megakaryocyte genes found at other loci, suggesting a role for this variant in the development of this lineage (33, 34). In all of these examples, our comprehensive ascertainment of genetic variation gave us confidence that the causal variant is included among the variants we analyzed.
Fig. S9.
Multiple variants in strong LD overlap with erythroid-specific elements at the HBS1L/MYB locus. The −84- and −71-kb elements have previously been identified as harboring putative causal variants, whereas the −83-kb element is a unique putative enhancer element containing three CS variants.
Fig. S10.
The finely mapped MPV-associated variant rs1354034 lies within a MEP element. rs1354034, the single variant in the CS for the MPV association at 3p14, is within a CMP/MEP-specific NDR in an intron of the gene ARHGEF3. The variant itself falls within an evolutionarily conserved motif for a GATA factor (TTATCT).
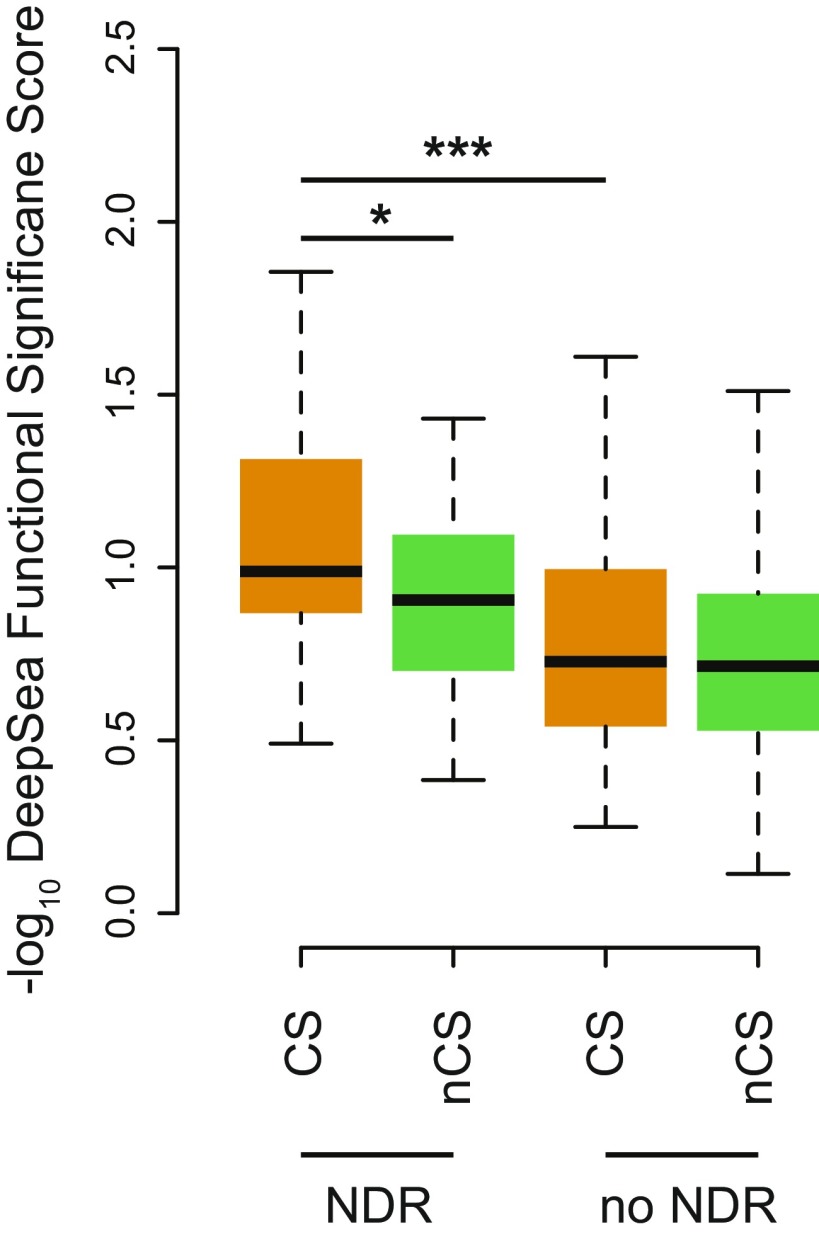
To further explore the putative regulatory modalities of these CS variants, we investigated the overlap of CSs with transcription factor (TF) occupancy, functional regulatory models, and predicted motif disruptions. Based upon functional models trained on TF occupancy, open chromatin, and histone modifications, CS variants were enriched for functional regulatory variants (Fig. S11) (35). Because TF occupancy profiles were not available for the entire hematopoietic hierarchy, we inferred putative TF overlap by investigating the overlap of CS variants with 4,559 publicly available ChIP-seq datasets from human blood-based tissues and cell lines. These analyses revealed putative mechanisms for a number of variants and provide testable hypotheses, which are particularly tractable for the four CSs containing only a single variant (Datasets S7 and S8). For example, rs1354034, which we described above as being within a NDR near ARHGEF3, disrupts a conserved GATA motif. In addition, Gata1 occupies the orthologous mouse region containing this variant in megakaryocytes, but not erythroid cells, suggesting a putative mechanism by which this variant may act (Fig. S12).
Fig. S11.
Functional significance scores by group from the neural net DeepSea model (trained on 919 chromatin features). Mann–Whitney U one-sided test used between CS variants and non-CS variants in moderate to high LD (r2 > 0.5) (*P < 0.05; ***P < 0.0001).
Fig. S12.
rs1354034 is occupied by Gata1 in megakaryocytes and disrupts a canonical GATA motif in mice. At the orthologous locus for rs1354034 in mouse, Gata1 occupies its canonical motif in megakaryocytes but not in erythroid cells. rs1354034 disrupts this motif, suggesting a putative mechanism for this fine-mapped variant.
Basophil Associations Illuminate Mechanisms for Hematopoietic Lineage Specification.
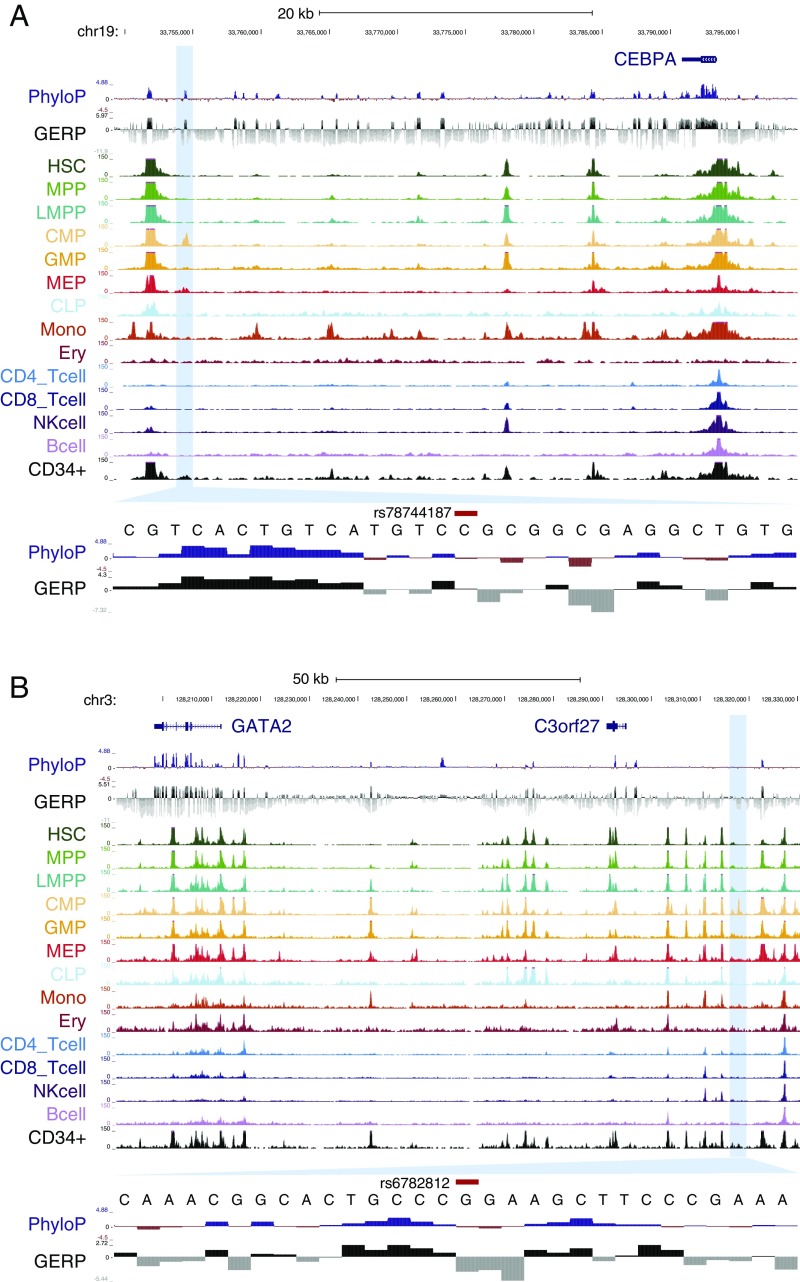
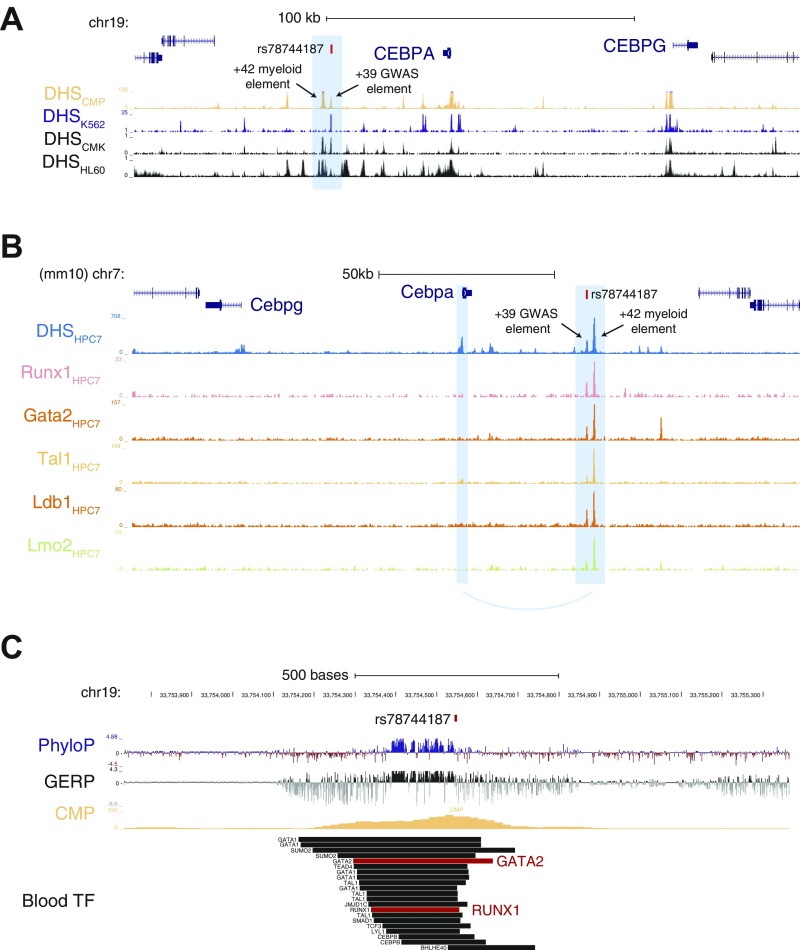
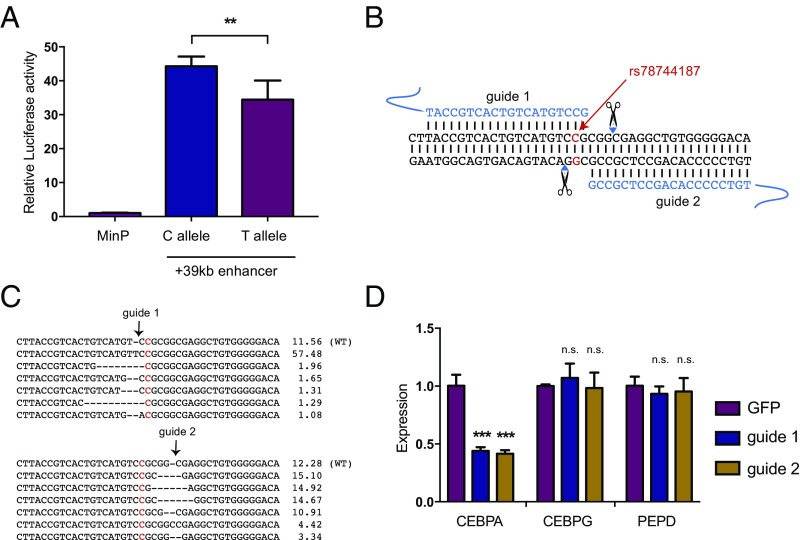
We next turned to the association with basophil counts at 19q13 near CEBPA. As we noted above, this locus could be resolved to a single putative causal variant, rs78744187, which resides 39 kb downstream from CEBPA, near a separate +42-kb enhancer that has been shown to influence CEBPA expression along various myeloid lineages (36–38). rs78744187 appeared to be solely associated with basophil counts and showed no evidence of pleiotropic effects on other blood cell traits, including among other myeloid lineages (Dataset S4). Conditioning the association on the rs78744187 genotypes attenuated all signals at the locus, suggesting the existence of only one independent signal at the locus (Fig. S13). Interestingly, rs78744187 resides within a distinct NDR present only in CMPs, but not in granulocyte–monocyte progenitors (GMPs), consistent with emerging data for a GMP-independent origin for basophils, mast cells, eosinophils, and their progenitors (Fig. 3A) (39–42). Moreover, this NDR is weakly to moderately present in myeloid cell lines from mice and humans (HL60, K562, HPC7, and CMK) and is occupied by numerous myeloid transcription factors, including master regulators of myeloid differentiation: GATA2 and RUNX1 (Dataset S7 and Fig. S14). In a luciferase reporter assay, the +39-kb region demonstrated enhancer activity (∼40-fold increase in activity relative to the minimal promoter) in the K562 myeloid cell line. Additionally, the basophil count-decreasing rs78744187-T allele was associated with a 28.6% reduction in enhancer activity (Fig. 4A). Despite extensive analyses of TF occupancy and alterations to predicted TF motif, we were unable to elucidate an exact mechanism for how this variant modulates enhancer activity, as is frequently noted to be the case for putative causal variants that alter gene expression (4, 24). Taken together, these data show that the +39-kb region contains a myeloid enhancer element that is active in CMPs and that shows variation in activity modulated by the rs78744187 variant.
Fig. S13.
Conditional analyses for basophil count-associated loci. (A) Locuszoom plot for basophil counts at 19q13, conditioned on the sentinel SNP rs78744187. (B) Locuszoom plot for basophil counts at 3q21, conditioned on the sentinel SNP rs2465283.
Fig. 3.
Overlap of basophil-associated variants with hematopoietic regulatory elements. (A) Overlap of rs78744187 with NDRs in hematopoietic progenitors and their terminal progeny. Conservation across 100 vertebrates (PhyloP) or mammals (GERP) is also shown. A conserved motif element is observed proximal to rs78744187. (B) Similar to A except for rs6782812. Two conserved motif elements can be observed nearby.
Fig. S14.
NDRs and TF occupancy in blood cells for rs78744187. (A) The +39-kb element harboring rs78744187 is an NDR in multiple myeloid cell lines in addition to CMPs. (B) The orthologous +39-kb element in a mouse hematopoietic progenitor cell line is clearly defined and is occupied by key myeloid TFs such as GATA2 and RUNX1. (C) Within the +39-kb element, rs78744187 is also occupied by GATA2 and RUNX1 in human blood cells.
Fig. 4.
rs78744187 modulates the activity of a CEBPA enhancer. (A) A 400-bp genomic region containing rs78744187 shows allele-specific enhancer activity in K562 cells by luciferase assay (**P < 0.01). (B) Schematic of CRISPR/Cas9 disruption at the +39-kb myeloid enhancer. (C) Mobilized peripheral blood CD34+ cells were infected with lentiviral CRISPR/Cas9 constructs. Indel frequency was measured at day 14 by deep sequencing, and the top six indels are shown. (D) Expression of transcribed genes in the TAD containing rs78744187 after enhancer disruption at day 7 (quantitative RT-PCR). Results are reported as mean and SD across three independent experiments (n.s., not significant; ***P < 0.0001).
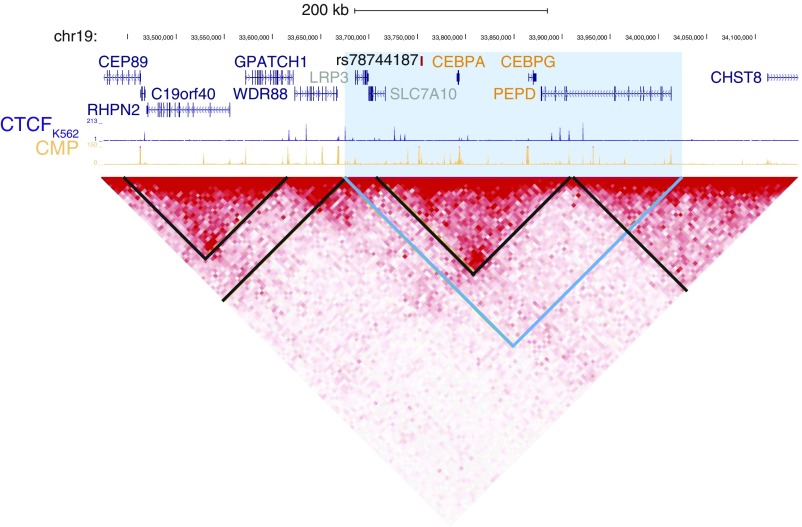
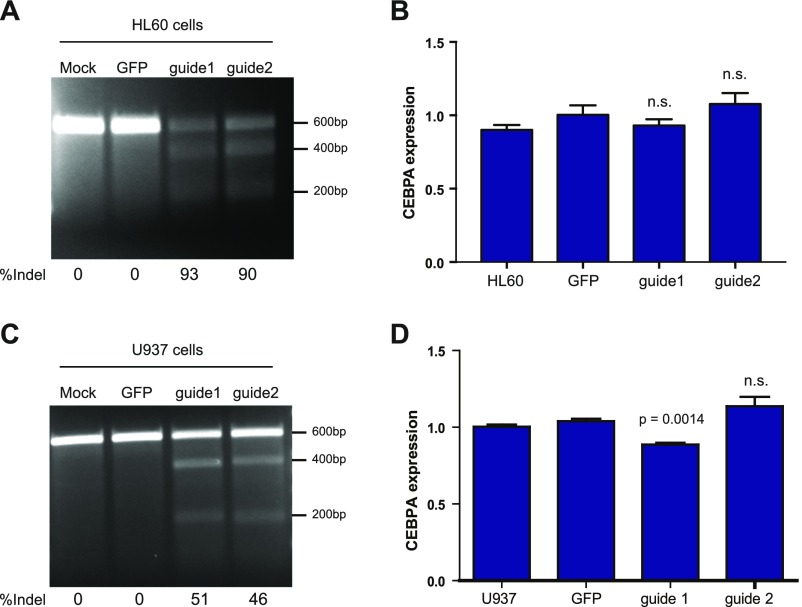
To identify the gene(s) whose expression is modulated by rs78744187 to influence basophil production, we performed in situ perturbation of the +39-kb enhancer using CRISPR/Cas9-mediated mutagenesis in CD34+ human hematopoietic stem and progenitor cells (HSPCs) (43). We targeted the +39-kb enhancer using two guides that flank the rs78744187 variant (Fig. 4B). Deep sequencing of the target regions showed that both guide RNAs caused insertions or deletions at a high efficiency (∼88%) (Fig. 4C). We observed a 60% reduction in CEBPA expression in the nonclonal population of enhancer-disrupted hematopoietic cells compared with controls (Fig. 4D). As enhancer-promoter looping interactions primarily occur within topologically associated domains (TADs), we investigated all other expressed genes in the TAD harboring this variant but did not observe any significant changes in their expression (Fig. 4D and Fig. S15) (36). Interestingly, perturbation of this element in the granulocyte/monocyte cell lines HL60 and U937 did not result in any major alteration of CEBPA expression (Fig. S16), demonstrating the specificity of this regulatory element during basophil differentiation.
Fig. S15.
TAD containing rs78744187. Interaction frequency based upon Hi-C for K562 cells is shown as a triangular heat map. Contact domain boundaries are shown in black. The blue triangle contains the full gene bodies of all genes within or at the border of the contact domain containing rs78744187. Within this region, expressed genes, based upon qRT-PCR in primary cell culture, are in orange, whereas lowly expressed genes are in gray.
Fig. S16.
The +39-kb enhancer does not regulate CEBPA expression in granulocyte/monocyte cell lines. (A and C) Efficient CRISPR/Cas9-mediated disruption of the +39-kb enhancer at day 12 postinfection in bulk HL60 and U937 cells as demonstrated by Surveyor assay. (B and D) CEBPA expression at day 12 postinfection in bulk HL60 and U937 cells measured by qRT-PCR.
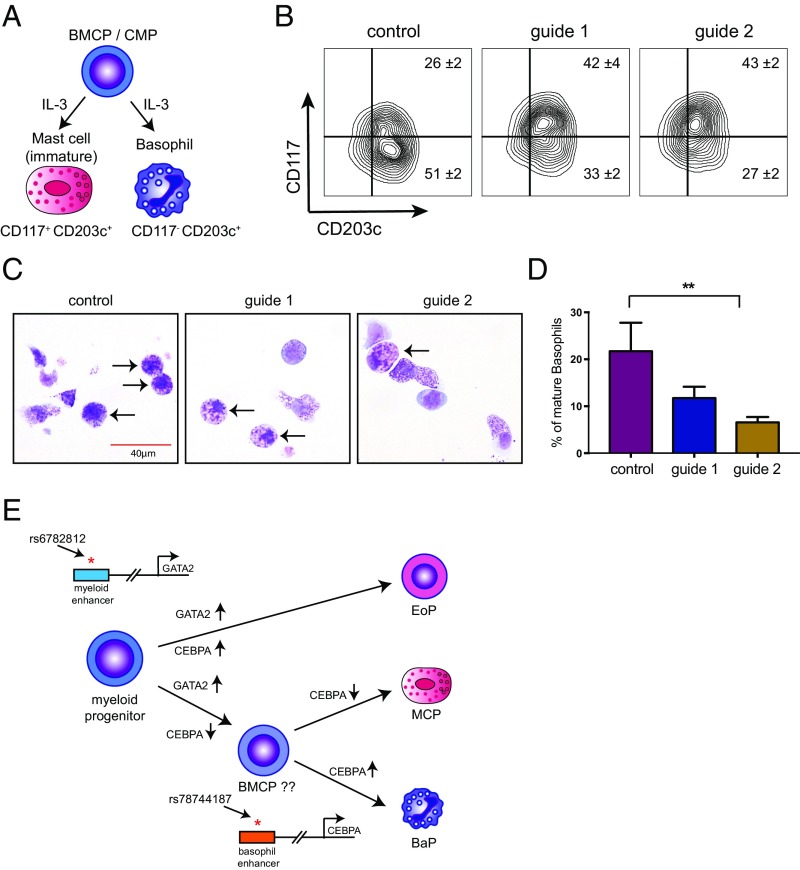
The TF CEBPA has been previously implicated in basophil specification, in particular during the bifurcation from the developmentally related mast cell lineage (44–46). However, CEBPA is also implicated more broadly in hematopoiesis as a master TF (36, 47, 48), suggesting that its expression is temporally regulated to specify basophils and other terminal lineages (49). To test whether the +39-kb enhancer provides the temporal regulation of CEBPA expression for proper basophil differentiation, we performed directed differentiation of the CRISPR/Cas9 enhancer-mutagenized HSPCs in the presence of IL-3 (50–52). IL-3–mediated differentiation of human CD34+ cells predominately generates basophils but can generate mast cells to a lesser degree (50, 53, 54). Following 2 wk in culture, ∼51% of cells expressed basophil surface marker phenotypes (CD203c+/CD117−) and ∼26% of cells expressed mast cell marker phenotypes (CD203c+/CD117+) (Fig. 5B). Morphologically, 25% of the cells in these cultures resembled mature basophils, suggesting that our cultures may also accommodate less mature precursors of these lineages as well, which is in agreement with the observation that the CD203c antibody can detect mature human basophils, mast cells, and their precursors (53). The enhancer-mutagenized cells showed a significant reduction in basophil production based upon cell surface markers and morphology, as well as a proportionate increase in immature mast cells compared with controls (Fig. 5 A–D and Fig. S17). In addition, the basophils produced in the enhancer-mutagenized cells frequently showed impaired maturation with a paucity of basophilic granules and a high frequency of empty or eosinophilic granules instead (Fig. 5 C and D). These results demonstrate that an intact +39-kb enhancer is required for proper expression of CEBPA during basophil differentiation and maturation. Alternatively, the +39-kb CEBPA enhancer may regulate cytoplasmic granule development in basophils, independent of its effects on differentiation. Our results also extend earlier studies in mice that suggested a key role for Cebpa in modulating the basophil/mast cell lineage fate choice (55, 56).
Fig. 5.
An intact +39-kb CEBPA enhancer is required for human basophil differentiation. (A) IL-3–mediated differentiation of primary human CD34+ cells generates both basophils and mast cells from a myeloid progenitor that may either be a basophil/mast cell progenitor (BMCP) and/or derivative of the common myeloid progenitor (CMP) population. (B) FACS analysis shows impaired differentiation of basophils and a concomitant increase in mast cells after +39-kb enhancer disruption (mean ± SD of three independent experiments). (C) Representative images of May–Giemsa stains at day 14. Arrows indicate fully differentiated, mature basophils in the left panel, whereas the arrows indicate cells with abnormal basophilic and some eosinophilic granules in the +39-kb enhancer-disrupted cultures. (D) Impaired maturation of basophils based upon morphology in May–Grünwald Giemsa stains. Student’s t test performed between control vs. both guides (**P < 0.01). (E) Previous studies have shown that ordered expression of GATA2 and CEBPA is critical for differentiation of eosinophils, basophils, and mast cells. Our GWAS follow-up study has identified enhancers that, at least partially, mediate this ordered expression pattern. Up-regulation of GATA2 is required for all three lineages. Accordingly, the rs6782812 variant in the GATA2 locus is associated with both eosinophil and basophil counts. Up-regulation of CEBPA is required only for basophil differentiation from BMCPs and/or CMPs. Accordingly, the rs78744187 variant in the CEBPA locus is associated with basophil counts and affects basophil differentiation. BMCP, basophil/mast cell progenitor; BaP, basophil progenitor; EoP, eosinophil progenitor; MCP, mast cell progenitor.
Fig. S17.
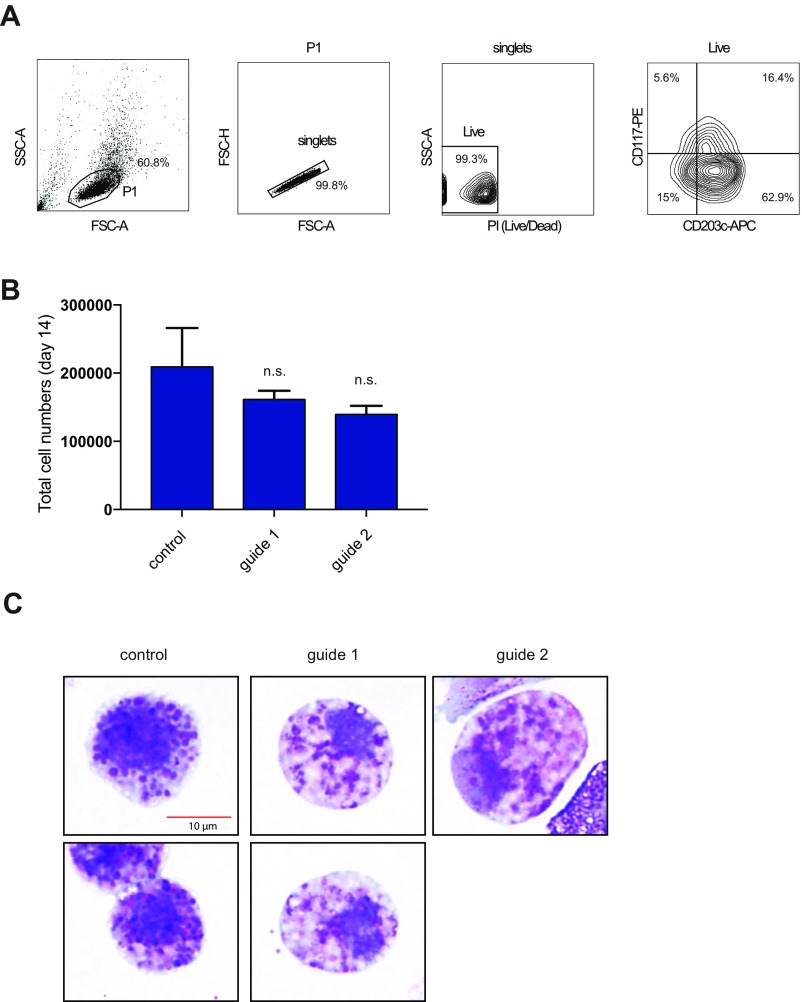
The +39-kb enhancer disruption does not affect cell proliferation during basophil/mast cell differentiation from human CD34+ cells. (A) Flow gating strategy used to quantify mast cells and basophils. (B) Total cell numbers at day 14 of human CD34+ cells culture in IL-3. (C) Representative zoomed-in images of single basophils from different conditions in Fig. 5C.
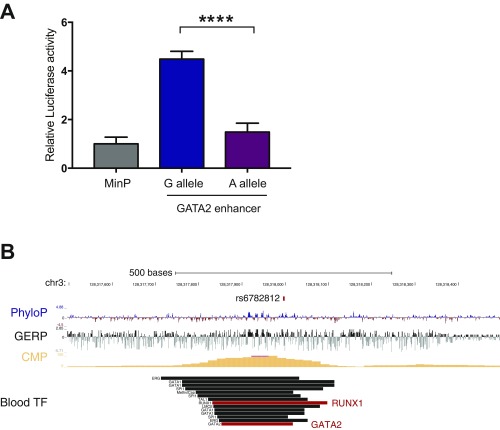
Our GWAS also identified an association with basophil counts at 3q21, which includes another master TF: GATA-binding protein 2 (GATA2) (rs2465283, P = 9.99 × 10⁻¹²) (Fig. 1A and Table 1). A previous GWAS performed in a Japanese population also identified an association at this locus with basophil counts (rs4328821; P = 5.3 × 10−40) (18). We noted that the basophil-decreasing allele of rs4328821 is associated with decreased GATA2 expression in whole blood (P = 5.3 × 10⁻¹³) (57). By leveraging differences in the LD patterns between Estonians and East Asians and examining only variants in strong LD (r2 > 0.8) with the lead SNP in both populations, we were able to reduce our CS from 11 to 6 variants. Of these six CS variants, only one variant (rs6782812) overlapped a strong hematopoietic NDR. Surprisingly, similar to the CEBPA variant (rs78744187), this NDR is also CMP specific (Fig. 3B) and is occupied by the RUNX1 and GATA2 TFs (Fig. S18). In luciferase-based assays in K562 cells, the NDR demonstrates ∼4.5-fold enhancer activity and the fine-mapped GATA2 variant (rs6782812) reduced enhancer activity by 69% (Fig. S18A). Because there are common master TFs at the two basophil-associated loci (GATA2 and CEBPA), we examined whether these two loci might show an epistatic interaction. We found no evidence of epistasis between rs2465283 (GATA2) and rs7874418 (CEBPA) (P = 0.070). The GATA2-associated variant was also associated with eosinophil counts (P = 3.07 × 10⁻³; Dataset S4), as has been seen previously in other studies (17–19, 58). An independent association near GATA2 for monocyte counts has been reported by other studies (monocyte sentinel SNP rs9880192; r2 = 0.054 to rs2465283 in Europeans) (17, 19). These associations near GATA2 are consistent with the well-known role of GATA2 in driving myeloid differentiation (59, 60). Together, these results suggest that the fine-mapped GATA2 variant (rs6782812) influences lineage specification at an earlier myeloid progenitor that is capable of producing basophils, eosinophils, and potentially other lineages, whereas the CEBPA variant (rs78744187) appears to be present in an enhancer that is specifically necessary for production of basophils from a downstream bipotential basophil/mast cell progenitor (BMCP) or other myeloid progenitor (Fig. 5E).
Fig. S18.
The fine-mapped variant at GATA2 is located in an enhancer element and is occupied by multiple myeloid TFs. (A) A 364-bp genomic region containing the basophil count-associated variant within the GATA2 locus (rs6782812) shows allele-specific enhancer activity in K562 cells by luciferase assay (****P < 0.0001). (B) The basophil count-associated variant within the GATA2 locus (rs6782812) lies within a CMP-specific element occupied by GATA2 and RUNX1. Similar to rs78744187 within the +39-kb CEBPA element shown in Fig. S11C.
Examination of Disease Associations.
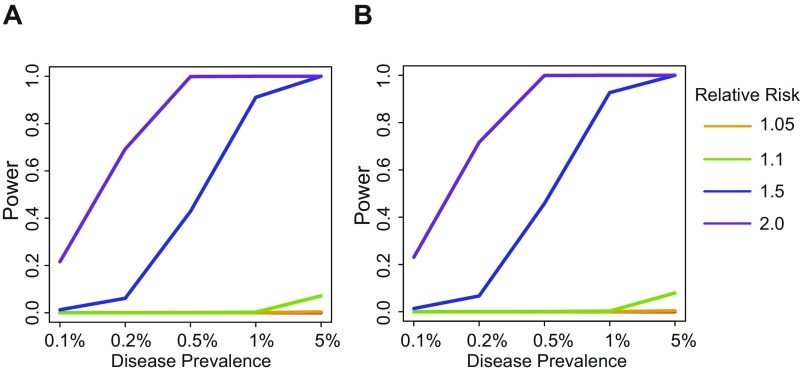
Basophils have been implicated in inflammation and host defense, but the causal role that basophils play in human disease is poorly understood (44, 61–63). To identify potential disease roles for basophils, we performed a phenome-wide association study (pheWAS) for rs78744187 and rs2465283 (64). To accomplish this, for each available International Statistical Classification of Diseases and Related Health Problems, 10th Revision (ICD-10) medical billing code, we treated all individuals with the code as cases and treated anyone without the code as a control. We tested for the existence of associations between either variant and all 534 diseases that had greater than 100 cases. No disease associations reaching the P value threshold of 9.2 × 10⁻⁵ (following Bonferroni correction) were identified for either SNP. However, rs78744187 was nominally associated with joint derangements and enteropathic arthropathy (P values of 0.00023 and 0.00059, respectively), which may have autoinflammatory etiologies (Dataset S9). Previous studies have identified multiple associations with inflammatory bowel disease (IBD) near CEBPA (65–67). However, the basophil association at rs78744187 appears to be independent from the IBD associations (Dataset S10). We do note that, although disease associations with basophil counts are likely to exist, similar to those seen with the related eosinophil lineage, we are likely to be underpowered in our current study to robustly detect such an effect, particularly given the variable fidelity of medical coding (Fig. S19) (68).
Fig. S19.
Power to detect pheWAS disease associations for rs78744187 (A) and rs2465283 (B). Power calculations were performed at disease prevalence of 0.1, 0.2, 0.5, 1.0, and 5.0%. Disease relative risk were set at 1.01, 1.05, 1.1, 1.5, and 2.0.
Discussion
In this study, we integrated WGS-based GWASs, fine-mapping, epigenomic datasets, and functional assays to provide additional insight into our evolving understanding of lineage specification during human hematopoiesis (69, 70). Integration of comprehensive genetic and extensive epigenomic data at these loci provided key insight into human hematopoietic regulatory mechanisms. For example, we were able to identify a variant that likely affects GATA1 TF binding to influence expression of ARHGEF3 during megakaryopoiesis. At the extensively studied HBS1L-MYB locus, by overlapping fine-mapping data with extensive ATAC-seq data, we provided evidence for additional putative causal variants. By integrating these complementary datasets, we were able to generate experimentally tractable hypotheses for further functional investigation.
At one of these loci, we fine-mapped a previously undiscovered association with basophil counts near the master TF CEBPA to a CMP-restricted enhancer element. Functional assays revealed that the causal variant altered enhancer activity and resulted in decreased CEBPA expression, which therefore helps drive the lineage choice between basophils and mast cells. Whether this lineage choice happens at the BMCP or a different myeloid progenitor stage is currently not resolved, and because our GWAS study did not measure mast cells in nonhematopoietic tissues, our findings cannot directly address this issue (71, 72). In the region of another master TF, GATA2, our study identified a basophil and eosinophil count-associated variant within a similar CMP-restricted enhancer associated with GATA2 expression. Thus, our study provides evidence that common genetic variation regulates basophil production by tuning the ordered expression of master TFs through the alteration of stage-specific enhancer elements (49). Furthermore, as both basophil-associated variants fall within enhancer elements that are active specifically in CMPs (but not GMPs or MEPs), our study provides strong support for revised models of hematopoiesis, where eosinophils, basophils, mast cells, and their progenitors bifurcate at the earlier CMP stage, rather than the more traditional models where these lineages arise from GMPs along with granulocyte and monocyte progenitors (Fig. 5E) (41, 42). Our findings provide key insights into the molecular regulation of basophil production, an important and nonredundant cell type in inflammation and host defense that has been challenging to study in humans due to its rarity (44, 61–63). The identification of these variants will also allow for further studies of the mechanisms by which genetic variants influencing basophil counts may impact on human diseases.
Our study also demonstrated the benefits of using high-coverage WGS in a population-based biobank. Comprehensive ascertainment of genetic variation allowed us to identify the association near CEBPA, which would have been missed had we imputed to sparser reference panels, such as HapMap. Furthermore, the high-coverage WGS allowed us to comprehensively capture variation that might be missed by lower coverage sequencing approaches (such as longer indels and variants in low-complexity regions), giving us confidence that the true causal variant has been identified at each locus, an important prerequisite for fine-mapping. Moreover, by performing our study in a population-based biobank, we were also able to link genetic data with EMRs to greatly increase sample sizes in a resource-efficient manner, providing support for similar programs such as the Precision Medicine Initiative (73). Together, our study demonstrates how key genetic and biological insights can be gained from comprehensive genetic studies in population-based biobanks.
Materials and Methods
Blood Cell Measurements.
We performed a complete blood count (CBC) in a clinical laboratory (“lab-based”) for 2,000 participants. One thousand individuals were chosen for profiling based on their agreement to be part of a recall study (mean follow-up time, 4.5 y) for collecting new biological samples and data on health and lifestyle. The remaining 1,000 samples represent a random subsample of 500 males and 500 females joining the biobank throughout the year 2009. Clinical laboratory-based measurements where performed at Tartu University Clinic's Diagnostics center. More details on specific methods and equipment used can be found online (www.kliinikum.ee/yhendlabor/analyysid). For the remaining individuals, we extracted blood cell measurements from EMR-based records as available. EMR-based phenotype measurements were obtained by systematically mining the EMRs from the two main hospitals in Estonia (Tartu University Clinic and Northern Estonia Regional Hospital). We were able to obtain EMR-based values for up to 5,038 individuals (Dataset S2), with up to 305 measurements for a single trait in an individual. Presence of other diseases was not taken into account when normalizing the blood cell measurements.
For each individual, we used the EMR-based measurements only if laboratory-based values were not available. We removed spurious values and extreme outliers (Dataset S3). We then performed regression using a linear mixed model adjusting for sex as a fixed effect, and setting (EMR-based vs. laboratory-based, as well as the specific hospital/clinic) and age at measurement as random effects. We took the median residual for each individual and performed inverse normal transformation of the median residuals. These median residuals were used for downstream association analyses.
Generation of genome sequencing data, variant calling, imputation, and association testing are all described in SI Materials and Methods. Approval for this study was obtained from the institutional review boards of the University of Tartu, Massachusetts Institute of Technology, and Boston Children's Hospital. Informed consent was provided according to the Declaration of Helsinki.
Luciferase Reporter Assays.
The genomic regions containing major and minor allele of the variants rs78744187 (∼400 bp) and rs6782812 (∼364 bp) were synthesized as gblocks (IDT Technologies; Dataset S11) and cloned into the firefly luciferase reporter constructs (pGL4.24) using BglII and XhoI sites. The firefly constructs (500 ng) were cotransfected with pRL-SV40 Renilla luciferase constructs (50 ng) into 100,000 K562 cells using Lipofectamine LTX (Invitrogen) according to the manufacturer’s protocols. Cells were harvested after 48 h and the luciferase activity measured by Dual-Glo Luciferase Assay system (Promega).
Genome Editing in Human CD34+ HSPCs Using Lentiviral CRISPR/Cas9 Mutagenesis.
Two guide RNAs targeting the variant rs78744187 and a control guide RNA targeting GFP (Fig. 4B) were cloned into LentiCRISPRv2 constructs (74). The constructs along with packaging helper constructs were transfected into HEK-293T cells for lentiviral production. The viral supernatant was then concentrated 60 times by ultracentrifugation. Human CD34+ HSPCs (adult) were purchased from Seattle Fred Hutchinson Center and cultured in Iscove's modified Dulbecco’s medium with 10% (vol/vol) FBS in the presence of human IL-3 (10 ng/mL). On day 2 in culture, ∼500,000 cells were spinfected with the concentrated lentiviral supernatant and polybrene (8 μg/mL) on retronectin-coated plates (Takara). On days 5 and 6 in culture, the cells were selected with puromycin (1 μg/mL). CEBPA expression was measured at day 7 in culture. The cells were subsequently cultured until day 14 for differentiation into basophils and mast cells.
Genome Editing in HL60s and U937 Cell Lines Using Lentiviral CRISPR/Cas9.
HL60 and U937 cells were cultured in RPMI with 10% (vol/vol) FBS. One to 2 million cells were spinfected with lentiviral supernatant with polybrene (8 μg/mL). On days 3, 4, and 5 postspinfection, cells were selected with puromycin (1 μg/mL). CEBPA expression was measured at day 12 postspinfection. For the Surveyor assay, genomic DNA was extracted at day 12 and a 600-bp region containing the CRISPR cut sites was PCR amplified (Dataset S11). The Surveyor assay was performed according to kit recommendations (IDT Technologies).
Flow Cytometry.
Cells were incubated with Human BD Fc Block (BD Biosciences) for 10 min at room temperature to prevent nonspecific binding to Fc receptors. Subsequently, the cells were stained with CD117-PE (clone 104D2; Biolegend) and CD203c-APC (clone NP4D6; Biolegend) antibodies and analyzed by BD Accuri Flow Cytometer. FACS plots were generated by FlowJo (Tree Star).
SI Materials and Methods
Selection of WGS Samples.
The 2,300 WGS samples were drawn from the larger Estonian Biobank of 51,000 participants. These samples are composed of two substudies. The first study consisted of 1,000 individuals who agreed to be part of a recall study (mean follow-up time, 4.5 y) for collecting biological samples and health and lifestyle data. The remaining 1,300 individuals were selected with the objective of capturing the most haplotypes segregating in the Estonian population. To achieve this, we used participants’ self-reported place of birth (with precision up to the village/town level) and selected at least two individuals from every major town and parish. No selection criteria were based on disease status, richness of electronic medical records, or other health/lifestyle variables.
Laboratory Methods for WGS.
Initial genomic DNA shearing reduced input from 3 µg to 500 ng in 50 µL of solution. In addition, for adapter ligation, Illumina paired-end adapters were replaced with palindromic forked adapters with unique 8-base index sequences embedded within the adapter.
Following sample preparation, libraries were quantified using quantitative PCR (qPCR) (KAPA Biosystems) with probes specific to the ends of the adapters. This assay was automated using Agilent’s Bravo liquid handling platform. Based on qPCR quantification, libraries were normalized to 2 nM. Samples were then pooled into eight-plexes, and the pools were once again qPCRed. Samples were then combined with HiSeqX Cluster Amp Mix 1, 2, and 3 into single wells on a strip tube using the Hamilton Starlet liquid handling system.
Cluster amplification of the templates was performed according to the manufacturer’s protocol using the Illumina cBot (Illumina). Flow cells were sequenced on an Illumina HiSeqX.
WGS Variant Calling.
Samples were processed from real-time base calls (RTA, version 1.12, software), converted to qseq.txt files, and aligned to a human reference (hg19) using Burrows–Wheeler Aligner (BWA) (75). Aligned reads duplicating the start position of another read were flagged as duplicates and not analyzed. Data were processed using the Genome Analysis ToolKit (GATK) (version 3) (76–78). Reads were locally realigned around indels, and their base qualities were recalibrated. Variant calling was performed across all samples using the HaplotypeCaller (HC) tool from GATK to generate a gVCF. Joint genotyping was subsequently performed, and “raw” variant data for each sample were formatted to VCF. Single-nucleotide variants (SNVs) and indel sites were initially filtered after variant calibration marked sites of low quality that were likely false positives.
Data Processing and Quality Control of WGS.
We assessed for distribution outliers across a series of metrics: total SNVs/depth, total indels/depth, total multiallelic sites/depth, transition/transversion ratio for SNVs, insert size, and F inbreeding coefficient/burden of runs of homozygosity. We used hard filters of call rate < 99.0%, chimeric alignment > 5.0%, raw coverage < 19×, and discordance with genome-wide array data > 5%. Twenty-two samples (0.9%) were removed by these filters.
Variant score quality recalibration was performed separately for SNVs and indels using GATK VariantRecalibrator and ApplyRecalibration to filter out variants with lower accuracy scores. We also removed variants from “low-complexity” genomic regions susceptible to false variant calls largely resulting from alignment errors (79). We additionally filtered out variants with: InbreedingCoeff < −0.3, Hardy–Weinberg equilibrium P < 10−9, quality/depth (QD) < 2 for SNVs and < 3 for indels, and call rate < 95%; such additional filtering removed an additional 4.1% of variants. Results of sample and variant-level QC are summarized in Dataset S1.
Genotyping and Imputation.
A reference panel was constructed using the post-QC Estonian WGS from 2,244 individuals. Only SNVs with call rate > 0.95 and minor allele count > 2 were considered, resulting in 16,536,512 SNVs in the reference panel. Phasing of the reference panel was performed using SHAPEIT2 (80).
A total of 14,904 samples was selected from the larger Estonian biobank for SNP genotyping. These samples were selected as part of a systems biology study (57), as well as several nested case-control studies for type 2 diabetes, aging, and cognitive function (81–83). Samples were genotyped on one of three platforms: Infinium CoreExome-24 BeadChip Kit (n = 6,394), Illumina HumanCNV370-Duo BeadChip (n = 2,656), or Illumina HumanOmniExpress (n = 8,138). In total, there were 14,904 nonoverlapping SNP genotyping samples. Genotypes were prephased using SHAPEIT2 (80) and imputed to the Estonian WGS reference panel using IMPUTE2 with default parameters (84).
Single-Variant Association Testing.
Single-variant association testing in the WGS samples was performed using the q.emmax test in EPACTS, version 3.2.6 (genome.sph.umich.edu/wiki/EPACTS). We tested all variants passing QC and with minor allele count of ≥3. Association statistics were adjusted for sequencing batch and for relatedness using the kinship matrix (created using SNPs with MAF > 1% and call rate > 95%).
Single-variant testing in the genotyped samples was performed using the “score” method on imputed genotype dosages using SNPTEST, version 2.5.2 (85). Association testing was performed under an additive model and was adjusted for the first 10 principal components. Analyses were performed separately for samples from each genotyping array.
Metaanalysis of single-variant statistics was performed using METAL (86). Metaanalysis was performed for summary statistics from the WGS samples and each of the three genotyping arrays. Metaanalysis was performed using the “STDERR” method to weight effect size estimates using the inverse of the corresponding SEs.
Gene-Based Burden Testing.
To efficiently perform gene-based burden testing, we combined the WGS and imputed SNP genotyping data from each of the three genotyping platforms into a single vcf. Variants were annotated using EPACTS, version 3.2.6, for protein effect and using gencode, version 7, gene annotations. We also annotated PolyPhen2 and SIFT scores (87, 88). We created three separate group files: (i) LOF (splice site, frameshift, and nonsense), (ii) LOF plus missense nominated to be damaging by PolyPhen2 and SIFT, and (iii) all nonsynonymous variants.
We then performed gene-based burden testing using SKAT-O (7) (EMMAX, mmskat test) in EPACTS, version 3.2.6, on all variants with MAF < 5%. Associations were adjusted for sequencing batch and kinship as described above. Values of P < 8.33 × 10⁻⁷ were considered to be significant (Bonferroni corrected for testing of 20,000 genes and under three separate levels of protein effect).
Imputation for Fine-Mapping.
To ensure comprehensive coverage of potentially causal variants, we reimputed all 17 genome-wide significant associations to a reference panel constructed using the Estonian WGS data. All variants with minor allele count of ≥3 identified in the WGS were used, regardless of whether they met variant-level quality metrics. We reasoned that many of the variants that did not meet quality filters are in fact true variants, and only true variants would likely show strong LD to the lead SNP at the locus and thus be considered in the fine-mapping.
To construct this reference panel, we used a two-step phasing approach. We first phased the high-quality variants (met quality metrics in the WGS; see above) using default settings in BEAGLE, version 4.2 (89). We next added the variants that did not meet quality metrics and phased these variants while preserving the phase of the high-quality variants. We used a 5-Mb window around the lead SNP when constructing the reference panel.
Genotypes were then imputed to this phased reference panel using IMPUTE2 (84) as described above. Association testing was performed using SNPTEST, version 2.5.2 (85), as described above.
Calling of CNVs.
Genome STRiP CNV discovery pipeline (version 2.00.1611) was used to discover and genotype large deletions, large duplications, and multiallelic CNVs in the 2,284 WGS samples (90). The pipeline was applied in five separate batches of ∼450 samples each; 54 samples were removed during QC. The union of the discovered sites was genotyped with Genome STRiP’s SVGenotyper module in all batches separately and then merged. Duplicate calls were removed using the standard Genome STRiP duplicate removal settings, which included site overlap greater than 50% and duplicate score [logarithm of odds (LOD) score of genotype concordance at most discordant sample] greater than zero. In addition, CNVs shorter than 1,000 bp and with call rate less than 90% were excluded, leaving 48,835 CNVs called across the genome.
dbGaP Replication.
We performed additional replication in the Atherosclerosis Risk in Communities (ARIC), Coronary Artery Risk Development in Young Adults (CARDIA), and Multi-Ethnic Study of Atherosclerosis (MESA) cohorts. We extracted individuals of European ancestry based on principal-component analysis, and performed extensive QC of the genotype data as previously described (91). We then phased the genotyping data using SHAPEIT2 (80) with an effective population size of 20,000 and default parameters. Phased genotyping data were imputed to 1000 Genomes phase 1, version 3 (20), or HapMap3 (92) using IMPUTE2 and default parameters (84).
Basophil counts were extracted from available phenotype data deposited in dbGaP. For ARIC and CARDIA, basophil counts were calculated by multiplying the white blood cell count by the percentage of basophil. Basophil counts were adjusted using linear regression for sex, age, and reported ancestry as well as measurement site (for MESA). Trait residuals were then inverse normal transformed.
Association testing and metaanalyses were performed as described above.
Epistasis Analysis.
Epistasis testing for rs78744187 and rs2465283 was performed using “–epistasis” in PLINK1.9 using default parameters (93, 94). As explained in the documentation for PLINK1.9, this test uses linear regression to fit the model: Y = β0 + β1gA + β2gB + β3gAgB, where A and B are the two variants, gA and gB are allele counts, and B3 coefficients are tested for significance.
PheWAS for rs2465283 and rs78744187.
We performed a pheWAS at rs78744187 and rs2465283 using ICD-10 codes from the UK Biobank (64). We classified individuals as cases and controls for each ICD-10 classification (first three digits of ICD-10 code). Cases were defined as any individual who had the code, and any individual who did not have the code was assigned as a control. We included all ICD-10 codes for which there were more than 100 disease cases. In total, there were 534 ICD-10 codes with more than 100 disease cases. Samples were genotyped and imputed to the UK-10K plus 1000 Genomes phase 3 reference panel (21, 95). A total of 100,738 individuals had both genotype and phenotypes available. Association analysis was carried out using logistic regression in PLINK 1.9 (93, 94). We applied a conservative P value threshold of 9.2 × 10⁻⁵ (Bonferroni correction for 534 diseases tested) for declaring statistical significance.
Power calculations were performed using the Genetic Power Calculator (96). Allele frequencies from the UK Biobank were used: 0.080 for rs78744187 and 0.085 for rs2465283. Calculations were performed assuming a total sample size (cases and controls) of 100,000, unselected control samples, and disease prevalence of 0.1, 0.2, 0.5, 1.0, and 5%. Genotype relative risks were set at 1.01, 1.05, 1.1, 1.5, and 2.0. Type 1 error rate was set at α = 9.2 × 10⁻⁵.
Sequencing of Target Loci Following Genome Editing.
Genomic DNA was extracted at day 14 of culture and a 277-bp PCR amplicon containing the CRISPR cut sites was generated (Dataset S10). The PCR amplicons were processed (NGS adapters and unique barcode addition) by the Center for Computational and Integrative Biology DNA Core facility at Massachusetts General Hospital and paired-end sequencing was performed on a MiSeq (Illumina).
Quantitative RT-PCR.
RNA was extracted using the RNAqueous-Micro Kit (Ambion) and reverse transcribed using iScript cDNA synthesis kit (Bio-Rad). Quantitative RT-PCR was performed using transcript-specific primers (Dataset S10) with iQ SYBR Green Supermix (Bio-Rad) on the CFX96TM Real-Time System (Bio-Rad). Quantification was performed using the ΔΔCT method with β-actin as the reference gene.
May-Giemsa Staining.
Approximately 40,000 cells were spun into poly-l-lysine–coated microscope slides using Cytospin. The slides were stained with May–Grünwald solution (Sigma-Aldrich) for 5 min, Giemsa solution (Sigma-Aldrich) for 15 min, and washed several times with water in between. Images were taken at 100× oil magnification.
Genetic Fine-Mapping.
Genetic fine-mapping was performed with three independent methods (22–24, 97). Approximate Bayes factors (ABFs) were derived according to the following formula as per Wakefield et al. and Maller et al. and implemented in R as the following function (W was set to 0.4):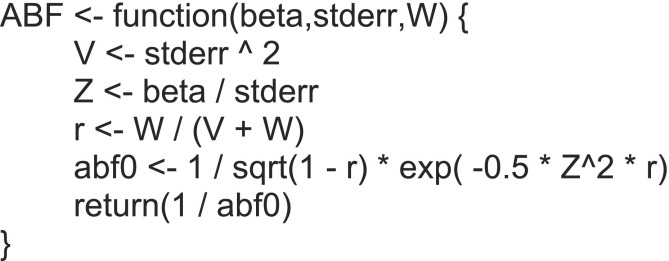
CaviarBF was run with the arguments “-t 0 -a 0.1 -c 1.” PICS was run with standard arguments as previously described. For both CaviarBF and PICS, correlation and LD matrices were derived from the Estonian WGS results. Assuming one independent signal at each association, the genetic probability that a single variant is causal was derived as follows for ABF and CaviarBF: . Next, 97.5% credible sets (CSs) or intervals for each association were created by summing up the variants with the highest genetic probabilities until the sum of the probabilities exceeded 97.5%. The intersection of the ABF and CaviarBF CSs was chosen as the final CS used in all downstream analyses. Transethnic fine-mapping was performed by overlapping all variants with r2 > 0.8 to the sentinel SNP reported in the Japanese population (1000 Genomes EAS population) with CSs defined in the Estonian population. PLINK was used for data management and to calculate correlations and LD between variants (94).
Variant Annotation and Epigenomic Analyses.
Consensus open chromatin/nucleosome-depleted region (NDR) peaks from ATAC-seq in 13 hematopoietic cell types that were distal (not overlapping with promoters) and the corresponding normalized count matrices (peaks × cell types) for these 500-bp NDRs were obtained from Corces et al. (27) and extended by 50 bp on both sides. Only NDRs that scored within the top 20% of NDRs for at least one hematopoietic stage were considered based upon manual investigation. Counts were then quantile-normalized across cell types using the R package “preprocessCore.” To visualize the specificity of individual NDRs between cell types, an ATAC-seq score was derived by min-max scaling the normalized counts at each NDR (row normalization). GoShifter was used to investigate enrichment of CS loci for hematopoietic NDRs (permutation region extended 500 kb on both sides of CS) (28).
Processed NDRs for the myeloid cell lines K562, HL-60, and CMK were obtained from ChIP Atlas (chip-atlas.org/) (SRX069219, SRX069200, and SRX037116). Transcription factor (TF) occupancy for CS variants overlapping with NDRs was also investigated primarily by using ChIP Atlas. A total of 4,559 independent ChIP-seq experiments in the public domain was included in the analysis for “Blood” class cell types using “50” as the peak threshold for significance. Additional TF occupancy or histone modification processed data for mouse megakaryocytes, erythroid cells, and HPC-7 cells (hematopoietic progenitor cell lines) were obtained from the modENCODE project and Wilson et al. (38, 98). Conservation metrics PhyloP (for 100 vertebrates) and GERP (RS scores for 35 mammals) were used to inspect the extent of evolutionary constraint at the investigated loci (99, 100). “Liftover” tool was used to convert coordinates between human and mouse assemblies. For all locus visualizations, the UCSC genome browser was used (hg19 unless otherwise indicated) (101).
Putative motif disruptions were defined using a combined TRANSFAC, Jaspar, and HOCOMOCO, version 10, database (102, 103). First, FIMO was used to find motifs overlapping with the variant in either the reference or alternative sequence and were identified using a cutoff of P < 0.0001 (104). Next, reference and alternative sequence motifs were compared and motifs with a >3 log fold change were considered as potential disruptions and reported. Regardless of exact motif disruptions, variants were also investigated for their predicted functional activity based upon a combined score of functional significance learned from a neural net trained on 939 TF, NDR, and histone modification datasets in the ENCODE project (35). Topologically associated domains (TADs) were investigated by visualizing K562 Hi-C data with Juicebox using only reads with quality scores greater than 30 and “balanced” normalization (105).
dbGaP Sample Information/Acknowledgments.
The datasets used for the analyses described in this manuscript were obtained from dbGaP at www.ncbi.nlm.nih.gov/gap through dbGaP accession numbers: phs000280 (ARIC), phs000285 (CARDIA), and phs000209 (MESA).
ARIC.
The ARIC study is carried out as a collaborative study supported by National Heart, Lung, and Blood Institute (NHLBI) contracts (HHSN268201100005C, HHSN268201100006C, HHSN268201100007C, HHSN268201100008C, HHSN268201100009C, HHSN268201100010C, HHSN268201100011C, and HHSN268201100012C). We thank the staff and participants of the ARIC study for their important contributions. This study is part of the NHLBI Grand Opportunity Exome Sequencing Project (GO-ESP). Funding for GO-ESP was provided by NHLBI Grants RC2 HL103010 (HeartGO), RC2 HL102923 (LungGO), and RC2 HL102924 (WHISP). The exome sequencing was performed through NHLBI Grants RC2 HL102925 (BroadGO) and RC2 HL102926 (SeattleGO). HeartGO gratefully acknowledges the following groups and individuals who provided biological samples or data for this study. DNA samples and phenotypic data were obtained from the following studies supported by the NHLBI: the ARIC study, the CARDIA study, Cardiovascular Health Study (CHS), the Framingham Heart Study (FHS), the Jackson Heart Study (JHS), and MESA. This manuscript was not prepared in collaboration with investigators of the ARIC study and does not necessarily reflect the opinions or views of the ARIC, or NHLBI.
CARDIA.
The CARDIA study is conducted and supported by NHLBI in collaboration with the University of Alabama at Birmingham (N01-HC95095 and N01-HC48047), University of Minnesota (N01-HC48048), Northwestern University (N01-HC48049), and Kaiser Foundation Research Institute (N01-HC48050). This study is part of the NHLBI GO-ESP. Funding for GO-ESP was provided by NHLBI Grants RC2 HL103010 (HeartGO), RC2 HL102923 (LungGO), and RC2 HL102924 (WHISP). The exome sequencing was performed through NHLBI Grants RC2 HL102925 (BroadGO) and RC2 HL102926 (SeattleGO). HeartGO gratefully acknowledges the following groups and individuals who provided biological samples or data for this study. DNA samples and phenotypic data were obtained from the following studies supported by the NHLBI: the ARIC study, the CARDIA study, CHS, FHS, JHS, and MESA. This manuscript was not approved by CARDIA. The opinions and conclusions contained in this publication are solely those of the authors, and are not endorsed by CARDIA or the NHLBI and should not be assumed to reflect the opinions or conclusions of either.
MESA.
MESA and the MESA SHARe project are conducted and supported by NHLBI in collaboration with MESA investigators. Support for MESA is provided by Contracts N01-HC-95159, N01-HC-95160, N01-HC-95161, N01-HC-95162, N01-HC-95163, N01-HC-95164, N01-HC-95165, N01-HC-95166, N01-HC-95167, N01-HC-95168, N01-HC-95169, and CTSA UL1-RR-024156. This study is part of the NHLBI GO-ESP. Funding for GO-ESP was provided by NHLBI Grants RC2 HL103010 (HeartGO), RC2 HL102923 (LungGO), and RC2 HL102924 (WHISP). The exome sequencing was performed through NHLBI Grants RC2 HL102925 (BroadGO) and RC2 HL102926 (SeattleGO). HeartGO gratefully acknowledges the following groups and individuals who provided biological samples or data for this study. DNA samples and phenotypic data were obtained from the following studies supported by the NHLBI: the ARIC study, the CARDIA study, CHS, FHS, JHS, and MESA. This manuscript was not prepared in collaboration with MESA investigators and does not necessarily reflect the opinions or views of MESA, or the NHLBI.
Supplementary Material
Acknowledgments
We thank members of the V.G.S. and J.N.H. Laboratories, as well as the Estonian Genome Center, and numerous colleagues for valuable comments and discussions. This work was supported by National Institutes of Health Grants R01 DK103794, R33 HL120791 (to V.G.S.), and R01 DK075787 (to J.N.H.). P.P. was funded by the Nordic Information for Action eScience Center by NordForsk (Project 62721). The Estonian Genome Center was supported by the Estonian Research Council (PerMed I; IUT20-60); European Union H2020 Grants 692145, 676550, and 654248; and the European Union through the European Regional Development Fund (GENTRANSMED).
Footnotes
The authors declare no conflict of interest.
This article contains supporting information online at www.pnas.org/lookup/suppl/doi:10.1073/pnas.1619052114/-/DCSupplemental.
References
- 1.Sankaran VG, Orkin SH. Genome-wide association studies of hematologic phenotypes: A window into human hematopoiesis. Curr Opin Genet Dev. 2013;23(3):339–344. doi: 10.1016/j.gde.2013.02.006. [DOI] [PMC free article] [PubMed] [Google Scholar]
- 2.Sankaran VG, Weiss MJ. Anemia: Progress in molecular mechanisms and therapies. Nat Med. 2015;21(3):221–230. doi: 10.1038/nm.3814. [DOI] [PMC free article] [PubMed] [Google Scholar]
- 3.van der Harst P, et al. Seventy-five genetic loci influencing the human red blood cell. Nature. 2012;492(7429):369–375. doi: 10.1038/nature11677. [DOI] [PMC free article] [PubMed] [Google Scholar]
- 4.Ulirsch JC, et al. Systematic functional dissection of common genetic variation affecting red blood cell traits. Cell. 2016;165(6):1530–1545. doi: 10.1016/j.cell.2016.04.048. [DOI] [PMC free article] [PubMed] [Google Scholar]
- 5.Orrù V, et al. Genetic variants regulating immune cell levels in health and disease. Cell. 2013;155(1):242–256. doi: 10.1016/j.cell.2013.08.041. [DOI] [PMC free article] [PubMed] [Google Scholar]
- 6.Leitsalu L, Alavere H, Tammesoo ML, Leego E, Metspalu A. Linking a population biobank with national health registries—the Estonian experience. J Pers Med. 2015;5(2):96–106. doi: 10.3390/jpm5020096. [DOI] [PMC free article] [PubMed] [Google Scholar]
- 7.Lee S, et al. NHLBI GO Exome Sequencing Project—ESP Lung Project Team Optimal unified approach for rare-variant association testing with application to small-sample case-control whole-exome sequencing studies. Am J Hum Genet. 2012;91(2):224–237. doi: 10.1016/j.ajhg.2012.06.007. [DOI] [PMC free article] [PubMed] [Google Scholar]
- 8.Sankaran VG, et al. Rare complete loss of function provides insight into a pleiotropic genome-wide association study locus. Blood. 2013;122(23):3845–3847. doi: 10.1182/blood-2013-09-528315. [DOI] [PubMed] [Google Scholar]
- 9.Galarneau G, et al. Fine-mapping at three loci known to affect fetal hemoglobin levels explains additional genetic variation. Nat Genet. 2010;42(12):1049–1051. doi: 10.1038/ng.707. [DOI] [PMC free article] [PubMed] [Google Scholar]
- 10.Nuinoon M, et al. A genome-wide association identified the common genetic variants influence disease severity in beta0-thalassemia/hemoglobin E. Hum Genet. 2010;127(3):303–314. doi: 10.1007/s00439-009-0770-2. [DOI] [PubMed] [Google Scholar]
- 11.Lettre G, et al. DNA polymorphisms at the BCL11A, HBS1L-MYB, and beta-globin loci associate with fetal hemoglobin levels and pain crises in sickle cell disease. Proc Natl Acad Sci USA. 2008;105(33):11869–11874. doi: 10.1073/pnas.0804799105. [DOI] [PMC free article] [PubMed] [Google Scholar]
- 12.Khwaja A. The role of Janus kinases in haemopoiesis and haematological malignancy. Br J Haematol. 2006;134(4):366–384. doi: 10.1111/j.1365-2141.2006.06206.x. [DOI] [PubMed] [Google Scholar]
- 13.Auer PL, et al. Rare and low-frequency coding variants in CXCR2 and other genes are associated with hematological traits. Nat Genet. 2014;46(6):629–634. doi: 10.1038/ng.2962. [DOI] [PMC free article] [PubMed] [Google Scholar]
- 14.Kahn ML, et al. A dual thrombin receptor system for platelet activation. Nature. 1998;394(6694):690–694. doi: 10.1038/29325. [DOI] [PubMed] [Google Scholar]
- 15.Polfus LM, et al. Whole-exome sequencing identifies loci associated with blood cell traits and reveals a role for alternative GFI1B splice variants in human hematopoiesis. Am J Hum Genet. 2016;99(2):481–488. doi: 10.1016/j.ajhg.2016.06.016. [DOI] [PMC free article] [PubMed] [Google Scholar]
- 16.Zuk O, et al. Searching for missing heritability: Designing rare variant association studies. Proc Natl Acad Sci USA. 2014;111(4):E455–E464. doi: 10.1073/pnas.1322563111. [DOI] [PMC free article] [PubMed] [Google Scholar]
- 17.Keller MF, et al. CHARGE Hematology; COGENT; BioBank Japan Project (RIKEN) Working Groups Trans-ethnic meta-analysis of white blood cell phenotypes. Hum Mol Genet. 2014;23(25):6944–6960. doi: 10.1093/hmg/ddu401. [DOI] [PMC free article] [PubMed] [Google Scholar]
- 18.Okada Y, et al. Identification of nine novel loci associated with white blood cell subtypes in a Japanese population. PLoS Genet. 2011;7(6):e1002067. doi: 10.1371/journal.pgen.1002067. [DOI] [PMC free article] [PubMed] [Google Scholar]
- 19.Nalls MA, et al. Multiple loci are associated with white blood cell phenotypes. PLoS Genet. 2011;7(6):e1002113. doi: 10.1371/journal.pgen.1002113. [DOI] [PMC free article] [PubMed] [Google Scholar]
- 20.Abecasis GR, et al. 1000 Genomes Project Consortium An integrated map of genetic variation from 1,092 human genomes. Nature. 2012;491(7422):56–65. doi: 10.1038/nature11632. [DOI] [PMC free article] [PubMed] [Google Scholar]
- 21.Auton A, et al. 1000 Genomes Project Consortium A global reference for human genetic variation. Nature. 2015;526(7571):68–74. doi: 10.1038/nature15393. [DOI] [PMC free article] [PubMed] [Google Scholar]
- 22.Maller JB, et al. Wellcome Trust Case Control Consortium Bayesian refinement of association signals for 14 loci in 3 common diseases. Nat Genet. 2012;44(12):1294–1301. doi: 10.1038/ng.2435. [DOI] [PMC free article] [PubMed] [Google Scholar]
- 23.Chen W, et al. Fine mapping causal variants with an approximate Bayesian method using marginal test statistics. Genetics. 2015;200(3):719–736. doi: 10.1534/genetics.115.176107. [DOI] [PMC free article] [PubMed] [Google Scholar]
- 24.Farh KK-H, et al. Genetic and epigenetic fine mapping of causal autoimmune disease variants. Nature. 2015;518(7539):337–343. doi: 10.1038/nature13835. [DOI] [PMC free article] [PubMed] [Google Scholar]
- 25.Gusev A, et al. Schizophrenia Working Group of the Psychiatric Genomics Consortium; SWE-SCZ Consortium Schizophrenia Working Group of the Psychiatric Genomics Consortium; SWE-SCZ Consortium Partitioning heritability of regulatory and cell-type-specific variants across 11 common diseases. Am J Hum Genet. 2014;95(5):535–552. doi: 10.1016/j.ajhg.2014.10.004. [DOI] [PMC free article] [PubMed] [Google Scholar]
- 26.Finucane HK, et al. ReproGen Consortium; Schizophrenia Working Group of the Psychiatric Genomics Consortium; RACI Consortium Partitioning heritability by functional annotation using genome-wide association summary statistics. Nat Genet. 2015;47(11):1228–1235. doi: 10.1038/ng.3404. [DOI] [PMC free article] [PubMed] [Google Scholar]
- 27.Corces MR, et al. Lineage-specific and single-cell chromatin accessibility charts human hematopoiesis and leukemia evolution. Nat Genet. 2016;48(10):1193–1203. doi: 10.1038/ng.3646. [DOI] [PMC free article] [PubMed] [Google Scholar]
- 28.Trynka G, et al. Disentangling the effects of colocalizing genomic annotations to functionally prioritize non-coding variants within complex-trait loci. Am J Hum Genet. 2015;97(1):139–152. doi: 10.1016/j.ajhg.2015.05.016. [DOI] [PMC free article] [PubMed] [Google Scholar]
- 29.Nai A, et al. TMPRSS6 rs855791 modulates hepcidin transcription in vitro and serum hepcidin levels in normal individuals. Blood. 2011;118(16):4459–4462. doi: 10.1182/blood-2011-06-364034. [DOI] [PubMed] [Google Scholar]
- 30.Finberg KE, et al. Mutations in TMPRSS6 cause iron-refractory iron deficiency anemia (IRIDA) Nat Genet. 2008;40(5):569–571. doi: 10.1038/ng.130. [DOI] [PMC free article] [PubMed] [Google Scholar]
- 31.Stadhouders R, et al. HBS1L-MYB intergenic variants modulate fetal hemoglobin via long-range MYB enhancers. J Clin Invest. 2014;124(4):1699–1710. doi: 10.1172/JCI71520. [DOI] [PMC free article] [PubMed] [Google Scholar]
- 32.Serbanovic-Canic J, et al. Silencing of RhoA nucleotide exchange factor, ARHGEF3, reveals its unexpected role in iron uptake. Blood. 2011;118(18):4967–4976. doi: 10.1182/blood-2011-02-337295. [DOI] [PMC free article] [PubMed] [Google Scholar]
- 33.Battle A, et al. Characterizing the genetic basis of transcriptome diversity through RNA-sequencing of 922 individuals. Genome Res. 2014;24(1):14–24. doi: 10.1101/gr.155192.113. [DOI] [PMC free article] [PubMed] [Google Scholar]
- 34.Zhang X, et al. Genetic associations with expression for genes implicated in GWAS studies for atherosclerotic cardiovascular disease and blood phenotypes. Hum Mol Genet. 2014;23(3):782–795. doi: 10.1093/hmg/ddt461. [DOI] [PMC free article] [PubMed] [Google Scholar]
- 35.Zhou J, Troyanskaya OG. Predicting effects of noncoding variants with deep learning-based sequence model. Nat Methods. 2015;12(10):931–934. doi: 10.1038/nmeth.3547. [DOI] [PMC free article] [PubMed] [Google Scholar]
- 36.Avellino R, et al. An autonomous CEBPA enhancer specific for myeloid-lineage priming and neutrophilic differentiation. Blood. 2016;127(24):2991–3003. doi: 10.1182/blood-2016-01-695759. [DOI] [PMC free article] [PubMed] [Google Scholar]
- 37.Guo H, Cooper S, Friedman AD. In vivo deletion of the Cebpa +37 kb enhancer markedly reduces Cebpa mRNA in myeloid progenitors but not in non-hematopoietic tissues to impair granulopoiesis. PLoS One. 2016;11(3):e0150809. doi: 10.1371/journal.pone.0150809. [DOI] [PMC free article] [PubMed] [Google Scholar]
- 38.Wilson NK, et al. Integrated genome-scale analysis of the transcriptional regulatory landscape in a blood stem/progenitor cell model. Blood. 2016;127(13):e12–e23. doi: 10.1182/blood-2015-10-677393. [DOI] [PubMed] [Google Scholar]
- 39.Chen C-C, Grimbaldeston MA, Tsai M, Weissman IL, Galli SJ. Identification of mast cell progenitors in adult mice. Proc Natl Acad Sci USA. 2005;102(32):11408–11413. doi: 10.1073/pnas.0504197102. [DOI] [PMC free article] [PubMed] [Google Scholar]
- 40.Franco CB, Chen CC, Drukker M, Weissman IL, Galli SJ. Distinguishing mast cell and granulocyte differentiation at the single-cell level. Cell Stem Cell. 2010;6(4):361–368. doi: 10.1016/j.stem.2010.02.013. [DOI] [PMC free article] [PubMed] [Google Scholar]
- 41.Görgens A, et al. Revision of the human hematopoietic tree: Granulocyte subtypes derive from distinct hematopoietic lineages. Cell Rep. 2013;3(5):1539–1552. doi: 10.1016/j.celrep.2013.04.025. [DOI] [PubMed] [Google Scholar]
- 42.Drissen R, et al. Distinct myeloid progenitor-differentiation pathways identified through single-cell RNA sequencing. Nat Immunol. 2016;17(6):666–676. doi: 10.1038/ni.3412. [DOI] [PMC free article] [PubMed] [Google Scholar]
- 43.Wakabayashi A, et al. Insight into GATA1 transcriptional activity through interrogation of cis elements disrupted in human erythroid disorders. Proc Natl Acad Sci USA. 2016;113(16):4434–4439. doi: 10.1073/pnas.1521754113. [DOI] [PMC free article] [PubMed] [Google Scholar]
- 44.Voehringer D. Protective and pathological roles of mast cells and basophils. Nat Rev Immunol. 2013;13(5):362–375. doi: 10.1038/nri3427. [DOI] [PubMed] [Google Scholar]
- 45.Huang H, Li Y. Mechanisms controlling mast cell and basophil lineage decisions. Curr Allergy Asthma Rep. 2014;14(9):457. doi: 10.1007/s11882-014-0457-1. [DOI] [PMC free article] [PubMed] [Google Scholar]
- 46.Dwyer DF, Barrett NA, Austen KF. Immunological Genome Project Consortium Expression profiling of constitutive mast cells reveals a unique identity within the immune system. Nat Immunol. 2016;17(7):878–887. doi: 10.1038/ni.3445. [DOI] [PMC free article] [PubMed] [Google Scholar]
- 47.Friedman AD. C/EBPα in normal and malignant myelopoiesis. Int J Hematol. 2015;101(4):330–341. doi: 10.1007/s12185-015-1764-6. [DOI] [PMC free article] [PubMed] [Google Scholar]
- 48.Paul F, et al. Transcriptional heterogeneity and lineage commitment in myeloid progenitors. Cell. 2015;163(7):1663–1677. doi: 10.1016/j.cell.2015.11.013. [DOI] [PubMed] [Google Scholar]
- 49.Iwasaki H, et al. The order of expression of transcription factors directs hierarchical specification of hematopoietic lineages. Genes Dev. 2006;20(21):3010–3021. doi: 10.1101/gad.1493506. [DOI] [PMC free article] [PubMed] [Google Scholar]
- 50.Ishmael SS, MacGlashan DW., Jr Syk expression in peripheral blood leukocytes, CD34+ progenitors, and CD34-derived basophils. J Leukoc Biol. 2010;87(2):291–300. doi: 10.1189/jlb.0509336. [DOI] [PMC free article] [PubMed] [Google Scholar]
- 51.Choi KD, Vodyanik MA, Slukvin II. Generation of mature human myelomonocytic cells through expansion and differentiation of pluripotent stem cell-derived lin−CD34+CD43+CD45+ progenitors. J Clin Invest. 2009;119(9):2818–2829. doi: 10.1172/JCI38591. [DOI] [PMC free article] [PubMed] [Google Scholar]
- 52.Kepley CL, Pfeiffer JR, Schwartz LB, Wilson BS, Oliver JM. The identification and characterization of umbilical cord blood-derived human basophils. J Leukoc Biol. 1998;64(4):474–483. doi: 10.1002/jlb.64.4.474. [DOI] [PubMed] [Google Scholar]
- 53.Bühring HJ, et al. The monoclonal antibody 97A6 defines a novel surface antigen expressed on human basophils and their multipotent and unipotent progenitors. Blood. 1999;94(7):2343–2356. [PubMed] [Google Scholar]
- 54.Langdon JM, et al. Histamine-releasing factor/translationally controlled tumor protein (HRF/TCTP)-induced histamine release is enhanced with SHIP-1 knockdown in cultured human mast cell and basophil models. J Leukoc Biol. 2008;84(4):1151–1158. doi: 10.1189/jlb.0308172. [DOI] [PMC free article] [PubMed] [Google Scholar]
- 55.Arinobu Y, et al. Developmental checkpoints of the basophil/mast cell lineages in adult murine hematopoiesis. Proc Natl Acad Sci USA. 2005;102(50):18105–18110. doi: 10.1073/pnas.0509148102. [DOI] [PMC free article] [PubMed] [Google Scholar]
- 56.Rao KN, Smuda C, Gregory GD, Min B, Brown MA. Ikaros limits basophil development by suppressing C/EBP-α expression. Blood. 2013;122(15):2572–2581. doi: 10.1182/blood-2013-04-494625. [DOI] [PMC free article] [PubMed] [Google Scholar]
- 57.Westra H-J, et al. Systematic identification of trans eQTLs as putative drivers of known disease associations. Nat Genet. 2013;45(10):1238–1243. doi: 10.1038/ng.2756. [DOI] [PMC free article] [PubMed] [Google Scholar]
- 58.Gudbjartsson DF, et al. Sequence variants affecting eosinophil numbers associate with asthma and myocardial infarction. Nat Genet. 2009;41(3):342–347. doi: 10.1038/ng.323. [DOI] [PubMed] [Google Scholar]
- 59.Nandakumar SK, et al. Low-level GATA2 overexpression promotes myeloid progenitor self-renewal and blocks lymphoid differentiation in mice. Exp Hematol. 2015;43(7):565–577.e1–10. doi: 10.1016/j.exphem.2015.04.002. [DOI] [PubMed] [Google Scholar]
- 60.Li Y, Qi X, Liu B, Huang H. The STAT5-GATA2 pathway is critical in basophil and mast cell differentiation and maintenance. J Immunol. 2015;194(9):4328–4338. doi: 10.4049/jimmunol.1500018. [DOI] [PMC free article] [PubMed] [Google Scholar]
- 61.Nadif R, Zerimech F, Bouzigon E, Matran R. The role of eosinophils and basophils in allergic diseases considering genetic findings. Curr Opin Allergy Clin Immunol. 2013;13(5):507–513. doi: 10.1097/ACI.0b013e328364e9c0. [DOI] [PubMed] [Google Scholar]
- 62.Min B. Basophils: What they “can do” versus what they “actually do.”. Nat Immunol. 2008;9(12):1333–1339. doi: 10.1038/ni.f.217. [DOI] [PubMed] [Google Scholar]
- 63.Sullivan BM, Locksley RM. Basophils: A nonredundant contributor to host immunity. Immunity. 2009;30(1):12–20. doi: 10.1016/j.immuni.2008.12.006. [DOI] [PubMed] [Google Scholar]
- 64.Sudlow C, et al. UK Biobank: An open access resource for identifying the causes of a wide range of complex diseases of middle and old age. PLoS Med. 2015;12(3):e1001779. doi: 10.1371/journal.pmed.1001779. [DOI] [PMC free article] [PubMed] [Google Scholar]
- 65.Jostins L, et al. International IBD Genetics Consortium (IIBDGC) Host-microbe interactions have shaped the genetic architecture of inflammatory bowel disease. Nature. 2012;491(7422):119–124. doi: 10.1038/nature11582. [DOI] [PMC free article] [PubMed] [Google Scholar]
- 66.Franke A, et al. Genome-wide meta-analysis increases to 71 the number of confirmed Crohn’s disease susceptibility loci. Nat Genet. 2010;42(12):1118–1125. doi: 10.1038/ng.717. [DOI] [PMC free article] [PubMed] [Google Scholar]
- 67.Imielinski M, et al. Western Regional Alliance for Pediatric IBD; International IBD Genetics Consortium; NIDDK IBD Genetics Consortium; Belgian-French IBD Consortium; Wellcome Trust Case Control Consortium Common variants at five new loci associated with early-onset inflammatory bowel disease. Nat Genet. 2009;41(12):1335–1340. doi: 10.1038/ng.489. [DOI] [PMC free article] [PubMed] [Google Scholar]
- 68.Bush WS, Oetjens MT, Crawford DC. Unravelling the human genome-phenome relationship using phenome-wide association studies. Nat Rev Genet. 2016;17(3):129–145. doi: 10.1038/nrg.2015.36. [DOI] [PubMed] [Google Scholar]
- 69.Nandakumar SK, Ulirsch JC, Sankaran VG. Advances in understanding erythropoiesis: Evolving perspectives. Br J Haematol. 2016;173(2):206–218. doi: 10.1111/bjh.13938. [DOI] [PMC free article] [PubMed] [Google Scholar]
- 70.Graf T, Enver T. Forcing cells to change lineages. Nature. 2009;462(7273):587–594. doi: 10.1038/nature08533. [DOI] [PubMed] [Google Scholar]
- 71.Mukai K, et al. Critical role of P1-Runx1 in mouse basophil development. Blood. 2012;120(1):76–85. doi: 10.1182/blood-2011-12-399113. [DOI] [PMC free article] [PubMed] [Google Scholar]
- 72.Qi X, et al. Antagonistic regulation by the transcription factors C/EBPα and MITF specifies basophil and mast cell fates. Immunity. 2013;39(1):97–110. doi: 10.1016/j.immuni.2013.06.012. [DOI] [PMC free article] [PubMed] [Google Scholar]
- 73.Collins FS, Varmus H. A new initiative on precision medicine. N Engl J Med. 2015;372(9):793–795. doi: 10.1056/NEJMp1500523. [DOI] [PMC free article] [PubMed] [Google Scholar]
- 74.Sanjana NE, Shalem O, Zhang F. Improved vectors and genome-wide libraries for CRISPR screening. Nat Methods. 2014;11(8):783–784. doi: 10.1038/nmeth.3047. [DOI] [PMC free article] [PubMed] [Google Scholar]
- 75.Li H, Durbin R. Fast and accurate short read alignment with Burrows-Wheeler transform. Bioinformatics. 2009;25(14):1754–1760. doi: 10.1093/bioinformatics/btp324. [DOI] [PMC free article] [PubMed] [Google Scholar]
- 76.Van der Auwera GA, et al. From FastQ data to high confidence variant calls: The Genome Analysis Toolkit best practices pipeline. Curr Protoc Bioinformatics. 2013;43(SUPL.43):1–33. doi: 10.1002/0471250953.bi1110s43. [DOI] [PMC free article] [PubMed] [Google Scholar]
- 77.DePristo MA, et al. A framework for variation discovery and genotyping using next-generation DNA sequencing data. Nat Genet. 2011;43(5):491–498. doi: 10.1038/ng.806. [DOI] [PMC free article] [PubMed] [Google Scholar]
- 78.McKenna A, et al. The Genome Analysis Toolkit: A MapReduce framework for analyzing next-generation DNA sequencing data. Genome Res. 2010;20(9):1297–1303. doi: 10.1101/gr.107524.110. [DOI] [PMC free article] [PubMed] [Google Scholar]
- 79.Li H. Toward better understanding of artifacts in variant calling from high-coverage samples. Bioinformatics. 2014;30(20):2843–2851. doi: 10.1093/bioinformatics/btu356. [DOI] [PMC free article] [PubMed] [Google Scholar]
- 80.Delaneau O, Marchini J, Zagury J-F. A linear complexity phasing method for thousands of genomes. Nat Methods. 2011;9(2):179–181. doi: 10.1038/nmeth.1785. [DOI] [PubMed] [Google Scholar]
- 81.Joshi PK, et al. Variants near CHRNA3/5 and APOE have age- and sex-related effects on human lifespan. Nat Commun. 2016;7:11174. doi: 10.1038/ncomms11174. [DOI] [PMC free article] [PubMed] [Google Scholar]
- 82.Männik K, et al. Copy number variations and cognitive phenotypes in unselected populations. JAMA. 2015;313(20):2044–2054. doi: 10.1001/jama.2015.4845. [DOI] [PMC free article] [PubMed] [Google Scholar]
- 83.Lall K, Magi R, Morris A, Metspalu A, Fischer K. Personalized risk prediction for type 2 diabetes: The potential of genetic risk scores. Genet Med. 2016 doi: 10.1038/gim.2016.103. in press. [DOI] [PMC free article] [PubMed] [Google Scholar]
- 84.Howie BN, Donnelly P, Marchini J. A flexible and accurate genotype imputation method for the next generation of genome-wide association studies. PLoS Genet. 2009;5(6):e1000529. doi: 10.1371/journal.pgen.1000529. [DOI] [PMC free article] [PubMed] [Google Scholar]
- 85.Marchini J, Howie B, Myers S, McVean G, Donnelly P. A new multipoint method for genome-wide association studies by imputation of genotypes. Nat Genet. 2007;39(7):906–913. doi: 10.1038/ng2088. [DOI] [PubMed] [Google Scholar]
- 86.Willer CJ, et al. Newly identified loci that influence lipid concentrations and risk of coronary artery disease. Nat Genet. 2008;40(2):161–169. doi: 10.1038/ng.76. [DOI] [PMC free article] [PubMed] [Google Scholar]
- 87.Kumar P, Henikoff S, Ng PC. Predicting the effects of coding non-synonymous variants on protein function using the SIFT algorithm. Nat Protoc. 2009;4(7):1073–1081. doi: 10.1038/nprot.2009.86. [DOI] [PubMed] [Google Scholar]
- 88.Adzhubei IA, et al. A method and server for predicting damaging missense mutations. Nat Methods. 2010;7(4):248–249. doi: 10.1038/nmeth0410-248. [DOI] [PMC free article] [PubMed] [Google Scholar]
- 89.Browning BL, Browning SR. Genotype imputation with millions of reference samples. Am J Hum Genet. 2016;98(1):116–126. doi: 10.1016/j.ajhg.2015.11.020. [DOI] [PMC free article] [PubMed] [Google Scholar]
- 90.Handsaker RE, et al. Large multiallelic copy number variations in humans. Nat Genet. 2015;47(3):296–303. doi: 10.1038/ng.3200. [DOI] [PMC free article] [PubMed] [Google Scholar]
- 91.Chan Y, et al. GIANT Consortium Genome-wide analysis of body proportion classifies height-associated variants by mechanism of action and implicates genes important for skeletal development. Am J Hum Genet. 2015;96(5):695–708. doi: 10.1016/j.ajhg.2015.02.018. [DOI] [PMC free article] [PubMed] [Google Scholar]
- 92.Altshuler DM, et al. International HapMap 3 Consortium Integrating common and rare genetic variation in diverse human populations. Nature. 2010;467(7311):52–58. doi: 10.1038/nature09298. [DOI] [PMC free article] [PubMed] [Google Scholar]
- 93. Purcell S, Chang C (2015) PLINK 1.9. Available at https://www.cog-genomics.org/plink2. Accessed November 1, 2015.
- 94.Chang CC, et al. Second-generation PLINK: Rising to the challenge of larger and richer datasets. Gigascience. 2015;4(1):7. doi: 10.1186/s13742-015-0047-8. [DOI] [PMC free article] [PubMed] [Google Scholar]
- 95.UK Biobank 2015 Genotyping and Quality Control of UK Biobank, a Large-Scale, Extensively Phenotyped Prospective Resource. Available at biobank.ctsu.ox.ac.uk/crystal/docs/genotyping_qc.pdf. Accessed April 1, 2016.
- 96.Purcell S, Cherny SS, Sham PC. Genetic power calculator: Design of linkage and association genetic mapping studies of complex traits. Bioinformatics. 2003;19(1):149–150. doi: 10.1093/bioinformatics/19.1.149. [DOI] [PubMed] [Google Scholar]
- 97.Wakefield J. Bayes factors for genome-wide association studies: Comparison with P-values. Genet Epidemiol. 2009;33(1):79–86. doi: 10.1002/gepi.20359. [DOI] [PubMed] [Google Scholar]
- 98.Yue F, et al. Mouse ENCODE Consortium A comparative encyclopedia of DNA elements in the mouse genome. Nature. 2014;515(7527):355–364. doi: 10.1038/nature13992. [DOI] [PMC free article] [PubMed] [Google Scholar]
- 99.Pollard KS, Hubisz MJ, Rosenbloom KR, Siepel A. Detection of nonneutral substitution rates on mammalian phylogenies. Genome Res. 2010;20(1):110–121. doi: 10.1101/gr.097857.109. [DOI] [PMC free article] [PubMed] [Google Scholar]
- 100.Davydov EV, et al. Identifying a high fraction of the human genome to be under selective constraint using GERP++ PLOS Comput Biol. 2010;6(12):e1001025. doi: 10.1371/journal.pcbi.1001025. [DOI] [PMC free article] [PubMed] [Google Scholar]
- 101.Rosenbloom KR, et al. The UCSC Genome Browser database: 2015 update. Nucleic Acids Res. 2015;43(Database issue) D1:D670–D681. doi: 10.1093/nar/gku1177. [DOI] [PMC free article] [PubMed] [Google Scholar]
- 102.Kulakovskiy IV, et al. HOCOMOCO: Expansion and enhancement of the collection of transcription factor binding sites models. Nucleic Acids Res. 2016;44(D1):D116–D125. doi: 10.1093/nar/gkv1249. [DOI] [PMC free article] [PubMed] [Google Scholar]
- 103.Mathelier A, et al. JASPAR 2016: A major expansion and update of the open-access database of transcription factor binding profiles. Nucleic Acids Res. 2016;44(D1):D110–D115. doi: 10.1093/nar/gkv1176. [DOI] [PMC free article] [PubMed] [Google Scholar]
- 104.Grant CE, Bailey TL, Noble WS. FIMO: Scanning for occurrences of a given motif. Bioinformatics. 2011;27(7):1017–1018. doi: 10.1093/bioinformatics/btr064. [DOI] [PMC free article] [PubMed] [Google Scholar]
- 105.Rao SSP, et al. A 3D map of the human genome at kilobase resolution reveals principles of chromatin looping. Cell. 2014;159(7):1665–1680. doi: 10.1016/j.cell.2014.11.021. [DOI] [PMC free article] [PubMed] [Google Scholar]
Associated Data
This section collects any data citations, data availability statements, or supplementary materials included in this article.


