Significance
The extracellular production of hydrogen peroxide (H2O2) by membrane or secreted oxidases has been linked to epithelial wound repair, defense against infection, and inflammation. Here, we elucidate the pathway that explains how extracellular H2O2 transduces a signal into the cell to induce these critical cell functions. Our study shows the central component of this pathway in the mammalian colon is the H2O2-conducting aquaglyceroporin AQP3 and implicates this channel in innate immune responses at mucosal surfaces.
Keywords: aquaporin-3, hydrogen peroxide, colon, epithelium, microbe
Abstract
The colonic epithelium provides an essential barrier against the environment that is critical for protecting the body and controlling inflammation. In response to injury or gut microbes, colonic epithelial cells produce extracellular hydrogen peroxide (H2O2), which acts as a potent signaling molecule affecting barrier function and host defense. In humans, impaired regulation of H2O2 in the intestine has been associated with early-onset inflammatory bowel disease and colon cancer. Here, we show that signal transduction by H2O2 depends on entry into the cell by transit through aquaporin-3 (AQP3), a plasma membrane H2O2-conducting channel. In response to injury, AQP3-depleted colonic epithelial cells showed defective lamellipodia, focal adhesions, and repair after wounding, along with impaired H2O2 responses after exposure to the intestinal pathogen Citrobacter rodentium. Correspondingly, AQP3−/− mice showed impaired healing of superficial wounds in the colon and impaired mucosal innate immune responses against C. rodentium infection, manifested by reduced crypt hyperplasia, reduced epithelial expression of IL-6 and TNF-α, and impaired bacterial clearance. These results elucidate the signaling mechanism of extracellular H2O2 in the colonic epithelium and implicate AQP3 in innate immunity at mucosal surfaces.
In the mammalian colon, a single-cell-thick continuous layer of epithelial cells (ECs) forms the physical barrier that constitutes the interface between the body and the gut lumen, a compartment heavily laden with environmental microbes and other foreign and potentially toxic substances. Major gastrointestinal diseases, including infections and inflammatory bowel disease (IBD), are associated with dysfunction of the epithelial barrier (1). In both health and disease, mechanisms are in place to restore barrier function after injury and to defend against microbial colonization and invasion.
One of the pathways underlying barrier restitution and innate host defense against gut microbes depends on the generation of extracellular hydrogen peroxide (H2O2) by the epithelial monolayer. Exactly how extracellular H2O2 signals are transduced to cellular responses in the host epithelium remains incompletely characterized, especially at mucosal surfaces, where commensal microbes can produce H2O2 in the absence of epithelial injury or pathogenic infection.
H2O2 is a stable reactive oxygen species (ROS) molecule that acts as an extracellular and intracellular signal that mediates pleiotropic effects in tissues, including recruitment of immune cells to damaged areas and cell migration (2–4). In the intestine, the generation of extracellular H2O2 at the mucosal or serosal surface is carried out by NADPH oxidase (NOX) enzymes, such as NOX1 and dual oxidase 2 (DUOX2) (5, 6). NOX1 is highly expressed in the mammalian colon, and the NOX enzymes are important in the defense against microbial pathogens and for regenerative homeostasis (7, 8). In addition, NOX enzymes are thought to play a role in the pathogenesis of IBD, with inactivating mutations recently described in children with early-onset IBD and strong DUOX2 up-regulation found in inflamed pediatric ileal biopsy specimens (9, 10).
Aquaporin-3 (AQP3), a member of the aquaporin water channel family, is a water-, glycerol-, and H2O2-transporting protein implicated in various cellular functions (11, 12). AQP3-mediated H2O2 transport has been reported to modulate epidermal growth factor signaling in ECs (13) and TNF-α signaling in skin keratinocytes (14, 15). In addition, AQP3-mediated H2O2 transport has been shown to be important for T-cell and breast cancer cell migration (16, 17), although how AQP3 contributes to these changes in cellular function remains undefined. In the colon, AQP3 is expressed in ECs, with changes in expression found in response to inflammation, and our previous studies showed that mice lacking AQP3 experienced impaired recovery after chemical-induced colitis (18, 19).
In the present study, we tested whether AQP3 mediates the entry of extracellular H2O2 into ECs lining the colon, and, if this explains the H2O2-dependent mucosal responses to epithelial injury and microbial infection.
Results
AQP3 Renders the Colonic Epithelium Responsive to Extracellular H2O2.
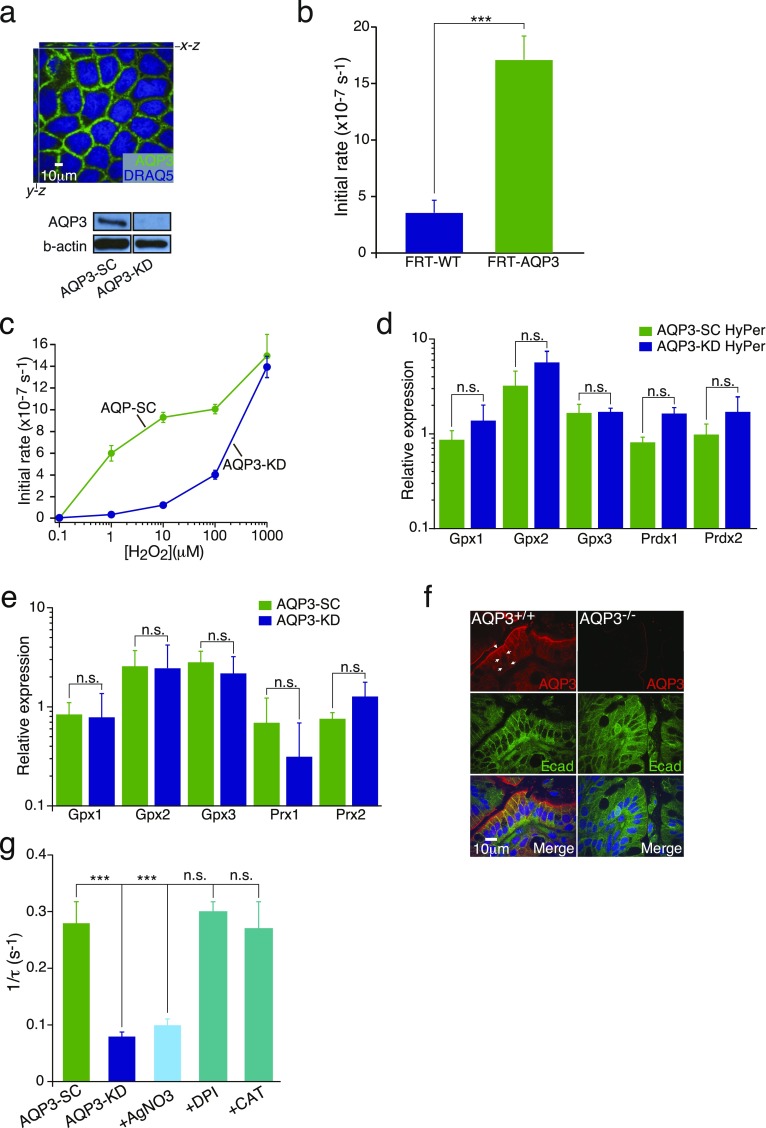
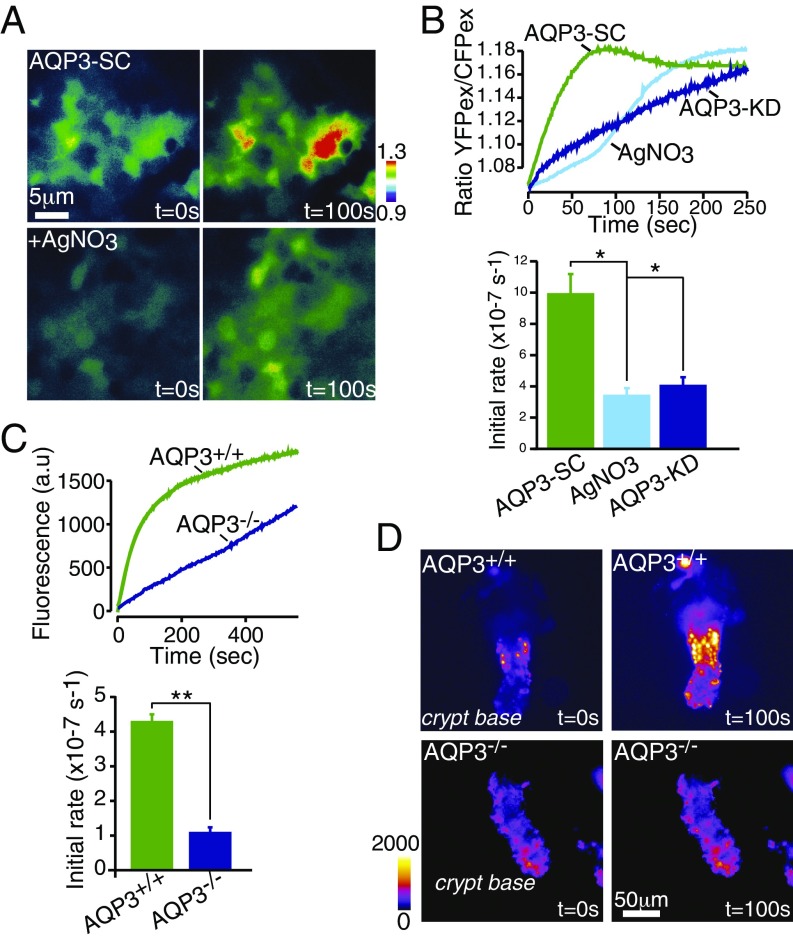
H2O2 transport was measured by live cell imaging using a ratiometric H2O2-sensitive fluorescent protein (HyPer) stably transfected in Caco-2 colon ECs depleted of AQP3 (shRNA; AQP3-KD) or in control Caco-2 cells expressing AQP3 (scrambled shRNA; AQP3-SC). HyPer fluorescence ratios reflect changes in cytosolic H2O2 concentration and represent an indirect measure of extracellular H2O2 entry into cells. AQP3 is localized to the plasma membrane in Caco-2 cells, and analysis of AQP3 protein expression demonstrated efficient knockdown (Fig. S1A). When exposed to medium containing H2O2, cytosolic increases in H2O2 were significantly faster in cells expressing AQP3 compared with cells depleted of AQP3 or in which AQP3 transport was acutely inhibited by AgNO3 (Fig. 1 A and B). Similarly, cells lacking endogenous AQP3 (FRT cells) showed greatly increased rates of H2O2 elevation after transfection with AQP3 (Fig. S1B).
Fig. S1.
(A, Upper) Immunostaining for AQP3 (green) and nuclei (DRAQ5, blue) in AQP3-SC (WT) Caco-2 colonic ECs. (A, Lower) Immunoblot showing efficient shRNA knockdown of AQP3 (AQP3-KD) in Caco-2 cells. (B) Summary of mean initial rates of cellular H2O2 measured by HyPer fluorescence in WT FRT ECs (FRT-WT) or FRT cells overexpressing AQP3 (FRT-AQP3). n = 4. ***P < 0.001. (C) Dose–response for H2O2-induced increases (initial rates) in cytosolic H2O2 in Caco-2 cells. (D) Relative expression of cellular antioxidants (mRNA); glutathione peroxidase 1, 2, and 3 (Gpx1, Gpx2, Gpx3); and peroxiredoxin 1 and 2 (Prdx 1, Prdx 2) in AQP3-SC and AQP3-KD cells stably transfected with HyPer. (E) Relative expression of cellular antioxidants (mRNA), glutathione peroxidase 1, 2, and 3 (Gpx1, Gpx2, Gpx3), and peroxiredoxin 1 and 2 (Prdx 1, Prdx 2) in AQP3-SC and AQP3-KD (not transfected with HyPer). n = 3. (F) Representative images showing AQP3 expression (red) in mouse distal colon of AQP3+/+ and AQP3−/− mice with e-cadherin (green). (G) Summary of mean water permeability rates showing reciprocal exponential time constants (1/τ) of osmotic cell volume equilibration as measured by calcein fluorescence in Caco-2 cells containing AQP3 (AQP3-SC) or after AgNO3, DPI, and catalase treatment and in AQP3 knockdown cells (AQP3-KD). n = 3. **P < 0.01; ***P < 0.001.
Fig. 1.
AQP3 transports extracellular H2O2 into colonic epithelia. (A) Caco-2 cells expressing H2O2-sensitive YFP (HyPer) show increased intracellular H2O2 (ratio fluorescence) on exposure to 100 µM H2O2, which is inhibited by AgNO3 (5 µM), supporting AQP3-facilitated H2O2 transport. (B) Representative traces of increases in the HyPer ratio after the addition of 100 µM H2O2 in Caco-2 cells transfected with control shRNA (AQP-SC) or after treatment with AgNO3 (5 µM) or in AQP3-KD cells (Upper), and mean initial rates of increase in cellular H2O2 (Lower); n = 6. (C) Representative traces of increases in CM-H2-DCFDA fluorescence after addition of 100 µM H2O2 in AQP3+/+ and AQP3−/− intestinal crypts (Upper) and mean initial rates of increase in cellular H2O2 (Lower); n = 4. (D) Representative images showing increased H2O2 entry in intestinal crypts from AQP3+/+ and AQP3−/− mice measured using CM-H2-DCFDA after the addition of extracellular 100 µM H2O2 pulse.
Because antioxidant cytosolic proteins, such as glutathione peroxidases (Gpx) and peroxiredoxins (Prx), rapidly remove free cellular H2O2, the rate-limiting step for the cytosolic increases in H2O2 in our model systems is determined primarily by H2O2 membrane permeability. Thus, increased H2O2 membrane permeability in the presence of AQP3 should cause increases in cytosolic H2O2 at much lower concentrations of extracellular H2O2. Dose–response studies have shown this prediction to be correct. AQP3-containing Caco-2 cells responded to extracellular H2O2 at 100-fold lower concentrations compared with Caco-2 cells depleted of AQP3 (Fig. S1C). Importantly, uptake was observed in the concentration range critical for cellular H2O2 signaling (1–100 µM) (3, 13, 21), and the expression of antioxidant proteins was not different between AQP3-KD and AQP3-SC cells (Fig. S1 D and E). At much higher and toxic concentrations of H2O2 (>1 mM), cellular entry was not rate-limited by AQP3, but was governed by the intrinsic membrane permeability to H2O2. Thus, the presence or absence of membrane AQP3 allows colonic ECs to discriminate extracellular H2O2 signals.
To test this idea in primary ECs in situ, we isolated colonic crypts from AQP3−/− and AQP3+/+ mice. ECs in WT (AQP3+/+) mice express AQP3 on both apical and basolateral membranes (Fig. S1F). Colonic crypts from AQP3−/− mice and exposed to exogenous H2O2 showed a much slower increase in cytoplasmic H2O2 compared with crypts from AQP3+/+ mice, consistent with AQP3-facilitated H2O2 entry in AQP3+/+ mice (Fig. 1 C and D).
Epithelial Repair and Wound Healing Depends on H2O2 Transport via AQP3.
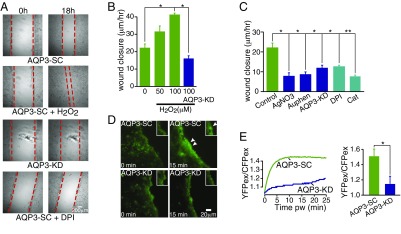
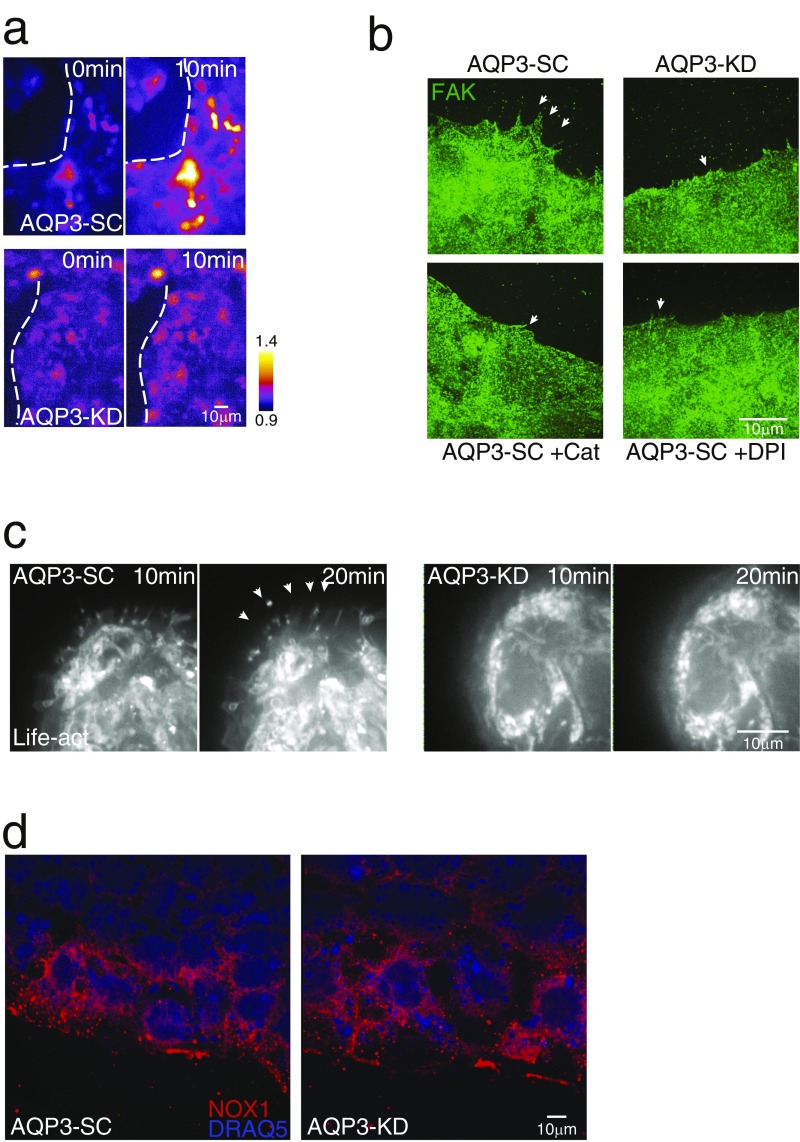
To test whether AQP3-dependent H2O2 transport underlies signal transduction in the intestine, we investigated cell migration and barrier repair in response to injury, an important EC function modulated by extracellular H2O2. Studies on monolayers of WT Caco-2 cells after an initial scratch wounding showed that the addition of H2O2 increased cell migration and wound closure (Fig. 2 A and B), consistent with previous reports (20). Wound closure was slowed in AQP3-KD cells, as well as in control AQP3-SC cells after inhibition of AQP3 channel function by AgNO3 or Auphen (21, 22). Wound closure was similarly slowed in control (AQP3-SC) Caco-2 cells after the addition of diphenyleneiodonium (DPI), which inhibits the NOX enzymes normally involved in production of extracellular H2O2 after cell injury, and also by catalase, which enzymatically depletes extracellular H2O2 (Fig. 2C). For each of these inhibitors, the H2O2 specificity of their effect on wound healing was confirmed by showing their lack of effect on AQP3-dependent water transport (Fig. S1C). Finally, imaging of intracellular H2O2 at the wound edge of scratch-injured Caco-2 monolayers showed reduced H2O2 accumulation in AQP3-KD cells, consistent with the interpretation that wound healing is facilitated by H2O2 transport via AQP3 (Fig. 2 D and E and Fig. S2A).
Fig. 2.
H2O2 entry through AQP3 in ECs facilitates wound repair. (A) Representative images of colonic epithelial monolayers at 0 h and 18 h after scratch wounding with the addition of H2O2 (100 µM), or in AQP3 knockdown cells after the addition of DPI (20 µM). (B) Mean rates of wound closure in epithelial monolayers after addition of H2O2, n = 4. (C) Mean rates of wound closure in AQP3-SC cells in the absence of added H2O2 after the addition of AgNO3 (5 µM), Auphen (10 µM), and in AQP3 knockdown cells (AQP3-KD) or AQP3-SC cells in the presence of catalase (200 U) or DPI (20 µM). n = 4. (D) Representative images of CM-H2-DCFDA fluorescence showing H2O2 at the wound edge after scratch wounding in AQP3-SC and AQP3-KD cells. (E) Representative traces of the HyPer ratio change with time (Left) and mean ratio (Right) at the wound edge at 15 min after wounding. n = 4.
Fig. S2.
(A) Representative images of HyPer fluorescence in wound-associated ECs after wounding in AQP3-SC and AQP3-KD cells. The dotted line marks the wound edge. (B) Representative images of focal adhesion kinase expression (FAK; green) in wound-associated ECs after wounding (1 h) in AQP3-SC cells and after addition of catalase (200 U) or DPI (20 µM) and in AQP3-KD cells. The arrows indicate lamellipodia. (C) Images of AQP3-SC and AQP3-KD cells transfected with Life-act showing actin protrusions after the addition of fMLF (1 µM) in AQP3-SC cells (arrows). (D) Representative images of NOX1 staining in AQP3-SC and AQP3-KD cells.
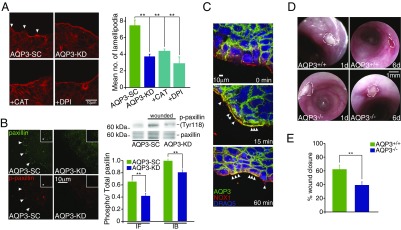
Closure of epithelial wounds after injury begins with migration of the wound-associated ECs from either side of the wound (23), which requires the production of numerous actin-driven lamellopodial projections. If AQP3 underlies wound signal transduction by H2O2, then the induction of lamellopdia also should be AQP3-dependent. To test this possibility, we imaged lamellopodia by actin staining in wound-associated Caco-2 cells depleted or not in AQP3 and in corresponding cells expressing eGFP-actin (Life-Act). Depletion of AQP3 or inhibition of H2O2 signaling by incubation with catalase or DPI decreased the numbers and sizes of actin-containing lamellopodia (Fig. 3A and Fig. S2 B and C). For lamellipodial assembly and cell migration, wound-associated ECs require active turnover of focal adhesion complexes controlled by phosphorylation of key focal adhesion proteins, such as paxillin and focal adhesion kinase. We tested for this by examining the induction of focal adhesion complexes. Both proteins were found to be depleted in wound-associated ECs lacking AQP3 (AQP3-KD cells) (Fig. 3B and Fig. S2B). In addition, the ratio of phosphorylated to total paxillin was reduced in AQP3-KD cells, suggesting reduced active focal adhesions at the wound edge (Fig. 3B). The assembly of lamellopodia at the wound edge was accompanied by the expression and colocalization of AQP3 and NOX1 at these sites in AQP3-expressing cells (Fig. 3C), suggesting active regulation of cell migration by spatially coordinated H2O2 production (NOX1) and membrane H2O2 permeability (AQP3).
Fig. 3.
AQP3-mediated H2O2 entry induces lamellipodia formation at the wound edge. (A) Representative images of actin showing lamellipodia in wound-associated colonic ECs at 1 h after wounding in AQP3-SC cells and after the addition of catalase (200 U) or DPI (20 µM) and in AQP3-KD cells (Left), and mean number of lamellipodia measured from imaging (Right). n = 4. (B) Representative images of total paxillin (green) and phosphorylated paxillin (red) in wound-associated colonic ECs after wounding (1 h) in AQP3-SC cells and in AQP3-KD cells (Left); immunoblots of total and phosphorylated paxillin in wounded AQP3-SC cells and in AQP3-KD cells (Right, Upper); and mean ratio of total/phosphorylated paxillin measured from imaging (IF; n = 4) and immunoblot (IB; n = 3) (Right, Lower). (C) Representative images showing AQP3 (green), NOX1 (red), and DRAQ5 (blue) in AQP3-SC wound-associated colonic ECs after wounding. Arrows indicate colocalization of AQP3 and NOX1 and/or lamelipodia. (D) Endoscopic images of mouse distal colon after superficial biopsy wounds in AQP3+/+ (Upper) and AQP3−/− (Lower) mice at 1 d and 6 d after wounding. Dotted lines indicate the wound area. (E) Summary of wound healing in AQP3+/+ and AQP3−/− mice expressed as percentage of wound closure at 6 d postwounding. n = 6 mice, three to five wounds per mouse.
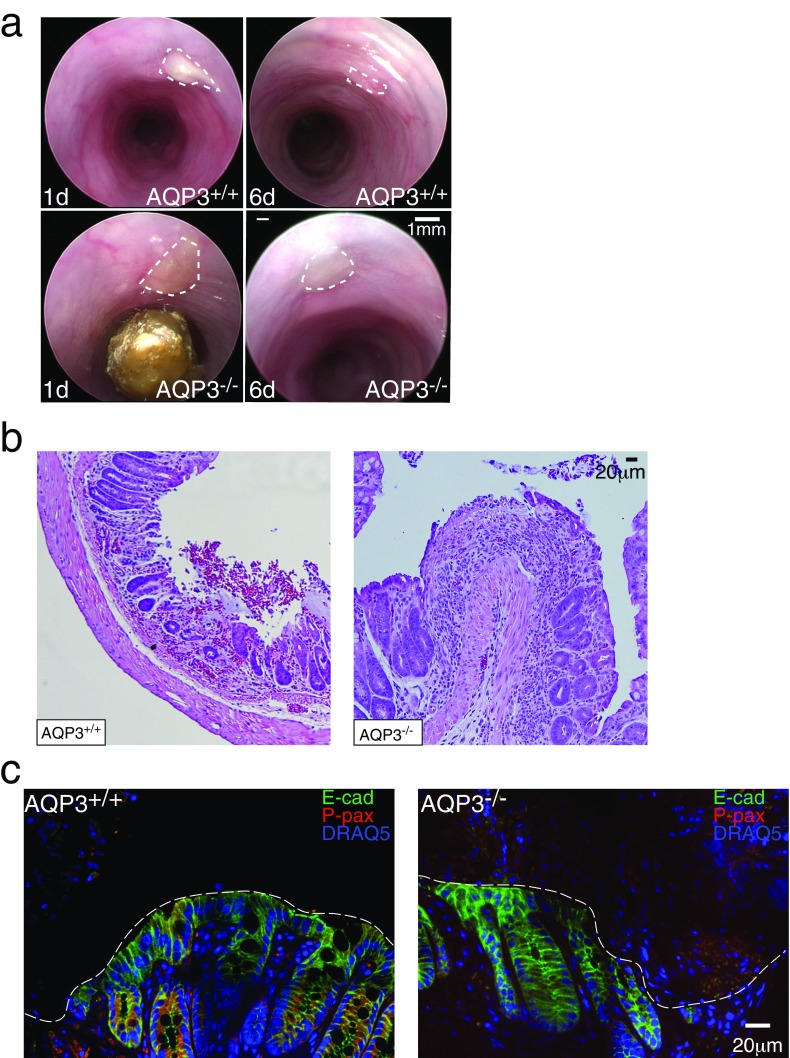
To test this pathway in vivo, we created endoscopic wounds in the colons of AQP3−/− and AQP3+/+ mice and assessed wound healing by endoscopic visualization as described previously (24). AQP3−/− mice had distinctly impaired superficial wound healing, as assessed by analysis of the healed wound area at 6 d after injury (Fig. 3 D and E and Fig. S3A). ECs at the edge of the induced wounds showed a small increase in phosphorylated paxillin on day 1 postinjury in AQP3+/+ mice compared with AQP3−/− mice (Fig. S3 B and C). Thus, AQP3-facilliated H2O2 entry underlies the native NOX/ H2O2-dependent epithelial response to injury and barrier repair.
Fig. S3.
(A) Additional endoscopic images of mouse distal colon after superficial biopsy wounds in AQP3+/+ (Upper) and AQP3−/− (Lower) mice at 1 and 6 d after wounding. The dotted lines indicate the wound area. (B) H&E-stained sections of biopsy wounds in AQP3+/+ and AQP3−/− mice. (C) Images of phosphorylated paxillin staining in biopsy wounds in AQP3+/+ and AQP3−/− mice.
Host Defense Against Citrobacter rodentium Infection Depends on H2O2 Transport via AQP3.
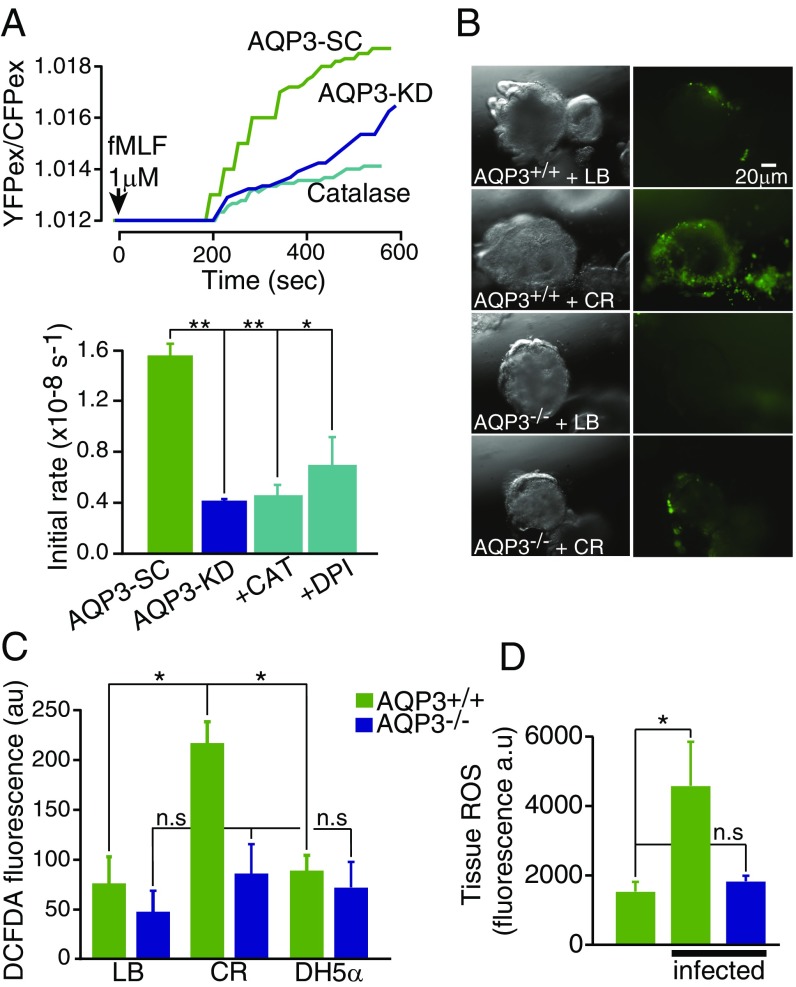
Because colonic ECs form the primary barrier against microbes and microbial products, we next tested whether AQP3-dependent H2O2 transport may modulate signal transduction in host defense. N-Formyl-l-methionyl-l-leucyl-l-phenylalanine (fMLF) is a uniformly expressed microbial peptide that acts as potent chemotactic peptide by binding formyl peptide receptors of immune and nonimmune cell types. In the intestine, activation of formyl peptide receptors of surface ECs leads to activation of NOX1 and generation of extracellular H2O2, which mediates the epithelial response to wound healing. In alignment with this and our earlier results (Figs. 1–3), the addition of fMLF to colon ECs produced a time-dependent increase in cellular H2O2 that was attenuated in AQP3-KD monolayers and blocked in WT Caco-2 cells by depletion of extracellular H2O2 using catalase and inhibition of NOX1 using DPI (Fig. 4A).
Fig. 4.
fMLF and C. rodentium induce epithelial H2O2 entry via AQP3. (A) Representative traces of HyPer ratio change in Caco-2 colonic ECs after the addition of fMLF (1 µM) (Upper), and summary of the mean initial rate of H2O2 increase (Lower). n = 5. (B) Images of mouse distal colonoids from AQP3+/+ and AQP3−/− mice after microinjection into the colonoid lumen of media (LB) or C. rodentium (CR, 1 × 10⁷ cfu) showing CM-H2-DCFDA fluorescence and brightfield. (C) Summary of mean CM-H2-DCFDA fluorescence in AQP3+/+ and AQP3−/− colonoids microinjected with LB, CR, or DH5α. n = 3. (D) Summary of accumulation of colonic epithelial ROS species in colon from AQP3+/+ and AQP3−/− mice measured by ROS550 fluorescence at 3 d postinfection with CR. n = 3.
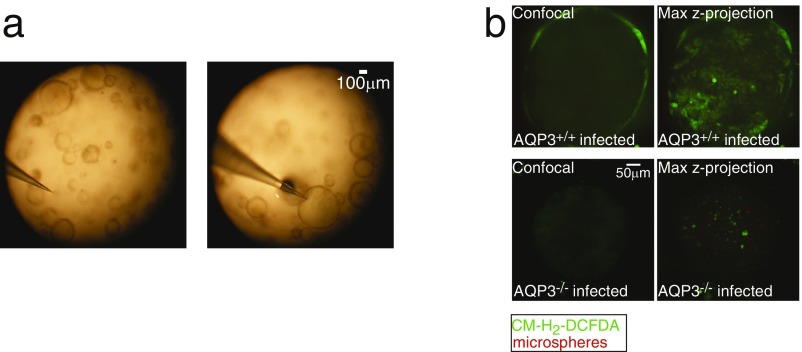
To test whether a colonic pathogen can induce such a response, and whether this action is AQP3-dependent, colonoids generated from AQP3+/+ and AQP3−/− mice were exposed to the noninvasive, attaching, and effacing pathogen C. rodentium, the murine equivalent of enteropathogenic Escherichia coli in humans. C. rodentium or nonpathogenic E. coli (DH5α) were microinjected into the lumen of the colonoids (Fig. 4B and Fig. S4A). Luminal incubation with C. rodentium, but not with growth medium alone or E. coli DH5α, induced a robust increase in cellular H2O2 that was significantly attenuated in AQP3−/− colonoids (Fig. 4 B and C and Fig. S4B). Similarly, colonic tissue from AQP3−/− mice infected with C. rodentium showed reduced accumulation of ROS in surface colonic ECs compared with infected AQP3+/+ mice (Fig. 4D).
Fig. S4.
(A) Images showing microinjection of colonoids. (B) Confocal and maximum z-projected images of CM-H2-DCFDA (green) fluorescence with red microspheres in the lumen in AQP3+/+ and AQP3−/− colonoids infected with C. rodentium.
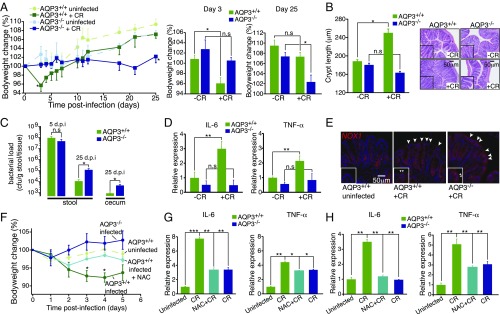
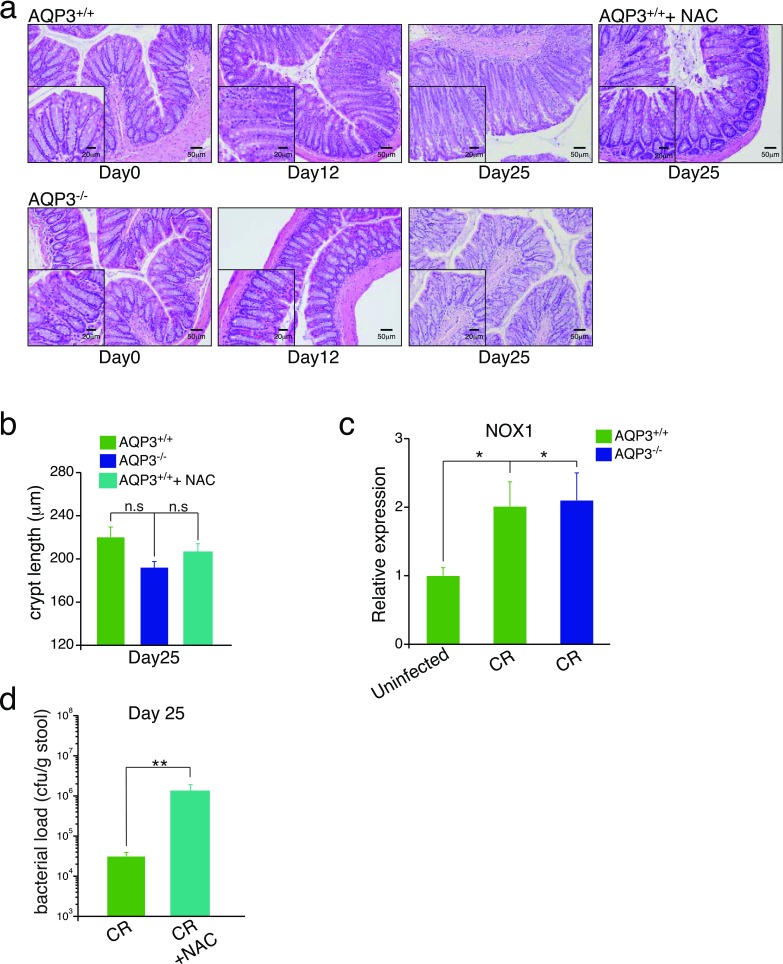
In vivo, colonic infection by C. rodentium induces a robust early mucosal inflammatory response required for subsequent bacterial clearance and recovery. Induction of this response depends on direct interaction of the bacteria with the epithelium and ROS signaling (25, 26). To test whether AQP3 mediates this recovery, we studied C. rodentium infection in AQP3+/+ and AQP3−/− mice. AQP3+/+ mice infected with C. rodentium showed an early loss in body weight at 3–6 d postinfection with subsequent crypt hyperplasia, indicative of the early inflammatory response. Body weight then recovered, as described previously (27) and in contrast to AQP3−/− mice (Fig. 5 A and B). AQP3−/− mice showed no initial loss of weight or crypt hyperplasia at early stages of infection, and no weight gain later (days 18–25), consistent with the lack of an initial inflammatory response and persistent C. rodentium infection. This was further evidenced by the failure of AQP3−/− mice to show increased expression of the inflammatory cytokines IL-6 and TNF-α at early stages of infection, as well as the failure to clear the bacteria from the colon at later stages (Fig. 5 C and D). At later stages of infection (day 25), AQP3+/+ mice exhibited reduced crypt hyperplasia in conjunction with resolution of the infection. In contrast, AQP3−/− mouse crypts showed a delayed increase in crypt length, possibly a result of persistent bacterial colonization (Fig. S5B). Importantly, in both AQP3+/+ and AQP3−/− mice, Nox1 expression was up-regulated in surface ECs after infection (Fig. 5E and Fig. S5C). Furthermore, AQP3+/+ mice given N-acetyl cysteine (NAC) in drinking water, a well-tolerated antioxidant that removes free H2O2, phenocopied AQP3−/− mice at early stages of C. rodentium infection (Fig. 5 F and G) and showed impaired bacterial clearance and cytokine expression at later stages of infection (Fig. S5 A, B, and D). Thus, AQP3 is required for H2O2 signaling in the colon and for the epithelial response to infection by C. rodentium.
Fig. 5.
AQP3-dependent mucosal response to C. rodentium infection in vivo. (A) Time course of body weight change after C. rodentium (CR) infection in AQP3+/+ and AQP3−/− mice, and mean bodyweight change at days 3 and 25 postinfection. n = 6. (B) Crypt length (µm) in AQP3+/+ and AQP3−/− mice at 12 d postinfection and representative H&E images of crypt hyperplasia in AQP3+/+, but not AQP3−/−, distal colon at 12 d postinfection. n = 6. (C) CR bacterial load in stool at 5 and 25 d postinfection and cecum tissue at 25 d postinfection. n = 6. (D) Relative expression of IL-6 and TNF-α mRNA in isolated ECs at 5 d postinfection. n = 6. (E) Images of NOX1 (red) expression in distal colon at 5 d postinfection. Arrows indicate increased expression in surface ECs after infection. (F) Time course of mean body weight change after CR infection in AQP3+/+ mice, AQP3+/+ mice administered NAC, and AQP3−/− mice. n = 5. (G) Relative expression of IL-6 and TNF-α mRNA in isolated ECs from AQP3+/+ mice, AQP3+/+ mice administered NAC, and AQP3−/− mice at 5 d postinfection. n = 5. (H) Relative expression of IL-6 and TNF-α mRNA at 25 d postinfection. n = 4.
Fig. S5.
(A) Additional H&E-stained sections of mouse distal colon at 0, 12, and 25 d after C. rodentium infection in AQP3+/+ and AQP3−/− mice. (B) Crypt length (µm) in AQP3+/+ and AQP3−/− mice at 25 d postinfection. n = 4. (C) Relative expression of NOX1 mRNA in isolated ECs from infected and uninfected colons at 5 d postinfection. n = 4. **P < 0.01. (D) C. rodentium bacterial load (cfu/g of stool) at 25 d postinfection in AQP3+/+ mice and in AQP3+/+ mice after administration of NAC. n = 4. **P < 0.01.
Discussion
The innate immune function of ECs lining the colon is thought to be critical for the maintenance of epithelial transport and barrier functions in the face of a complex and potentially hostile luminal environment (1). Epithelial generation of H2O2 has been shown to be an important signal for wound repair and recruitment of inflammatory cells after injury. NOX and DUOX complexes at the intestinal epithelial plasma membrane generate H2O2 or superoxide (O−), which is rapidly converted to H2O2 by extracellular superoxide dismutase. In the distal colon, this appears to occur primarily via NOX1 based on its high regional expression (6). Studies in Drosophila, Caenorhabditis elegans, and zebrafish intestine have shown that epithelial production of H2O2 is part of the host response to gut infection and is involved in microbial clearance and responses to gut symbionts and pathogens (28–30). In mammals, a similar role has been postulated based on studies of pathogen infection in stomach and airway ECs (31, 32).
In the present study, we have shown that AQP3 mediates H2O2 signal transduction in colonic epithelia. The increased membrane permeability to H2O2 in AQP3-containing colonic ECs allows them to respond to external H2O2 at concentrations (1–100 µM) relevant for cellular signaling processes, such as migration and pathogen recognition. This was demonstrated both in vitro and in vivo by studying wound repair after injury and host defense against C. rodentium infection.
In the case of wound repair, various signaling proteins may be involved in translating the rapid H2O2 uptake facilitated by AQP3 into the signals required for the observed epithelial cytoskeletal and cell migratory responses. Previous studies have identified various candidate ROS-sensitive intracellular proteins, including the src family kinases and several tyrosine phosphatases, including SHP2 and PTP-PEST (4, 15, 26). These proteins contain free cysteines that can alter function and are affected by changes in cellular H2O2 levels. Given that the specific proteins involved are often cell type-specific, further studies are needed in primary EC systems to fully understand the signaling pathways and effectors of AQP3-facilliated H2O2 cellular entry.
Recent studies also have pointed to an important role for ROS signaling in relation to pathogen infection and microbial recognition, as well as in the mucosal inflammation seen in chronic inflammatory bowel diseases, which is associated with alterations in gut microbes (9, 28, 31, 33, 34). In the case of C. rodentium infection, ROS signaling has been shown to be required for a robust TH17 response and bacterial clearance (26). The results reported here suggest that this response is likely dependent on AQP3-mediated H2O2 signal transduction. In the skin epidermis, another bacterially colonized mucosal surface, AQP3-dependent H2O2 responses have been shown to play a role in the pathogenesis of psoriasis and in T-cell migration (14, 15). Further studies will help characterize how colonic epithelial cytokine secretion is regulated by AQP3-dependent H2O2 signals, and how this may modulate other epithelial innate immune pathways, such as Toll-like receptor signaling and activation of the Nlrp6 inflammasome (35, 36).
A recent study identified several mutations in epithelial NOXs in children with very-early-onset IBD. In these patients, defective production of H2O2 by ECs was linked to impaired initial host resistance to pathogenic infections (9), as we found here for AQP3−/− mice. Although AQP3 has not been identified as a monogenic cause of IBD, patients with ulcerative colitis have significantly lower expression of epithelial AQP3 during both inflammation and clinical remission (17). Conversely, AQP3 expression is highly increased in many colon carcinomas and is correlated with metastatic spread (37). As shown here, AQP3-dependent H2O2 cellular entry increases colonic epithelial migration, and it is plausible that AQP3-facilliated H2O2 transport may play a role in the development of colonic cancers and metastases.
Given that AQP3 is expressed in mucosal surface cells lining the colon, airway, genitourinary tract, and skin, we speculate that AQP3-faciliated H2O2 entry represents a general mechanism for mediating EC responses to the external environment. Environmental changes in commensal microbial composition or pathogenic infection generate a variety of signals that mucosal ECs are poised to recognize, including changes in redox status and the production of stable ROS species, such as H2O2, in the extracellular milieu. The mechanisms by which the host ECs discriminate between pathogenic “danger” H2O2 signals and homeostatic commensal H2O2 signals remains unknown, however. Accumulation of H2O2 at colonic EC surfaces can occur in a cell-autonomous manner through activation of NOX1 (5, 6), in a paracrine manner after release from gut commensal bacteria (34), or as a product of secreted enzymes, such as xanthine oxidase (38). In this context, and perhaps dependent on the source of H2O2 (cell-autonomous or paracrine) and/or its localization (luminal or subepithelial), AQP3-facilliated H2O2 transport in the epithelium may be intrinsic to host responses to the environment, including the acute and chronic adaptive response to gut commensal or pathogenic microbes.
Materials and Methods
The materials and experimental procedures used in this study are described in detail in SI Materials and Methods. Primer sequences for qRT-PCR are shown in Table S1.
Table S1.
Primer sequences for qRT-PCR
| Gene/Primer | Species | Sequence 5' to 3' |
| GPX-1-fwd | Hu | CAGTCGGTGTATGCCTTCTCG |
| GPX-1-rev | Hu | GAGGGACGCCACATTCTCG |
| GPX-2-fwd | Hu | GGTAGATTTCAATACGTTCCGGG |
| GPX-2-rev | Hu | TGACAGTTCTCCTGATGTCCAAA |
| GPX-3-fwd | Hu | AGAGCCGGGGACAAGAGAA |
| GPX-3-rev | Hu | ATTTGCCAGCATACTGCTTGA |
| Prdx-1-fwd | Hu | CCACGGAGATCATTGCTTTCA |
| Prdx-1-rev | Hu | AGGTGTATTGACCCATGCTAGAT |
| Prdx-2-fwd | Hu | GAAGCTGTCGGACTACAAAGG |
| Prdx-2-rev | Hu | TCGGTGGGGCACACAAAAG |
| IL6-fwd | Ms | TAGTCCTTCCTACCCCAATTTCC |
| IL6-rev | Ms | TTGGTCCTTAGCCACTCCTTC |
| TNFα-fwd | Ms | CCCTCACACTCAGATCATCTTCT |
| TNFα-rev | Ms | GCTACGACGTGGGCTACAG |
Mice.
AQP3+/+ and AQP3−/− mice in a CD1 genetic background were generated as described previously. Animals were maintained in a specific pathogen-free animal facility at Boston Children’s Hospital. Experiments were conducted after approval from Animal Care Systems and in accordance with regulations of the Institutional Animal Care and Use Committee.
H2O2 Fluorescence Ratio Imaging.
Stably transfected cells containing the H2O2-sensitive probe HyPer (39) on glass coverslips were placed in a microperfusion chamber (Warner Instruments) with HBSS with glucose at 37 °C and imaged.
In Vivo Colonoscopy.
AQP3+/+ and AQP3−/− mice (n = 3–5) were anesthetized by i.p. injection of a ketamine (100 mg/kg)/xylazine (10 mg/kg) solution. The distal colon was imaged using a high-resolution colonoscopy system (Karl Storz). To create superficial wounds, endoscopic biopsies (three to six per colon) using biopsy forceps were made in the distal colon and followed at 1 and 6 d postwounding by repeat endoscopy and image capture.
Colonoid Microinjection.
Epithelial colonoids were generated and plated in Matrigel on glass-bottom Petri dishes. At 4–5 d after plating, colonoids were microinjected with a pulled glass pipette containing injection solutions (C. rodentium 1 × 10⁷ cfu, LB, E. coli DH5α) attached to a Nanoject (World Precision Instruments). Colonoids (25–40 per condition) were injected with 2 nL of solution. Some colonoids were injected with FluoSpheres (Thermo Fisher Scientific) to mark injections (Fig. S4B). Injected colonoids were incubated at 37 °C for 6 h.
Statistics.
Quantitative data are expressed as mean ± SEM for each treatment group. Statistical comparisons were performed using the two-tailed Student’s t test or ANOVA with Tukey’s multiple-comparison post hoc test. P values < 0.05 were considered significant (*P < 0.05; **P < 0.01; ***P < 0.001).
SI Materials and Methods
Antibodies and Reagents.
Rabbit anti-AQP3 (Alomone Labs), goat anti-NOX1 (Sigma-Aldrich), rabbit anti-paxillin and mouse anti–p-paxillin (Tyr118), mouse anti-focal adhesion kinase (Santa Cruz Biotechnology), rhodamine phalloidin (Sigma-Aldrich), and DRAQ5 (Thermo Fisher Scientific) were used. H2O2, AgNO3, catalase, and DPI were obtained from Sigma-Aldrich. The AQP3 inhibitor Auphen was synthesized as described previously (22, 40).
Cells and Transfections.
Caco-2 cells were grown in a 5% CO2 humidified incubator with DMEM (Corning) supplemented with 15% heat-inactivated FBS, antibiotics (70 U/mL penicillin G and 70 μg/mL streptomycin), 4.5 g/L gucose, glutamine, and sodium pyruvate at pH 7.4. Cells were passaged (1:20) after reaching 80% confluence. Lentiviruses were produced by transfecting HEK293T cells with pLKO.1 shRNA vectors (five different shRNA sequences and a control scrambled shRNA construct) together with pCMV-ΔR8.9 and pVSV-G packaging plasmids. Culture supernatants containing virus particles were collected at 48 h after transfection and used to infect Caco-2 cells in the presence of 8 μg/mL polybrene. Cells were selected by puromycin (5 µg/mL), and isolated clones were verified by AQP3 immunoblot. Two clones showed successful stable depletion of AQP3, and one clone (773) was used for all experiments. Vector pHyPer-cyto (FP941) was purchased from Evrogen. HyPer was cloned into a pLVX lentivirus backbone and lentivirus produced by transfecting HEK293T cells together with pTAT, pVSV-G, and pHelper packaging plasmids. Fischer rat thyroid (FRT) cells and FRT cells stably expressing AQP3 were obtained from the A.S.V. laboratory.
H2O2 Fluorescence Ratio Imaging.
Stably transfected cells containing the H2O2-sensitive probe HyPer (39) on glass coverslips were placed in a microperfusion chamber (Warner Instruments) with HBSS with glucose at 37 °C and imaged using a Nikon TE2000 inverted microscope with a Lamda-DG4 Ultra-High-Speed Wavelength Switcher (Sutter Instruments) containing YFP (497 nm) and CFP (434 nm) excitation filters and a YFP emission filter (535 nm) and captured using an ORCA-Flash4.0 digital camera (Hamamatsu USA). Solutions containing H2O2 were perfused into the chamber. In some experiments, cells were preincubated (for 15 min) and perfused with solutions containing AgNO3. For CM-H2-DCFDA fluorescence, which is sensitive to OH−⋅ and O2⋅ as well as to H2O2, cells or crypts were imaged using the same microscope setup with FITC (475/530 nm) excitation and emission filters.
Isolation of Colonic ECs.
Colonic ECs were isolated by Dipase digestion. The harvested colons were cut open longitudinally and washed with PBS. For isolation of intestinal ECs, pieces of colon were washed three times in ice-cold PBS and then incubated with 1 mM DTT in HBSS for 10 min to remove mucus in the lumen. After three washes with ice-cold PBS, pieces were incubated in 1 U/mL Dispase (Roche) in RPMI medium for 30 min at 37 °C. The isolated ECs were collected by filtration through a 100-μm cell strainer (BD Biosciences) and centrifugation for 5 min at 200 × g at 4 °C. ECs were snap-frozen with liquid nitrogen and stored at −80 °C until further analysis.
qPCR and Primers.
Total RNA of cells was extracted with the RNeasy Mini Kit (QIAGEN). CDNA was prepared from total RNA with the SuperScript First-Strand Synthesis System (Invitrogen) with the oligo (dT)12–18 primers, according to the manufacturer’s instructions. RNA samples were treated with DNase I (Invitrogen) for the elimination of genomic DNA. Cytokine mRNA expression was determined by real-time qPCR with relative quantitation by the comparative threshold cycle number (Ct) method, using an iCycler and SYBR Green Ready-Mix (Bio-Rad) and normalized by a housekeeping gene (β-actin or GAPDH).
Preliminary experiments were performed with each primer pair to determine the amplification temperature that provided an optimal correlation between template concentration and signal intensity. At least three independent experiments were performed for each assay. Primer pairs are listed in Table S1.
Ratio and Fluorescence Image Acquisition and Analysis.
Time-lapse HyPer ratio fluorescence images were acquired using Slidebook microscope software. CFP excited:YFP excited (434/497) ratios were calculated using the built-in ratio module in Slidebook. CM-H2-DCFDA images were analyzed using ImageJ to calculate average background-corrected intensity. At least five coverslips were used for each condition in each experiment, and three to five experiments were conducted. Images were captured from each coverslip, and the entire image containing cells (pulse addition of H2O2 experiments) or regions of interest (wound edge experiments, three to five per image) was used.
Immunocytochemistry.
Cells were fixed in 4% paraformaldehyde, washed, blocked using 2% goat serum, and incubated with indicated antibodies at 1:100. Secondary antibodies Alexa Fluor 488, 568, and 647 (Thermo Fisher Scientific) were incubated (1:200). Some cells were incubated with secondary antibodies alone or with AQP3 as a peptide control. Tissues were fixed in 10% formalin and embedded in paraffin. Sections (7 µm) were antigen-retrieved in a steamer with citrate buffer and then incubated with primary and secondary antibodies as above.
In Vitro Scratch Wound Assay.
Monolayers of cells were grown and incubated in serum-free medium for 24 h, after which mitomycin C (0.02 mg/mL) was added. Cells were scraped in an ∼400-μm-wide strip of the cells using a standard 10-μL pipette tip. The wounded monolayers were washed twice to remove nonadherent cells. Wound healing was quantified as the average linear speed of the wound edges over 18 h. Cell proliferation was minimized by culture in serum-free medium with mitomycin-C.
Wound EC Immunoblotting.
Protein changes after wounding were assessed by immunoblotting of total and phosphorylated paxillin. In brief, monolayers of AQP3-SC and AQP3-KD cells were wounded by scratching, as described above, in a grid pattern. Cell lysates were isolated, and proteins were resolved by SDS/PAGE for Western blot analysis using standard protocols. Gels were imaged using the Azure c300 Western Blot Imaging System (Azure Biosystems). Densitometry analysis of captured images was done using ImageJ and expressed as the ratio of phospho-paxillin to total paxillin.
In Vivo Colonoscopy.
AQP3+/+ and AQP3−/− mice (n = 3–5) were anesthetized by i.p. injection of a ketamine (100 mg/kg)/xylazine (10 mg/kg) solution. The distal colon was imaged using a high-resolution colonoscopy system (Karl Storz) consisting of a miniature rigid endoscope (1.9-mm o.d.), a xenon light source, a triple-chip high-resolution CCD camera, and a 3 Fr operating sheath. Superficial wounds (three to six per colon) were created in the distal colon using biopsy forceps. Wound healing was assessed at 1 and 6 d after wounding by repeat endoscopy, and image capture and wound areas were calculated using ImageJ software.
Colonoid Generation and Crypt Isolation.
In brief, colons from AQP3+/+ and AQP3−/− mice were removed and washed with PBS and incubated in dissociation buffer [PBS with 10 mM EDTA, 2% (wt/vol) sorbitol, and 1% sucrose]. After vigorous shaking, crypt fragments were filtered (70 µm) and plated in Matrigel with a 50:50 mixture of DMEM/F12 with Hepes (Sigma-Aldrich; D6421) supplemented with 20% FBS (Sigma-Aldrich), 2 mM l-glutamine, 100 U/mL penicillin, and 0.1 mg/mL streptomycin (Sigma-Aldrich) with l-WRN conditioned media (WNT, R-spondin, Noggin) supplemented with 10 µM Y-27632 (ROCK inhibitor). Colonic crypts were isolated from AQP3+/+ and AQP3−/− mice. Colons were removed and washed with PBS and incubated in crypt dissociation buffer (PBS, 5.5 mM d-glucose, 10 mM EDTA, 1 mM DTT, and BSA 0.1%). Intact colonic crypts were shaken out of the tissue and collected. Crypts were placed on the surface of a Matrigel-coated coverslip for immobilization and placed in a perfusion chamber for experiments.
Colonoid Epithelial H2O2 Measurements.
After microinjection with bacterial solutions (C. rodentium, Luria broth, E. coli DH5α) incubation media was removed and replaced with HBSS with Hepes and glucose (10 mM). Colonoids were then incubated for 15 min with 10 μM CM-H2-DCFDA in HBSS, washed once with HBSS, and imaged on a Zeiss Axiophot microscope using epi-fluorescence illumination at 488 nm and detection on an ORCA-ER digital camera (Hamamatsu USA). Colonoid fluorescence was captured from six to eight colonoids per condition and colonoids from three separate isolations. Fluorescence intensity was quantified using ImageJ software and expressed as background-subtracted mean intensity.
C. rodentium Infection.
Age-matched littermate AQP3+/+ and AQP3−/− mice were infected with C. rodentium. In brief, C. rodentium (DBS100) was grown overnight in LB. Mice were orally gavaged with 100 µL of either inoculated (∼1 × 10⁹ cfu) or control LB. Body weight was measured daily, and mice were killed at indicated time points (3, 5, 12, and 25 d postinfection) The colon was removed, and samples were collected for histology and EC isolation. Stool and cecal tissue were also collected at day 5, 12 (stool) and day 25 (stool and cecal) respectively. For some experiments, NAC (Sigma-Aldrich) was given with drinking water (10 g/L) soon after the inoculation of the bacteria during the course of the experiment, as described previously (26). Stool and cecal tissue bacterial counts were assayed. Samples were weighed and homogenized, and serial dilutions were plated on LB agar with streptomycin overnight at 37 °C, and colonies were counted. Background bacterial counts were ∼1 × 10³ cfu.
Tissue ROS Measurements.
For assessment of tissue ROS, distal colons from mice at 3 d after C. rodentium infection were isolated and immediately placed in an imaging perfusion chamber in Krebs-Hepes-Ringer buffer at 37 °C and incubated in the ROS sensitive dye hydrocyanine-3 (ROS 550; Licor) for 15 min. The tissue was washed gently, and confocal images of the surface epithelial mucosa were acquired at 20× magnification. At least 10 areas per colon and four mice per condition were imaged. Background-subtracted fluorescence intensity measurements from regions of interest comprising the entire captured images (luminal surface, adjacent to crypt openings) were obtained using ImageJ software. Average fluorescence intensities were calculated from measurements from multiple images from each experimental condition.
Histology.
Formalin-fixed, paraffin-embedded tissues were sectioned and stained with H&E. For crypt length measurements, two to three stained sections per mouse were analyzed. Crypt lengths were measured using ImageJ software.
Water Permeability Measurements.
Water permeability was measured by calcein fluorescence quenching. Cells that were grown on glass coverslips were incubated with 20 μM calcein acetoxymethyl ester (Thermo Fisher Scientific) for 30 min at room temperature and then mounted in a perfusion chamber designed for rapid solution exchange (<100 ms). The time course of cytoplasmic calcein fluorescence, which changes reciprocally with cell volume, was monitored in response to exchanging perfusate between PBS (300 mOsm) and hypertonic PBS (600 mOsm) that contained 300 mM mannitol.
Calcein fluorescence was monitored in response to changing perfusate osmolalities from 300 (PBS) to 450 mosM (PBS containing 150 mM mannitol).
Statistics.
Quantitative data are expressed as mean ± SEM for each treatment group. Statistical comparisons were performed using either the two-tailed Student’s t test or ANOVA with Tukey’s multiple-comparison post hoc test. P values < 0.05 were considered significant (*P < 0.05; **P < 0.01; ***P < 0.001).
Acknowledgments
We thank Dr. Dan Chinnapen for synthesis of the aquaporin inhibitor Auphen. This work was supported by National Institutes of Health Grants R01 DK048106 (to W.I.L.), R01 DK035124 (to A.S.V.), P30 DK034854 (to the Harvard Digestive Diseases Center), and Pediatric Scientist Development Program K12-HD000850 (to J.R.T.).
Footnotes
The authors declare no conflict of interest.
This article is a PNAS Direct Submission.
This article contains supporting information online at www.pnas.org/lookup/suppl/doi:10.1073/pnas.1612921114/-/DCSupplemental.
References
- 1.Peterson LW, Artis D. Intestinal epithelial cells: Regulators of barrier function and immune homeostasis. Nat Rev Immunol. 2014;14(3):141–153. doi: 10.1038/nri3608. [DOI] [PubMed] [Google Scholar]
- 2.Niethammer P, Grabher C, Look AT, Mitchison TJ. A tissue-scale gradient of hydrogen peroxide mediates rapid wound detection in zebrafish. Nature. 2009;459(7249):996–999. doi: 10.1038/nature08119. [DOI] [PMC free article] [PubMed] [Google Scholar]
- 3.van der Vliet A, Janssen-Heininger YMW. Hydrogen peroxide as a damage signal in tissue injury and inflammation: Murderer, mediator, or messenger? J Cell Biochem. 2014;115(3):427–435. doi: 10.1002/jcb.24683. [DOI] [PMC free article] [PubMed] [Google Scholar]
- 4.Yoo SK, Freisinger CM, LeBert DC, Huttenlocher A. Early redox, Src family kinase, and calcium signaling integrate wound responses and tissue regeneration in zebrafish. J Cell Biol. 2012;199(2):225–234. doi: 10.1083/jcb.201203154. [DOI] [PMC free article] [PubMed] [Google Scholar]
- 5.Rada B, Leto TL. Oxidative innate immune defenses by Nox/Duox family NADPH oxidases. Contrib Microbiol. 2008;15:164–187. doi: 10.1159/000136357. [DOI] [PMC free article] [PubMed] [Google Scholar]
- 6.Szanto I, et al. Expression of NOX1, a superoxide-generating NADPH oxidase, in colon cancer and inflammatory bowel disease. J Pathol. 2005;207(2):164–176. doi: 10.1002/path.1824. [DOI] [PubMed] [Google Scholar]
- 7.Corcionivoschi N, et al. Mucosal reactive oxygen species decrease virulence by disrupting Campylobacter jejuni phosphotyrosine signaling. Cell Host Microbe. 2012;12(1):47–59. doi: 10.1016/j.chom.2012.05.018. [DOI] [PMC free article] [PubMed] [Google Scholar]
- 8.Jones RM, et al. Symbiotic lactobacilli stimulate gut epithelial proliferation via Nox-mediated generation of reactive oxygen species. EMBO J. 2013;32(23):3017–3028. doi: 10.1038/emboj.2013.224. [DOI] [PMC free article] [PubMed] [Google Scholar]
- 9.Hayes P, et al. Defects in NADPH oxidase genes NOX1 and DUOX2 in very early onset inflammatory bowel disease. Cell Mol Gastroenterol Hepatol. 2015;1(5):489–502. doi: 10.1016/j.jcmgh.2015.06.005. [DOI] [PMC free article] [PubMed] [Google Scholar]
- 10.Haberman Y, et al. Pediatric Crohn disease patients exhibit specific ileal transcriptome and microbiome signature. J Clin Invest. 2014;124(8):3617–3633. doi: 10.1172/JCI75436. [DOI] [PMC free article] [PubMed] [Google Scholar]
- 11.Verkman AS. Aquaporins at a glance. J Cell Sci. 2011;124(Pt 13):2107–2112. doi: 10.1242/jcs.079467. [DOI] [PubMed] [Google Scholar]
- 12.Miller EW, Dickinson BC, Chang CJ. Aquaporin-3 mediates hydrogen peroxide uptake to regulate downstream intracellular signaling. Proc Natl Acad Sci USA. 2010;107(36):15681–15686. doi: 10.1073/pnas.1005776107. [DOI] [PMC free article] [PubMed] [Google Scholar]
- 13.Hara-Chikuma M, Watanabe S, Satooka H. Involvement of aquaporin-3 in epidermal growth factor receptor signaling via hydrogen peroxide transport in cancer cells. Biochem Biophys Res Commun. 2016;471(4):603–609. doi: 10.1016/j.bbrc.2016.02.010. [DOI] [PubMed] [Google Scholar]
- 14.Hara-Chikuma M, et al. Aquaporin-3–mediated hydrogen peroxide transport is required for NF-κB signaling in keratinocytes and development of psoriasis. Nat Commun. 2015;6:7454. doi: 10.1038/ncomms8454. [DOI] [PMC free article] [PubMed] [Google Scholar]
- 15.Hara-Chikuma M, et al. Chemokine-dependent T cell migration requires aquaporin-3–mediated hydrogen peroxide uptake. J Exp Med. 2012;209(10):1743–1752. doi: 10.1084/jem.20112398. [DOI] [PMC free article] [PubMed] [Google Scholar]
- 16.Satooka H, Hara-Chikuma M. Aquaporin-3 controls breast cancer cell migration by regulating hydrogen peroxide transport and its downstream cell signaling. Mol Cell Biol. 2016;36(7):1206–1218. doi: 10.1128/MCB.00971-15. [DOI] [PMC free article] [PubMed] [Google Scholar]
- 17.Ricanek P, et al. Reduced expression of aquaporins in human intestinal mucosa in early stage inflammatory bowel disease. Clin Exp Gastroenterol. 2015;8:49–67. doi: 10.2147/CEG.S70119. [DOI] [PMC free article] [PubMed] [Google Scholar]
- 18.Thiagarajah JR, Zhao D, Verkman AS. Impaired enterocyte proliferation in aquaporin-3 deficiency in mouse models of colitis. Gut. 2007;56(11):1529–1535. doi: 10.1136/gut.2006.104620. [DOI] [PMC free article] [PubMed] [Google Scholar]
- 19.Knock GA, Ward JPT. Redox regulation of protein kinases as a modulator of vascular function. Antioxid Redox Signal. 2011;15(6):1531–1547. doi: 10.1089/ars.2010.3614. [DOI] [PubMed] [Google Scholar]
- 20.Basuroy S, Dunagan M, Sheth P, Seth A, Rao RK. Hydrogen peroxide activates focal adhesion kinase and c-Src by a phosphatidylinositol 3 kinase-dependent mechanism and promotes cell migration in Caco-2 cell monolayers. Am J Physiol Gastrointest Liver Physiol. 2010;299(1):G186–G195. doi: 10.1152/ajpgi.00368.2009. [DOI] [PMC free article] [PubMed] [Google Scholar]
- 21.Niemietz CM, Tyerman SD. New potent inhibitors of aquaporins: Silver and gold compounds inhibit aquaporins of plant and human origin. FEBS Lett. 2002;531(3):443–447. doi: 10.1016/s0014-5793(02)03581-0. [DOI] [PubMed] [Google Scholar]
- 22.Martins AP, et al. Targeting aquaporin function: Potent inhibition of aquaglyceroporin-3 by a gold-based compound. PLoS One. 2012;7(5):e37435. doi: 10.1371/journal.pone.0037435. [DOI] [PMC free article] [PubMed] [Google Scholar]
- 23.Cordeiro JV, Jacinto A. The role of transcription-independent damage signals in the initiation of epithelial wound healing. Nat Rev Mol Cell Biol. 2013;14(4):249–262. doi: 10.1038/nrm3541. [DOI] [PubMed] [Google Scholar]
- 24.Leoni G, et al. Annexin A1, formyl peptide receptor, and NOX1 orchestrate epithelial repair. J Clin Invest. 2013;123(1):443–454. doi: 10.1172/JCI65831. [DOI] [PMC free article] [PubMed] [Google Scholar]
- 25.Collins JW, et al. Citrobacter rodentium: Infection, inflammation and the microbiota. Nat Rev Microbiol. 2014;12(9):612–623. doi: 10.1038/nrmicro3315. [DOI] [PubMed] [Google Scholar]
- 26.Atarashi K, et al. Th17 cell induction by adhesion of microbes to intestinal epithelial cells. Cell. 2015;163(2):367–380. doi: 10.1016/j.cell.2015.08.058. [DOI] [PMC free article] [PubMed] [Google Scholar]
- 27.Brown JB, et al. Epithelial phosphatidylinositol-3-kinase signaling is required for β-catenin activation and host defense against Citrobacter rodentium infection. Infect Immun. 2011;79(5):1863–1872. doi: 10.1128/IAI.01025-10. [DOI] [PMC free article] [PubMed] [Google Scholar]
- 28.Ha E-M, Oh C-T, Bae YS, Lee W-J. A direct role for dual oxidase in Drosophila gut immunity. Science. 2005;310(5749):847–850. doi: 10.1126/science.1117311. [DOI] [PubMed] [Google Scholar]
- 29.Flores MV, et al. Dual oxidase in the intestinal epithelium of zebrafish larvae has anti-bacterial properties. Biochem Biophys Res Commun. 2010;400(1):164–168. doi: 10.1016/j.bbrc.2010.08.037. [DOI] [PubMed] [Google Scholar]
- 30.Hoeven Rv, McCallum KC, Cruz MR, Garsin DA. Ce-Duox1/BLI-3 generated reactive oxygen species trigger protective SKN-1 activity via p38 MAPK signaling during infection in C. elegans. PLoS Pathog. 2011;7(12):e1002453. doi: 10.1371/journal.ppat.1002453. [DOI] [PMC free article] [PubMed] [Google Scholar]
- 31.Grasberger H, El-Zaatari M, Dang DT, Merchant JL. Dual oxidases control release of hydrogen peroxide by the gastric epithelium to prevent Helicobacter felis infection and inflammation in mice. Gastroenterology. 2013;145(5):1045–1054. doi: 10.1053/j.gastro.2013.07.011. [DOI] [PMC free article] [PubMed] [Google Scholar]
- 32.Geiszt M, Witta J, Baffi J, Lekstrom K, Leto TL. Dual oxidases represent novel hydrogen peroxide sources supporting mucosal surface host defense. FASEB J. 2003;17(11):1502–1504. doi: 10.1096/fj.02-1104fje. [DOI] [PubMed] [Google Scholar]
- 33.Jostins L, et al. International IBD Genetics Consortium (IIBDGC) Host-microbe interactions have shaped the genetic architecture of inflammatory bowel disease. Nature. 2012;491(7422):119–124. doi: 10.1038/nature11582. [DOI] [PMC free article] [PubMed] [Google Scholar]
- 34.Voltan S, et al. Lactobacillus crispatus M247-derived H2O2 acts as a signal-transducing molecule activating peroxisome proliferator activated receptor-gamma in the intestinal mucosa. Gastroenterology. 2008;135(4):1216–1227. doi: 10.1053/j.gastro.2008.07.007. [DOI] [PubMed] [Google Scholar]
- 35.Joo J-H, et al. Dual oxidase 2 is essential for the Toll-like receptor 5-mediated inflammatory response in airway mucosa. Antioxid Redox Signal. 2012;16(1):57–70. doi: 10.1089/ars.2011.3898. [DOI] [PubMed] [Google Scholar]
- 36.Kuwano Y, et al. Tumor necrosis factor alpha activates transcription of the NADPH oxidase organizer 1 (NOXO1) gene and up-regulates superoxide production in colon epithelial cells. Free Radic Biol Med. 2008;45(12):1642–1652. doi: 10.1016/j.freeradbiomed.2008.08.033. [DOI] [PubMed] [Google Scholar]
- 37.Kang BW, et al. Expression of aquaporin-1, aquaporin-3, and aquaporin-5 correlates with nodal metastasis in colon cancer. Oncology. 2015;88(6):369–376. doi: 10.1159/000369073. [DOI] [PubMed] [Google Scholar]
- 38.Crane JK, Naeher TM, Broome JE, Boedeker EC. Role of host xanthine oxidase in infection due to enteropathogenic and Shiga-toxigenic Escherichia coli. Infect Immun. 2013;81(4):1129–1139. doi: 10.1128/IAI.01124-12. [DOI] [PMC free article] [PubMed] [Google Scholar]
- 39.Belousov VV, et al. Genetically encoded fluorescent indicator for intracellular hydrogen peroxide. Nat Methods. 2006;3(4):281–286. doi: 10.1038/nmeth866. [DOI] [PubMed] [Google Scholar]
- 40.Block B, Bailar JC. The reaction of gold(III) with some bidentate coördinating groups. J Am Chem Soc. 1951;(73):4722–4725. [Google Scholar]


