Significance
Recoding viral genomes by numerous synonymous substitutions provided live attenuated vaccine candidates predicted to have a low risk of reversion. However, their stability under selective pressure was largely unknown. We evaluated the phenotypic reversion of representative genome-scale deoptimized human respiratory syncytial virus (RSV) vaccine candidates in the context of strong selective pressure. We found that a virus bearing a deoptimized L-polymerase ORF evolved to escape temperature sensitivity restriction by mutations in L and multiple other proteins. Additional analysis revealed that single mutations in the M2-1 ORF were able to substantially escape the restriction imposed by the deoptimized polymerase. Based on this information, we generated a stable deoptimized RSV vaccine candidate with improved attenuation and immunogenicity suitable for additional development.
Keywords: negative-strand RNA virus, respiratory syncytial virus, live attenuated vaccine, codon pair deoptimization, genetic stability
Abstract
Recoding viral genomes by numerous synonymous but suboptimal substitutions provides live attenuated vaccine candidates. These vaccine candidates should have a low risk of deattenuation because of the many changes involved. However, their genetic stability under selective pressure is largely unknown. We evaluated phenotypic reversion of deoptimized human respiratory syncytial virus (RSV) vaccine candidates in the context of strong selective pressure. Codon pair deoptimized (CPD) versions of RSV were attenuated and temperature-sensitive. During serial passage at progressively increasing temperature, a CPD RSV containing 2,692 synonymous mutations in 9 of 11 ORFs did not lose temperature sensitivity, remained genetically stable, and was restricted at temperatures of 34 °C/35 °C and above. However, a CPD RSV containing 1,378 synonymous mutations solely in the polymerase L ORF quickly lost substantial attenuation. Comprehensive sequence analysis of virus populations identified many different potentially deattenuating mutations in the L ORF as well as, surprisingly, many appearing in other ORFs. Phenotypic analysis revealed that either of two competing mutations in the virus transcription antitermination factor M2-1, outside of the CPD area, substantially reversed defective transcription of the CPD L gene and substantially restored virus fitness in vitro and in case of one of these two mutations, also in vivo. Paradoxically, the introduction into Min L of one mutation each in the M2-1, N, P, and L proteins resulted in a virus with increased attenuation in vivo but increased immunogenicity. Thus, in addition to providing insights on the adaptability of genome-scale deoptimized RNA viruses, stability studies can yield improved synthetic RNA virus vaccine candidates.
The availability and affordability of large-scale custom DNA synthesis opened the new field of synthetic biology (1). The combined approach of sequence design and synthetic biology allows the generation of DNA molecules with extensive targeted modifications. Synonymous genome recoding, in which one or more ORFs of a microbial pathogen are modified at the nucleotide level without affecting amino acid coding, currently is being widely evaluated to reduce pathogen fitness and create potential live attenuated vaccines, particularly for RNA viruses (reviewed in ref. 2) (3–7). The main strategies for attenuation by synonymous genome recoding are codon deoptimization (CD), codon pair deoptimization (CPD), and increasing the dinucleotide CpG and UpA content (which is usually the result of CD and CPD) (2).
The mechanisms of attenuation by these strategies are currently under intensive research. It has been suggested that the primary effect of CD and CPD is to reduce translation efficiency of pathogen mRNAs, thereby providing attenuation (8). Effects on mRNA stability also can be a factor (9). In addition, recent studies suggested that codon pair bias may be a direct consequence of dinucleotide bias (10), suggesting that the increase in the frequency of CpG and UpA dinucleotides that frequently occurs with CPD may cause attenuation by inducing stronger innate immune responses (11). Regardless of the mechanism of attenuation caused by CPD, the genetic stability of live attenuated virus vaccines is paramount to avoid deattenuation, and thus, it is important to evaluate the genetic and phenotypic stability of such vaccine candidates in detail.
Deoptimized viruses genomes contain dozens to thousands of silent nucleotide mutations in one or more ORFs. Presumably, attenuation is based on the sum of many individual mutations. This mutation multiplicity is expected to confer stability against substantial deattenuation, because the high number of mutations would present a significant barrier against reversion to virulence. In principle, on the background of thousands of attenuating mutations, any single-site reversion should yield only a minuscule selective advantage. The most likely path to reversion imaginable under this model is the progressive accumulation of many individual mutations, providing for a slow progression of deattenuation (12–14).
To date, genetic stability studies of large-scale deoptimized viruses have shown that deattenuation, indeed, seems to be low, suggesting that these viruses are genetically stable (6, 8, 15–21). However, an important limitation of these studies is that the deoptimized viruses generally have not been subjected to strong selective pressure that would favor the outgrowth of viruses with deattenuating mutations. This study addresses this gap by evaluating phenotypic reversion of representative synthetic human respiratory syncytial virus (RSV) vaccine candidates in strong selective pressure.
RSV, a negative-strand RNA virus of the Pneumoviridae family, is a major worldwide human respiratory pathogen, particularly of infants and young children. A vaccine or antiviral drugs suitable for routine use are not available and are a high priority. A live attenuated vaccine is a strategy of choice, because it obviates RSV disease enhancement that is associated with inactivated and subunit RSV vaccines. The RSV genome consists of a single-stranded negative sense 15.2-kb RNA and has 10 genes in the order 3′-NS1-NS2-N-P-M-SH-G-F-M2-L-5′, preceded by a short leader region and followed by a short trailer region. The M2 mRNA encodes two separate proteins, M2-1 and M2-2, from overlapping ORFs. The genes are each flanked by short gene-start and gene-end transcription signals and transcribed as individual mRNAs by sequential transcription initiating at a single promoter in the leader region.
We recently generated four CPD RSVs that contain increasing numbers of deoptimized ORFs and exhibit a range of increasing attenuation in vitro and in vivo (22), providing live attenuated RSV vaccine candidates. Surprisingly, these viruses were temperature-sensitive. This temperature sensitivity provided a means to apply selective pressure that we used to investigate the genetic stability of these CPD RSVs. The combination of extensive replication and incrementally increasing temperatures should favor outgrowth of viruses bearing deattenuating mutations allowing for identification of genetic changes. Because a temperature gradient occurs along the human respiratory tract (23) and because respiratory virus infections progress from the upper to the lower respiratory tract, temperature stress is a relevant model to evaluate the genetic stability of live attenuated respiratory virus vaccine candidates. In this study, we applied temperature stress on two CPD RSVs that exhibited different levels of CPD and analyzed the temporal dynamics of the synthetic virus populations.
Results
CPD of Multiple RSV Genes Yielded a Very Stable Ts Phenotype Restricted to Replication at 32 °C to 34 °C.
Min full-length clone (FLC) is a previously described mutant in which 9 of 11 RSV ORFs (except only M2-1 and M2-2) were CPD, resulting in a total of 2,692 silent mutations (Fig. 1A) (22). Min FLC is highly temperature-sensitive, with a shutoff temperature (TSH) of 35 °C for plaque formation, whereas WT recombinant RSV (rRSV) readily forms plaques at 40 °C. The TSH is defined as the lowest restrictive temperature at which there is a reduction in virus titer compared with the permissive temperature of 32 °C that is 100-fold or greater than that of WT RSV at this temperature.
Fig. 1.
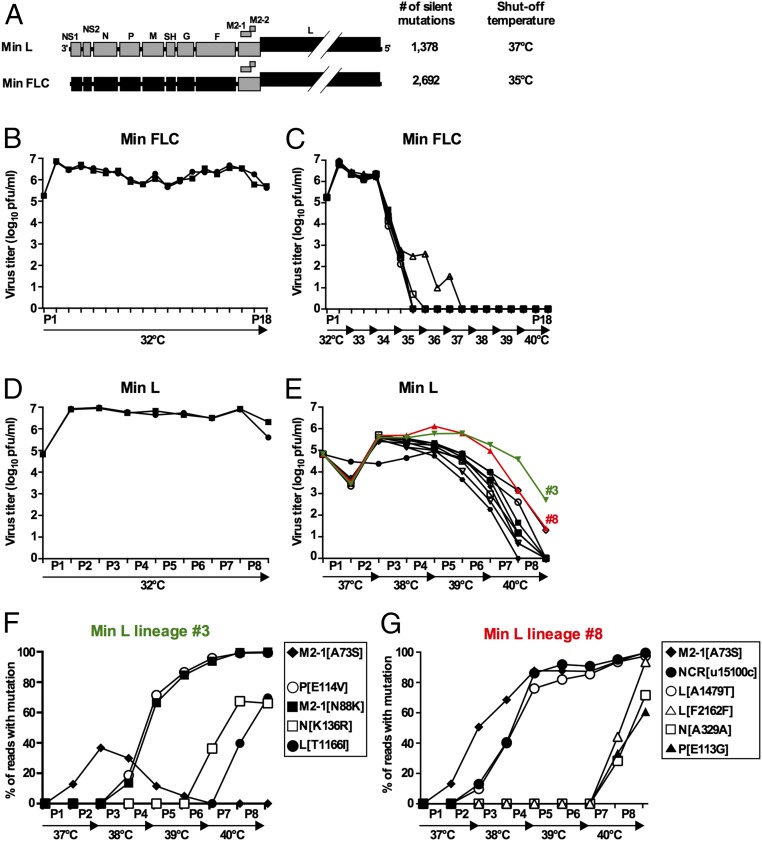
Min FLC was phenotypically stable during a temperature stress test, but Min L was not. (A) Gene maps of Min L and Min FLC showing ORFs that are WT (gray) or CPD (black). The number of introduced mutations in each virus and the TSH in Vero cells are indicated. (B–E) Incubation temperature and virus yield at each passage level during serial passage in temperature stress tests. (C) Replicate cultures of Vero cells in T25 flasks were infected with the indicated virus at MOI of 0.1; when the viral cytopathic effect was extensive or when cells started to detach (for passages of Min FLC at 37 °C and beyond), flasks were harvested, and clarified culture fluids were passaged 1:5 to a fresh flask. Each starting replicate flask initiated an independent serial passage (lineage). Aliquots of clarified culture fluids were frozen for titration and sequence analysis (22). (B and C) Temperature stress test of Min FLC. (B) Two control flasks inoculated with Min FLC were passaged 18 times at the permissive temperature of 32 °C. (C) Ten additional replicates were passaged from 32 °C to 40 °C with two passages at each temperature. (D and E) Temperature stress test of Min L. (D) Two control flasks inoculated with Min L were passaged eight times at the permissive temperature of 32 °C. (E) Ten additional replicates were passaged from 37 °C to 40 °C with two passages at each temperature. Lineages 3 and 8 are shown in green and red, respectively. (F and G) Accumulation of most abundant mutations (>30% of the reads in at least one passage) in lineages (F) 3 and (G) 8 during the passage series determined by deep sequencing (Tables S2 and S3 show detailed data).
To investigate Min FLC stability, we used a temperature stress test, representing a surrogate model for genetic stability during virus replication and spread from the cooler upper to the warmer lower respiratory tract. Ten replicate flasks of Vero cells were infected with Min FLC and subjected to serial passage at progressively increasing temperatures for a total of 18 passage stages, representing 7 mo of continuous culture. Two additional replicate flasks were infected and passaged in parallel at the permissive temperature of 32 °C as controls (Fig. 1 B and C).
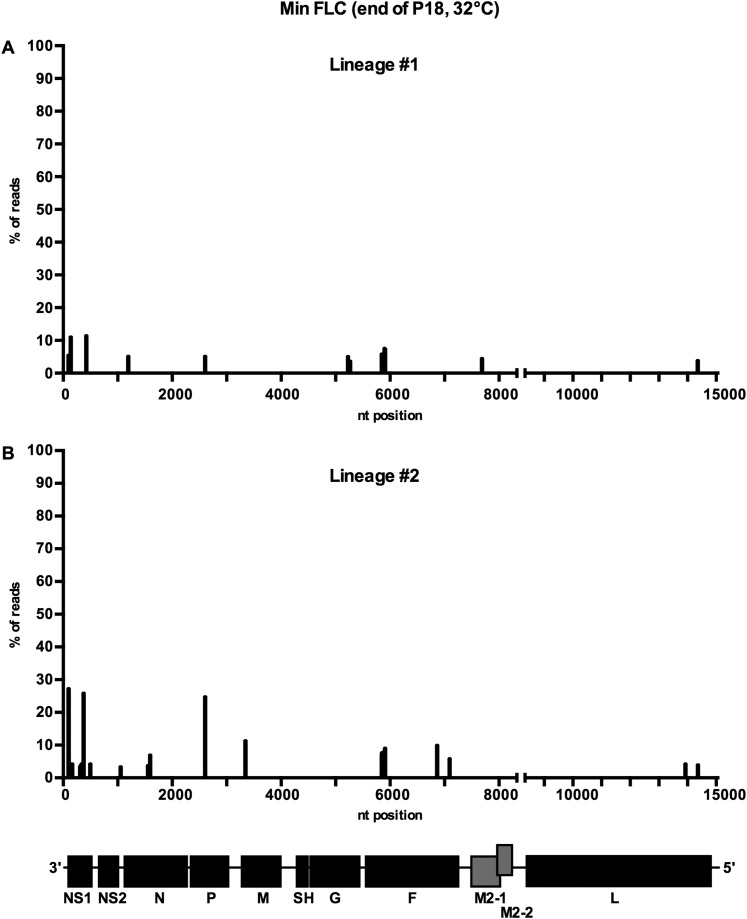
At 32 °C, Min FLC replicated consistently to titers of 106–107 pfu/mL (Fig. 1B). Deep sequencing of the complete genomes of the two control lineages after 18 passages revealed only low-level sporadic mutations (Fig. S1), showing that Min FLC was genetically stable under permissive conditions. In the flasks incubated at increasing temperature, Min FLC replicated efficiently at 32 °C and 33 °C (106–107 pfu/mL) (Fig. 1C). However, after the first passage at 34 °C [passage 5 (P5)], virus replication was reduced 200-fold in all 10 lineages, and at the end of the second passage at 35 °C (P8), virus was undetectable in 9 lineages. In the 10th lineage, no virus was detected at the end of the first passage at 37 °C (P11). In contrast, as noted, WT rRSV exhibits no growth restriction at temperatures up to at least 40 °C.
Fig. S1.
Minimal accumulation of adventitious mutations in Min FLC during 18 passages at 32 °C (related to Fig. 1). Min FLC was subjected to 18 passages at 32 °C (Fig. 1B). At the end of passage 18, viral RNA was extracted from lineages (A) 1 and (B) 2, and the complete genome was amplified by overlapping RT-PCR and analyzed by deep sequencing (Ion Torrent). Adventitious mutations (which are not specifically identified) are indicated by bars showing their genome position and relative abundance. WT genes are colored in gray shading, whereas CPD genes are colored in black shading.
Thus, Min FLC was highly restricted if not inactive at temperatures above 34 °C to 35 °C (the latter being its TSH). Consequently, Min FLC cannot escape its Ts phenotype and is phenotypically stable under stress conditions. Sequencing was not performed on Min FLC specimens passed under increasingly restrictive temperatures because of the rapid decrease in titers. These results fulfilled the expectation of phenotypic stability for a CPD virus.
Temperature Stress on the Min L Virus Promoted the Emergence of Multiple Mutations in Multiple Genes.
We also evaluated a virus in which CPD was less extensive. Specifically, the previously described virus called Min L (22), in which the L ORF alone (representing 48% of the aggregate RSV ORFs) was CPD, resulted in 1,378 silent mutations (21.2% of nucleotides of this ORF; 51% as many changes as in Min FLC). Min L has a TSH of 37 °C. Ten replicate flasks were infected with Min L and passaged serially at progressively increasing temperatures for a total of eight passages, corresponding to 2 mo of continuous culture, and two additional replicate flasks were infected and passaged in parallel at 32 °C as controls (Fig. 1 D and E).
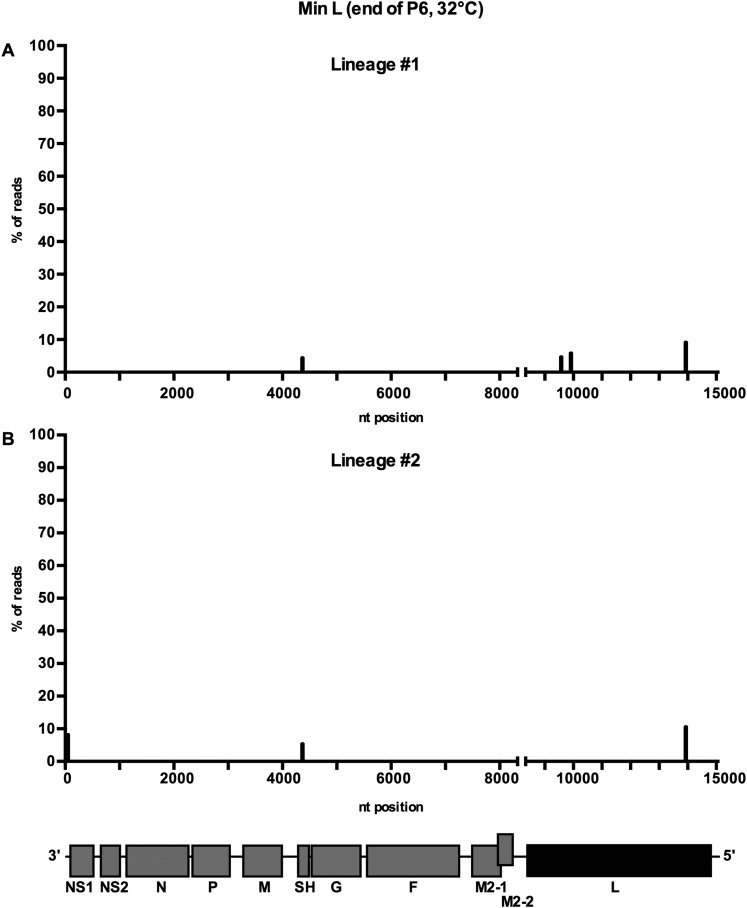
As expected, Min L replicated efficiently (107 pfu/mL) at each passage at 32 °C (Fig. 1D). Sequence analyses of RNA from the control lineages at P6 by deep sequencing (Fig. S2) and P8 by Sanger sequencing revealed only sporadic, low-level mutations. In 10 lineages passaged at increasing temperature, the titers of Min L in nine flasks were decreased by about 20-fold at the end of P1 (37 °C) (Fig. 1E). However, during the second passage at 37 °C, titers in the same nine lineages increased by about 200-fold, suggesting that selection and outgrowth of temperature-adapted mutants were already occurring. After P3 (38 °C), virus titers in all 10 lineages decreased steadily: at P8 (second passage at 40 °C), virus was undetectable in 7 lineages, whereas in 2 other lineages, titers were very low (20 pfu/mL each). The remaining lineage (lineage 3) (colored green in Fig. 1E) had a titer of 500 pfu/mL. Thus, the various Min L lineages seemed to undergo a partial loss of the temperature sensitivity phenotype but ultimately, were strongly restricted at 40 °C.
Fig. S2.
Minimal accumulation of adventitious mutations in Min L during six passages at 32 °C (related to Fig. 1). Min L was sequentially passed eight times at 32 °C on Vero cells (Fig. 1D). At the end of P6, viral RNA was extracted from lineages (A) 1 and (B) 2, and the complete genome was amplified by overlapping RT-PCR and analyzed by deep sequencing (Ion Torrent). Adventitious mutations are indicated by bars showing their genome position and relative abundance; the specific nucleotide changes are not indicated. WT genes are colored in gray shading, whereas CPD genes are colored in black shading.
For each of 10 lineages passaged at increasing temperature, whole-genome deep sequencing was performed at the end of P6 (the second passage at 39 °C), when virus replication was still detectable in each lineage. Mutations present in ≥45% of the sequencing reads are shown in Table 1. Remarkably, many of these prominent mutations were in genes not subjected to CPD. Specifically, of these 23 prominent mutations, 21 were distributed among six ORFs (P, M, SH, G, M2-1, and L), and 2 were in extragenic regions. Of 23 mutations, 11 (48%) and 5 (22%) occurred in the M2-1 and L ORFs, respectively. Of 21 mutations present in ORFs, all but one were missense mutations, suggesting a bias for amino acid change. Some mutations were common to several lineages. Specifically, the mutation [A73S] in the antitermination transcription factor M2-1 was prominent in 8 of 10 lineages. Another M2-1 mutation (N88K) and a mutation in L (A1479T) were prominent in two lineages. M2-1 was the only gene to have one or more prominent mutations in every lineage.
Table 1.
Mutations detected in individual lineages of Min L at the end of P6 (second passage at 39 °C) of the temperature stress test present at ≥45% frequency
| Gene | Nucleotide mutation | Amino acid mutation | Percentage of reads with mutation in indicated lineage no.* | |||||||||
| 1 | 2 | 3 | 4 | 5 | 6 | 7 | 8 | 9 | 10 | |||
| Intergenic NS2-N | g1123a | / | 85 | |||||||||
| P | a2687u | E114V | 96 | |||||||||
| M | u3798a | N179K | 61 | |||||||||
| SH | c4369a | H22Q | 81 | |||||||||
| SH | c4387g | I28M | 71 | |||||||||
| G | a5384g | E232 (silent) | 47 | |||||||||
| M2-1 | g7823u | A73S | 99 | 93 | 61 | 48 | 83 | 63 | 87 | 57 | ||
| M2-1 | c7870a | N88K | 94 | 96 | ||||||||
| M2-1 | a8013g | E136G | 48 | |||||||||
| L | u10548c† | Y684H† | 97 | |||||||||
| L | u10797c†‡ | S767P†‡ | 82 | |||||||||
| L | g12933a | A1479T | 63 | 85 | ||||||||
| L | a13783c† | Y1762S† | 83 | |||||||||
| 5′ Extragenic (trailer) | u15100c | / | 75 | |||||||||
“/” indicates that the amino acid mutation is not applicable for this particular mutation as the given mutation is localized in a nontranslated region.
Percentage of reads with the indicated mutation; only mutations present in ≥45% of the reads are shown. Nucleotide numbering is based on RSV sequence M74568 (biological WT RSV strain A2). Mutations present in ≥5% of reads from this same experiment are shown in Table S1.
Mutation involving a codon that had been changed as part of CPD of the L ORF.
Mutation involving a nucleotide position that had been changed as part of CPD of the L ORF.
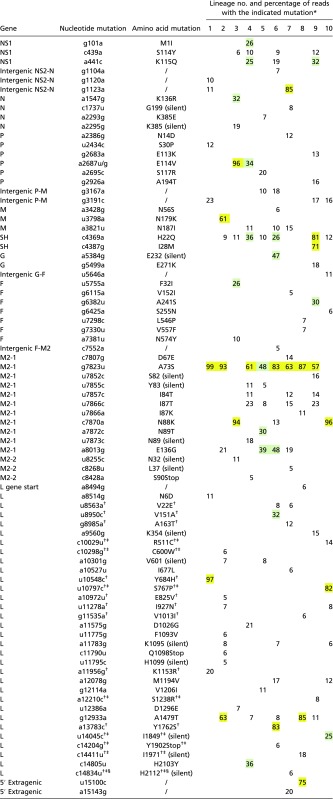
Table S1 shows mutations that were present in ≥5% of the reads from the P6 specimens from the same experiment. With this lower cutoff, many more mutations were evident in every gene except NS2. Similar to the prominent mutations that were shown in Table 1, these less prominent mutations were mostly missense mutations. In the CPD L ORF, in which 21.2% of codons had been modified by CPD, 17 of the total of 31 (55%) mutations involved a nucleotide or a codon that had been modified during CPD (Table S1), suggesting that mutations frequently occurred in a codon modified by CPD. However, as shown in Table S1, only a single mutation represented a reversion to the original codon.
Table S1.
Cont
 |
“/” indicates that the amino acid mutation is not applicable for this particular mutation as the given mutation is localized in a nontranslated region.
Percentage of reads with the indicated mutation; only mutations present in ≥5% of the reads are shown. Mutations detected in ≥50% of the reads are highlighted in yellow, and mutations detected in 25–49% of reads are highlighted in green. Nucleotide numbering is based on RSV sequence M74568.
Mutations involving a codon that had been changed as part of CPD of L.
Mutations involving a nucleotide that had been changed as part of CPD of L.
Mutation involving a nucleotide that had been changed as part of CPD of L and that restored WT sequence.
We also performed whole-genome deep sequencing analysis to evaluate the temporal appearance of mutations in the full-passage series of lineages 3 and 8, which were of interest, because they maintained the highest titers during the stress test (Fig. 1E) and thus, have the greatest deattenuation in vitro. The appearance and frequency of the more abundant mutations are shown graphically in Fig. 1 F, lineage 3 and G, lineage 8. A more detailed listing of the mutations is shown in Tables S2 and S3.
Table S2.
Accumulation of mutations in P1–P8 (from 37 °C to 40 °C) in lineage 3 during the temperature stress test
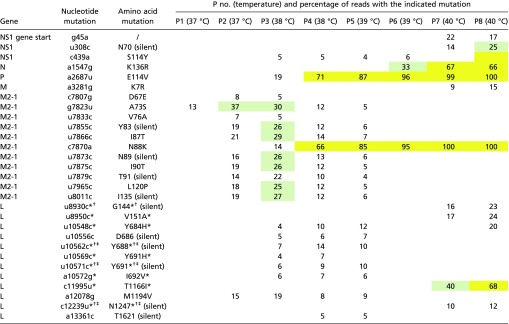 |
Percentage of reads with the indicated mutation; only mutations detected in at least two consecutive passages with ≥5% of the reads in one passage are shown. The temperatures of the specific passages are shown in parentheses. Mutations detected in ≥50% of the reads at a given passage are highlighted in yellow, and mutations detected in 25–49% of the reads are highlighted in green. Nucleotide numbering is based on RSV sequence M74568. “/” indicates that the amino acid mutation is not applicable for this particular mutation as the given mutation is localized in a nontranslated region.
Mutations involving a codon that had been changed as part of CPD of L.
Mutations involving a nucleotide that had been changed as part of CPD of L.
Mutations involving a nucleotide that had been changed as part of CPD of L and that restored WT sequence.
Table S3.
Accumulation of mutations in P1–P8 (from 37 °C to 40 °C) in lineage 8 during the temperature stress test
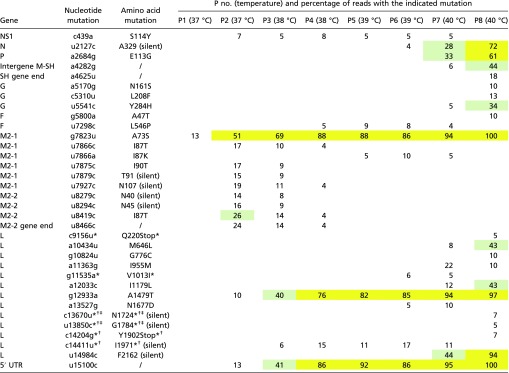 |
Percentage of reads with the indicated mutation; only mutations detected in at least two consecutive passages with ≥5% of the reads in one passage are shown. The temperatures of the specific passages are shown in parentheses. Mutations detected in ≥50% of the reads at a given passage are highlighted in yellow, and mutations detected in 25–49% of the reads are highlighted in green. Nucleotide numbering is based on RSV sequence M74568. “/” indicates that the amino acid mutation is not applicable for this particular mutation as the given mutation is localized in a nontranslated region.
Mutations involving a codon that had been changed as part of CPD of L.
Mutations involving a nucleotide that had been changed as part of CPD of L.
Mutations involving a nucleotide that had been changed as part of CPD of L and that restored WT sequence.
In both lineages, a single mutation ([A73S] in M2-1) appeared at P1 (13% of each lineage) and then, increased at P2 (37 and 51% in lineages 3 and 8, respectively). From P2, the two lineages went into different evolutionary trajectories. In lineage 3, between P2 and P3, whereas the frequency of the M2-1 mutation [A73S] started to decline (30%), 10 other mutations in M2-1 appeared and constituted ∼15–30% of the population (Table S2). One of these M2-1 mutations, namely [N88K], became abundant (66%) in P4, closely concurrent with an equally abundant (71%) mutation [E114V] in P4 (Fig. 1F). The other M2-1 mutations declined and were undetectable beyond P5, suggestive of a selective sweep (24). Two additional prominent mutations were acquired at P6 (N[K136R]) and P7 (L[T1166I]). In lineage 8, mutation [A73S] in M2-1 was fixed at P4 (88%). At P2, two additional mutations (in the 5′ trailer region and L) were acquired, and they became prominent and fixed by the end of P4. After the first passage at 40 °C (P7), some additional mutations were acquired, three of which became prominent by the end of P8: one silent in L, one silent in N, and one in P[E113G].
Two Mutations in the Antitermination Transcription Factor M2-1 Are Prominent but Incompatible.
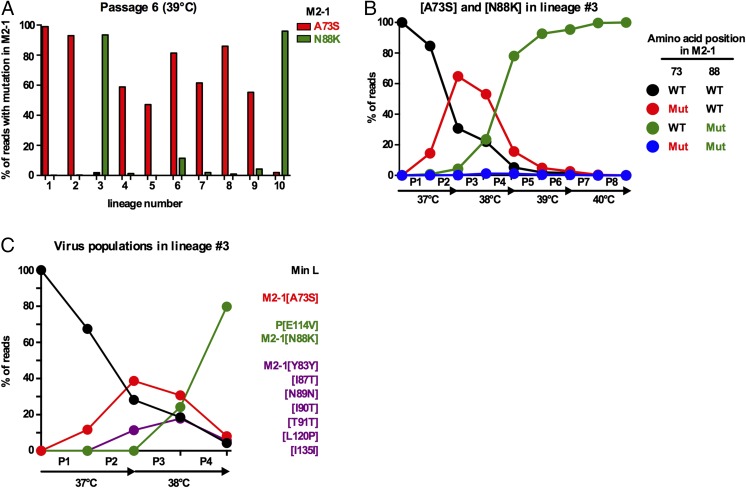
All 10 lineages at P6 had either M2-1 mutation [A73S] or [N88K] (Fig. 2A and Table 1). Thus, these two M2-1 mutations seemed to segregate. In addition, the disappearance of the [A73S] mutation during passage series of lineage 3 coincided with the appearance and increase of [N88K] until the latter was present in the complete population (Fig. 1F). We reevaluated the deep sequencing results of lineage 3, scoring only those reads that spanned both positions 73 and 88 in M2-1, thus providing a linkage analysis. At P3 and P4, only 1% of the reads had both mutations (Fig. 2B), suggesting that these two mutations in M2-1 are incompatible in the same genome and thus, constitute two separate virus populations.
Fig. 2.
M2-1 mutations [A73S] and [N88K] segregated into different viral subpopulations. (A) Percentage of deep sequencing reads that contained M2-1 mutation [A73S] (red bars) or [N88K] (green bars) at P6 (the second passage at 39 °C) of each of 10 lineages from the experiment in Fig. 1E. (B) Lack of linkage between M2-1 mutations [A73S] and [N88K] illustrated by the percentage of deep sequencing reads that contained the indicated combinations of assignments at codons 73 (WT vs. [A73S]) and 88 (WT vs. [N88K]) in the same read based on reads from the experiment in Fig. 1F that spanned both codons. (C) Extent of linkage between M2-1 mutations [A73S] and [N88K] and other mutations during the first four passages of lineage 3 (Fig. 1 E and F) determined by PacBio sequencing of continuous reads corresponding to an 8.2-kb region of the RSV genome from the 3′ end to the middle of the M2-2 ORF. Four major virus subpopulations were identified, and mutations that are linked on the same genomes are indicated by an identical color.
To further characterize the dynamics of the main virus populations in lineage 3, we investigated linkage of the major mutations that appeared during the first four passages using Pacific Biosciences Inc. (PacBio) long-read, single-molecule sequencing, which provided complete reads of an entire 8.2-kb region from the 3′ genome end to the middle of the M2-2 ORF. This analysis showed that the first four passages contained four major virus subpopulations (Fig. 2C). One was the original Min L virus, which progressively decreased with passage. Another subpopulation that carried the M2-1 mutation [A73S] alone peaked at P2 and almost disappeared in P4. Another carried seven mutations in M2-1 (three synonymous and four nonsynonymous) that appeared together at P2, reached a maximum at P3 (about 20%), and then, disappeared. Finally, the fourth subpopulation contained the P[E114V] and M2-1[N88K] mutations that appeared together at P3 and became prominent at P4.
The Two Incompatible Mutations in the M2-1 Protein Confer Most of the Reduced Temperature Sensitivity and Increased Replication of the Min L Derivatives in Vitro.
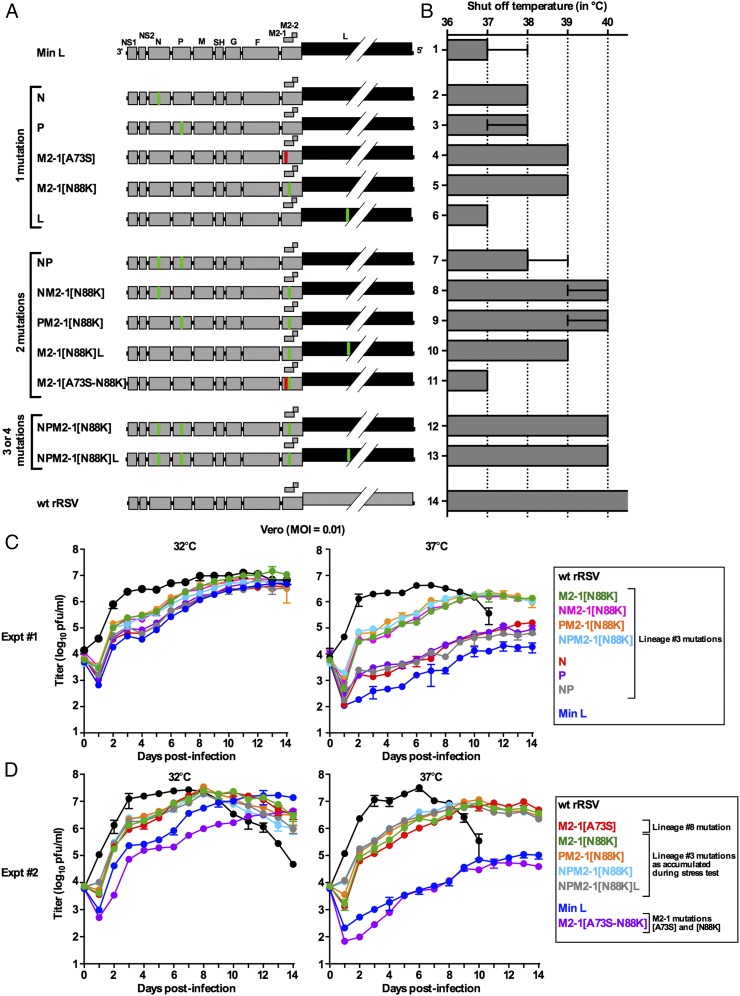
We next sought direct identification of mutation(s) responsible for the loss of temperature sensitivity of Min L. This investigation was performed by introducing into Min L, individually and in combinations, major mutations that had been identified in lineage 3, namely N[K136R], P[E114V], M2-1[N88K], and L[T1166I] (Fig. 1F), as well as the M2-1 mutation [A73S] that was one of the prominent mutations in replicate 8 (Fig. 1G). The resulting 12 viruses (Fig. 3A) were recovered and sequenced completely, confirming the correct sequences and absence of additional mutations.
Fig. 3.
Effects of specific mutations on the temperature sensitivity and in vitro replication of Min L derivatives. Five major mutations identified in lineage 3 (N[K136R], P[E114V], L[T1166I], M2-1[N88K], and M2-1[A73A]) (Fig. 1F) were introduced individually and in combinations by site-directed mutagenesis and reverse genetics into Min L for phenotypic analysis. The Min L-derived viruses were named based on the gene names bearing the introduced mutations, with the M2-1 mutation specified in brackets. (A) Mutations are indicated in the viral genome map by green bars, except that M2-1[A73S] is indicated in red. (B) TSH determined by the efficiency of plaque formation at 32 °C, 35 °C, 36 °C, 37 °C, 38 °C, 39 °C, and 40 °C using published methods (22). The experiment was done four times for viruses 1, 5, 12, and 14; three times for viruses 2, 3, and 7–9; two times for viruses 4 and 11, and once for viruses 6, 10, and 13 (bar graphs: medians and ranges). (C and D) Replication of Min L-derived mutants in vitro. Vero cells were infected at 32 °C and 37 °C (MOI of 0.01). Titers correspond to the mean of two replicate titrations of two replicates for each time point. The SD is indicated. Because of the large number of viruses, the analysis was divided between experiments (C) 1 and (D) 2.
The introduction of the N[K136R] or P[E114V] mutation alone conferred approximately a 1 °C increase in TSH (Fig. 3B) compared with Min L, whereas L[T1166I] alone did not have an effect. Interestingly, the introduction of M2-1[A73S] or [N88K] alone induced a 2 °C increase in TSH, suggesting that either of these two M2-1 mutations alone played the greatest role in the in vitro deattenuation of Min L. The combination of the N or P mutation with M2-1[N88K] conferred another small increase in TSH (to an average of 2.5 °C from three independent experiments). The combination of the N, P, and M2-1[N88K] mutations induced a 3 °C increase in TSH (40 °C) compared with Min L, which was not further increased by the addition of the L mutation. These data illustrated the additive role of the N, P, and M2-1[N88K] mutations in the increase in the TSH of lineage 3. The combination of M2-1[A73S] and [N88K] did not confer any increase in the TSH of Min L, illustrating their incompatibility, as predicted based on the deep sequencing results.
We also studied the effects of these mutations on the kinetics and efficiency of Min L replication in Vero cells (Fig. 3 C and D). The effects of the mutations were more evident at 37 °C (Fig. 3 C, Right and D, Right) than at 32 °C (Fig. 3 C, Left and D, Left), which would be expected for temperature sensitivity mutations. The N and P mutations alone and in combination had only a small effect on increasing viral replication compared with Min L. In contrast, the introduction of either the M2-1[N88K] or the [A73S] mutation alone resulted in a substantial increase in replication, and this increase in replication was not much affected by the further addition of the N, P, and L mutations. In addition, virus bearing both of the incompatible M2-1[A73S] and [N88K] mutations replicated similar to or less efficiently than Min L at 37 °C and 32 °C, respectively (Fig. 3D). Thus, the M2-1[N88K] or [A73S] mutation played the major role in restoring the ability of Min L to replicate in Vero cells, but they were incompatible.
Either of the Two Incompatible Mutations in the M2-1 Protein Partly Restores RNA Synthesis and Gene Expression in Vitro.
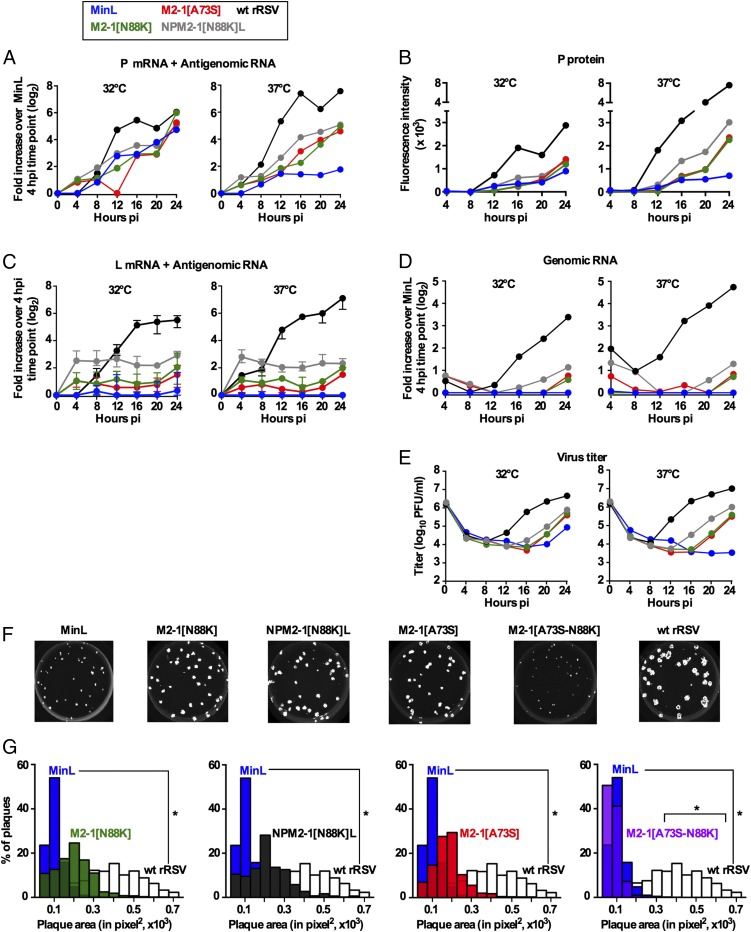
We evaluated the effects of the introduced mutations on the kinetics of viral gene transcription, viral genomic RNA synthesis, protein expression, and virus particle production in a single infection cycle (Fig. 4 A–E). Vero cells were infected at a multiplicity of infection (MOI) of 3 pfu per cell with the indicated viruses, and samples were collected for analysis every 4 h for 24 h.
Fig. 4.
Effects of specific mutations on RNA synthesis and plaque size of Min L derivatives. (A–E) Replicate cultures of Vero cells were infected (MOI of 3) with the indicated viruses. Cultures were harvested every 4 h from 4 to 24 h pi for analysis of cell-associated RNA, protein, and virus. (A) Positive sense viral RNA (i.e., mRNA and antigenome) was quantified in triplicate by strand-specific qRT-PCR (22). Data for P are shown. The corresponding data for NS1, NS2, N, M, SH, G, F, and M2 are shown in Fig. S3. qPCR results were analyzed using the ∆Ct method, normalized to 18S rRNA, and expressed as log2 fold increase over the Min L 4 h time point. (B) Quantification of P protein expression by Western blotting. Data for NS1, NS2, N, G, F, and M2-1 are shown in Fig. S4. (C) Quantification of L mRNA and antigenome by strand-specific qRT-PCR (fold increase relative to the 4-h pi time point calculated separately for each virus, because different primer probes sets were required for WT L gene in WT rRSV vs. the CPD L gene present in Min L and its derivatives). For WT L and CPD L, data were derived from three and four different primer probe sets, respectively, designed along the L ORFs, and the median values with ranges are shown. (D) Quantification of cell-associated genomic RNA by strand-specific qRT-PCR (22) expressed as fold increase over the 4-h pi time point of Min L. (E) Virus titers from cultures incubated at 32 °C and 37 °C and assayed at 32 °C. (F and G) Virus plaque sizes. Vero cells were infected with 30 pfu per 2-cm2 well of WT rRSV, Min L, and Min L-derived mutants and incubated under methylcellulose at 32 °C for 12 d. Plaques were visualized by immunostaining and quantified by IR imaging (Li-Cor) using ImageJ. (F) Representative pictures of virus plaque sizes. (G) Plaques size distribution of the indicated viruses. A minimum of 1,000 plaques per virus was measured. *P ≤ 0.05.
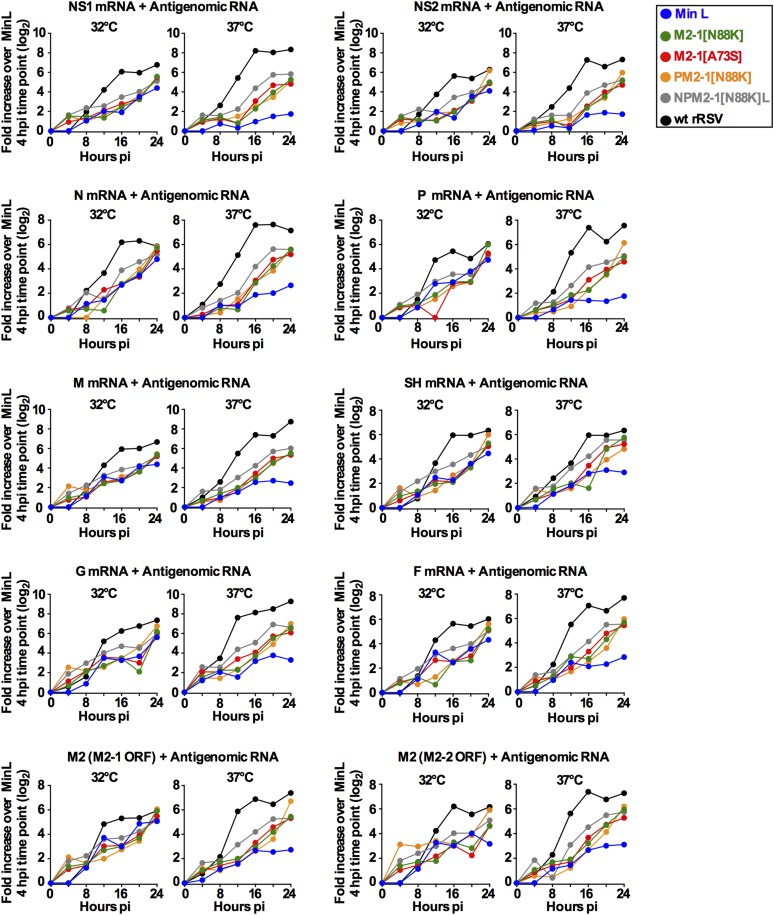
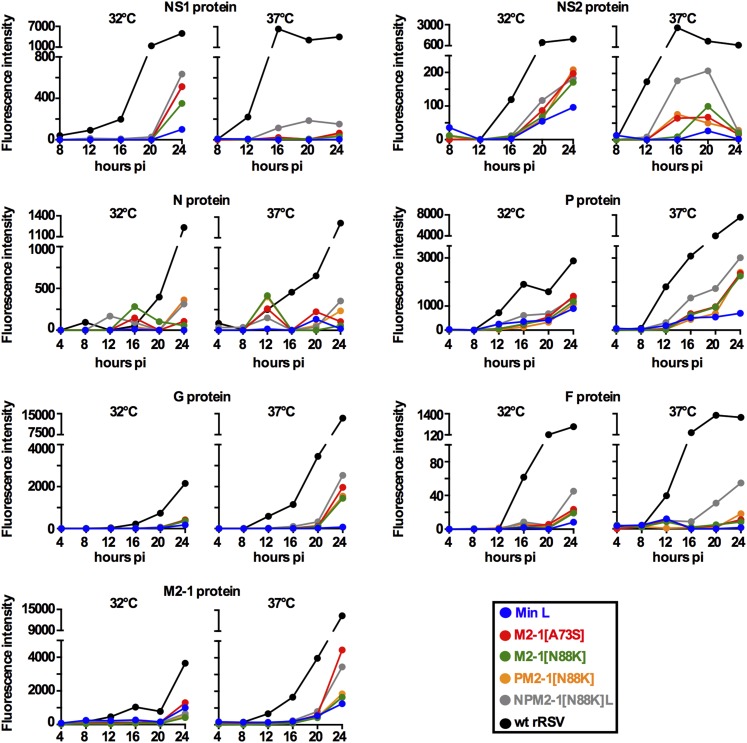
Analysis of the accumulation of the nine smaller RSV mRNAs (i.e., all except L) was performed by positive sense-specific quantitative RT-PCR (qRT-PCR) assays specific for each mRNA. Data for the P mRNA, which are generally representative, are shown in Fig. 4A, and the complete dataset for these nine mRNAs is shown in Fig. S3. In general, transcription was greatly reduced at 37 °C for Min L compared with WT rRSV. The introduction of either M2-1 mutation into Min L resulted in a substantial restoration of transcription. The further addition of the N, P, and L mutations to M2-1[N88K] provided an additional modest, but mostly consistent, increase. Western blot analysis showed that, as expected, the viral protein accumulation occurred later than that of the mRNAs; otherwise, the pattern was similar to the mRNA accumulation but reduced compared with WT (Fig. 4B and Fig. S4).
Fig. S3.
Contributions of specific mutations to the phenotypes of Min L derivatives: qRT-PCR of cell-associated positive sense RNA (mRNA and antigenome) (related to Fig. 4). Fig. 4A shows qRT-PCR data for the P mRNA during infection of Vero cells with WT rRSV, Min L, and Min L derivatives. The corresponding data for the NS1, NS2, N, M, SH, G, F, and M2 mRNAs are shown here.
Fig. S4.
Contributions of specific mutations to the phenotypes of Min L derivatives: protein expression of Min L and Min L-derived mutants (related to Fig. 4). Vero cells were infected at an MOI of 3 pfu per cell at 32 °C or 37 °C with Min L, M2-1[A73S], M2-1[N88K], PM2-1[N88K], NPM2-1[N88K]L, or WT rRSV. Every 4 h from 4 to 24 h pi, total cell lysates were harvested from one well of a six-well plate in NuPage LDS Sample Buffer (Life Technologies). Western blot analysis of NS1, NS2, N, P, G, F, and M2-1 was performed as described in Materials and Methods. The GAPDH protein was used as a loading control. Membranes were scanned on the Odyssey Infrared Imaging System. Data collected were analyzed using Odyssey software, version 3.0. For quantification of identified RSV proteins of interest, background fluorescence was corrected. Values reported indicate the median fluorescence intensity per protein band.
We also examined the accumulation of the RSV L mRNA by positive sense-specific, L-specific qRT-PCR (Fig. 4C). At 32 °C, a basal level of L mRNA was detected in Min L-infected cells, but there was essentially no increase with time in contrast to the progressive increase with time observed with WT L mRNA. Note that the extensive sequence differences in the WT and CPD L genes necessitated the use of different primer pairs for WT rRSV vs. Min L derivatives, precluding direct comparison of relative abundances at the different time points. At 37 °C, CPD L mRNA was undetectable, indicating a strong restriction at this temperature. The addition of the M2-1[N88K] or [A73S] mutation to Min L partly restored CPD L gene transcription at both 32 °C and 37 °C. The additional inclusion of the N, P, and L mutations further increased L gene expression.
The production of cell-associated genomic RNA (Fig. 4D) by Min L was almost undetectable at either 32 °C or 37 °C but was detected at 24 h postinfection (pi) at both 32 °C and 37 °C by M2-1[A73S] and M2-1[N88K] and in further increased amounts in NPM2-1[N88K]L–infected cells. Genomic RNA production by WT rRSV was detectable starting at 12 h pi at both 32 °C and 37 °C, and it was higher compared with NPM2-1[N88K]L.
The production of infectious virus particles was concurrent with the accumulation of genomic RNA (Fig. 4E). At 32 °C, Min L virus titers started to increase only at 24 h pi, whereas no increase was detected at 37 °C. M2-1[A73S] and M2-1[N88K] virus particles started to accumulate earlier (20 h pi at both temperatures) and at higher levels (6- and 110-fold higher at 32 °C and 37 °C, respectively) than Min L particles. NPM2-1[N88K]L virus production was first detected at 16 h pi at both temperatures and also, greater amounts (9- and 300-fold higher at 32 °C and 37 °C, respectively) than Min L virus production. Infectious WT rRSV was first observed at 12 h pi at both temperatures (Fig. 4E) at higher level than NPM2-1[N88K]L (10-fold higher at both 32 °C and 37 °C).
We also measured plaque sizes produced in Vero cells as an additional parameter for virus fitness (Fig. 4 F and G). WT rRSV produced plaques of significantly larger size than Min L (P < 0.05). Addition of the M2-1 [A73S] or [N88K] mutations to Min L increased virus fitness, resulting in plaque sizes that were not significantly different from those of WT rRSV (P > 0.05 compared with WT rRSV). Plaques induced by M2-1[A73S][N88K] were smaller than Min L plaques, further confirming that these two M2-1 mutations are incompatible.
Introduction of in Vitro Deattenuating Mutations from Min L into Min FLC Had Little Effect.
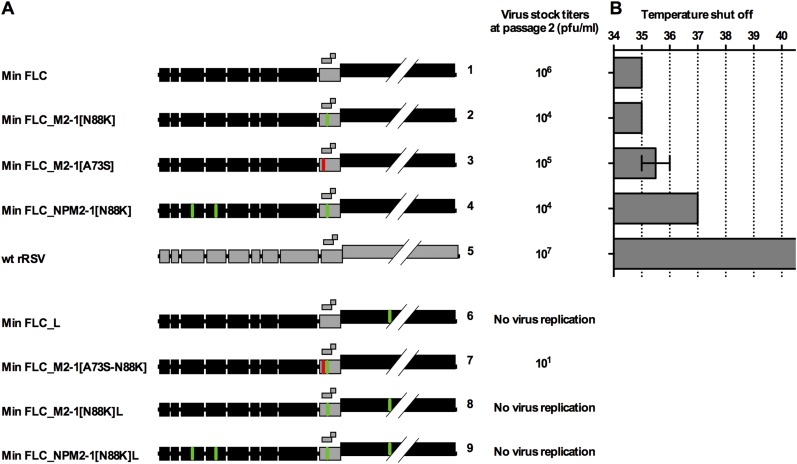
The major mutations that were introduced into Min L as described above, namely N[K136R], P[E114V], M2-1[N88K], M2-1[A73S], and L[T1166I], were introduced in various combinations into Min FLC and assessed for virus titer after recovery (Fig. S5A) and TSH (Fig. S5B). The M2-1[N88K] and [A73S] mutations individually did not increase the fitness of Min FLC as measured by viral titer or TSH. The combination of the N, P, and M2-1[N88K] mutations conferred a 2 °C increase in TSH, but this virus only grew to a low titer. Surprisingly, the introduction of the L[T1166I] mutation into Min FLC alone or in combinations with one or more of the other mutations seemed to inhibit recovery. Thus, none of these mutations improved the overall fitness of Min FLC, although it bears the same CPD L gene as Min L. This result suggests that multiple CPD ORFs augment phenotypic stability under selective pressure.
Fig. S5.
TSH of Min FLC-derived mutants. We investigated the effects of the mutations involved in the loss of temperature sensitivity of Min L on Min FLC temperature sensitivity. (A) To do so, mutations that were identified in Min L lineage 3 (in N, P, M2-1[N88K], and L genes) or 8 (M2-1 mutation [A73S]) were reintroduced alone or in the indicated combinations into Min FLC backbone, and the derived cDNA was completely sequenced by Sanger sequencing. Viruses were rescued by reverse genetics and passaged once, and virus stocks at P2 were titrated. Because of the low virus titer of most of the virus stocks, only the mutant virus Min FLC_M2-1[A73S] was completely sequenced by Sanger sequencing. (B) The Ts phenotype of some of these Min FLC-derived mutants was evaluated by efficiency of plaque formation at 32 °C, 35 °C, 36 °C, 37 °C, 38 °C, 39 °C, and 40 °C. Plaque assays were performed on Vero cells in duplicate and incubated in sealed caskets at various temperatures in temperature-controlled water baths as previously described. The experiment was done twice. The median values and the SDs are indicated.
Evaluation of M2-1 Derivatives in Mice and Hamsters.
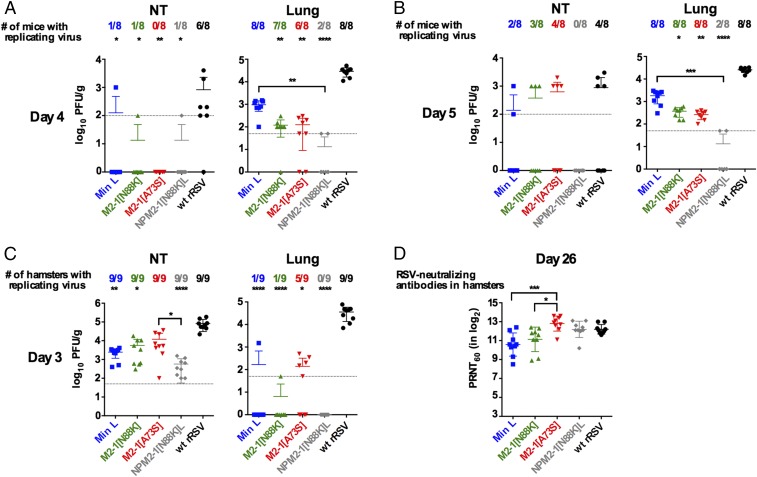
We evaluated replication of the Min L derivatives in vivo (Fig. 5). BALB/c mice were infected intranasally (IN) with 106 pfu each virus. Nasal turbinates (NTs) and lungs were harvested on days 4 (n = 8 per virus), 5 (n = 8), and 10 (n = 4) pi. At the peak of virus replication (day 5 pi) (Fig. 5B), virus was detected in the NTs of only two mice infected with Min L and three mice infected with M2-1[N88K]. Replication of M2-1[A73S] was detected in the NTs of four of five mice, which was comparable with WT rRSV. NPM2-1[N88K]L replication was not detected in the NTs of any of the mice. In the lungs on day 5, replication of M2-1[N88K] and M2-1[A73S] was slightly reduced compared with Min L but was not statistically different, and replication of NPM2-1[N88K]L was strongly reduced in the lungs compared with Min L and detected in only two animals. At day 10, virus was recovered only from two animals in the M2-1[A73S] group at trace levels.
Fig. 5.
Analysis of Min L derivatives in rodents shows differing effects of M2-1 mutations A73S and N88K and identifies the improved vaccine candidate NPM2-1[N88K]L. Replication of Min L, Min L mutants, and WT rRSV in mice at days (A) 4 and (B) 5 pi or (C) in hamsters at day 3 pi. Groups of (A and B) 20 mice or (C) 18 hamsters were infected IN with 106 pfu indicated virus per animal. At days (A) 4, (B) 5, and 10 pi for the mouse study or (C) at day 3 for the hamster study, RSV titers in NTs and lungs were determined as described in Materials and Methods. The limit of detection is indicated by a dotted line. (D) RSV-neutralizing antibodies at day 26 in hamsters from nine hamsters per group. The 60% plaque reduction neutralizing antibody titer (PRNT60) values were determined as described previously (22). Statistical differences compared with WT rRSV are indicated on the top of each graph; statistical differences between Min L and the Min L-derived mutants are indicated by brackets. *P ≤ 0.05; **P ≤ 0.01; ***P ≤ 0.001; ****P ≤ 0.0001.
We also compared the same set of viruses in hamsters (Fig. 5C). On day 3, NTs and lungs were harvested from nine hamsters per virus. In the NTs, Min L replication was reduced ∼100-fold compared with WT rRSV (P ≤ 0.01). Replication of M2-1[N88K] was modestly increased compared with Min L but remained significantly attenuated compared with WT rRSV. In contrast, the titers of M2-1[A73S] were further increased compared with Min L and were not statistically different from WT rRSV. Interestingly, replication of NPM2-1[N88K]L in the NTs was reduced compared with Min L. In the lungs, Min L and M2-1[N88K] were detected in only one of nine hamsters for each virus, and replication of NPM2-1[N88K]L was undetectable. In contrast, replication of M2-1[A73S] was increased compared with Min L, because five of nine hamsters exhibited virus replication to about 102 pfu/g. Thus, in hamsters, the mutation M2-1[A73S] increased the replication of Min L, a marker of deattenuation, whereas the M2-1[N88K] mutation did not affect the replication of Min L, and the combination of the N, P, L, and M2-1[N88K] mutations decreased replication.
Despite a significant restriction of replication, Min L and the Min L-derived viruses induced titers of antibodies that were not statistically different from those induced by WT rRSV (Fig. 5D). The M2-1[A73S] virus induced significantly higher levels of RSV-neutralizing serum antibodies than Min L and M21-1[N88K]. Interestingly, the NPM2-1[N88K]L virus also was comparable with WT rRSV in inducing RSV-neutralizing antibodies, despite its highly restricted replication. On day 31, hamsters were challenged IN with WT rRSV, and NTs and lungs were harvested 3 d postchallenge. No detectable challenge virus replication was detected, except for a trace of virus in one animal in the Min L group.
Genetic Stability of the NPM2-1[N88K]L Virus.
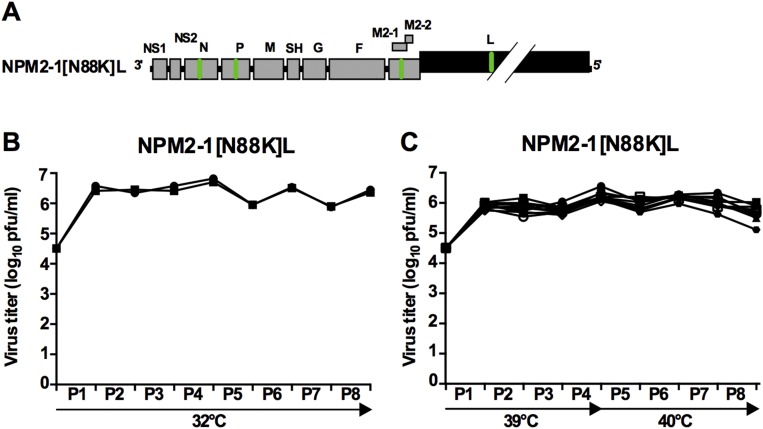
The observation that the NPM2-1[N88K]L virus was more highly attenuated than Min L and yet, as immunogenic as WT rRSV identified this virus as a promising vaccine candidate. Therefore, we evaluated its stability in a temperature stress test involving four passages at 39 °C and four passages at 40 °C, corresponding to 2 mo of continuous passage (Fig. S6). Sanger sequencing of the complete genome of the final passage of 10 different stressed lineages and two control flasks did not detect any abundant mutations. These data showed that introduction of the N, P, M2-1[N88K], and L mutations into Min L to create the promising NPM2-1[N88K]L virus conferred genetic stability.
Fig. S6.
NPM2-1[N88K]L is phenotypically stable under a temperature stress test. (A) Schematic representation of the RSV genome organization. The abbreviated gene name is indicated. Genes with WT or CPD ORFs are indicted by gray and black shading, respectively. Mutations in N, P, M2-1, and L that were identified in lineage 3 and introduced into Min L backbone to generate the NPM2-1[N88K]L virus are indicated by green bars in the virus genome. Final virus titers (B) at 32 °C and (C) from the temperature stress passages (increasing temperatures are indicated below the x axis). Each symbol represents one replicate.
Discussion
Synonymous genome recoding of a number of RNA viruses has yielded a diverse spectrum of potential live attenuated vaccine candidates (2). However, the stability of such candidates under strong selective pressure had not been investigated. Before clinical vaccine studies are initiated, it is paramount to evaluate the stability of attenuation. In this study, we found that the RSV vaccine candidate Min FLC was genetically and phenotypically stable during 7 mo of passage in vitro at the permissive temperature of 32 °C as well as under conditions of increasing temperature during passage. These data are strong evidence for the stability of Min FLC and validates the safety of CPD of multiple genes for the development of live attenuated vaccines for RSV and related viruses, provided that extensive CPD is used.
The other vaccine candidate, Min L, was highly stable at 32 °C. Surprisingly, despite the large number of changes involved in its CPD, Min L quickly lost a substantial amount of its temperature sensitivity during the temperature stress test. Deep sequencing of the Min L lineages identified mutations in all but the NS2 ORF rather than specifically in the CPD L ORF as might have been expected. Surprisingly, many of the mutations in L occurred at nucleotides and codons that were not involved in CPD. Most of the mutations in the various ORFs involved changes in amino acid coding. This positive selection for amino acid change suggests that at least part of the adaptation of Min L to selective stress involved changes in structure/function in various viral proteins.
The most prominent mutations acquired under stress were two missense mutations ([A73S] and [N88K]) in the M2-1 ORF, encoding the RSV transcription antitermination factor. Reintroduction of either of these mutations into Min L by reverse genetics rescued a substantial part of its replicative fitness at 37 °C, increasing viral gene transcription, protein expression, particle production, and plaque size. Notably, the increase in the expression of CPD L mRNA was evident early in infection (e.g., 4 h pi), whereas increases in the expression of the other viral mRNAs occurred later (e.g., 12 h or more pi). Furthermore, the increase in the early expression of CPD L mRNA was enhanced by the further inclusion of the N, P, and L mutations. We believe that these observations argue for a direct effect on increasing the efficiency of transcription of the CPD L gene. An alternative possibility, suggested by the normal activity of M2-1 in promoting transcriptional read through, is that the mutations in M2-1 increased read through across all of the RSV genes, resulting in the delivery of more polymerase to downstream genes, including L. However, this alternative model seems inconsistent with the kinetics of mRNA expression and the augmenting effects of the N, P, and L mutations as noted above. The partial restoration of L gene expression, which otherwise was below the level of detection at 37 °C, would be expected to increase the production of the L polymerase, although that was not directly monitored here because of its low abundance and a lack of available antibody. An increase in the production of L protein would then increase transcription of all of the RSV genes (consistent with their delayed kinetics of increase), indirectly increasing the synthesis of viral proteins, increasing RNA replication, and ultimately, indirectly increasing the production of progeny virus. Thus, we suggest that the acquisition of either of two mutations in M2-1 (and the N, P, and L mutations) adapted Min L at 37 °C by increasing transcription of the CPD L gene.
The mechanism(s) behind the rescued CPD L gene expression remain unknown. As noted, the mutations with the greatest effect were in the RSV M2-1 protein. This protein is necessary for the efficient synthesis of full-length mRNAs, which otherwise terminate prematurely (25). The M2-1 protein also increases the synthesis of polycistronic read-through mRNAs as noted. It likely binds nascent mRNA cotranscriptionally and prevents termination by the viral polymerase (26). In addition, the M2-1 protein binds directly to P (27). The binding of P and RNA to M2-1 was found to be mutually exclusive because of partially overlapping interaction surfaces (26, 28). Although A73 and N88 are away from the RNA/P binding interface, they could possibly be on the path of the exiting nascent RNA molecule. A simple model would be that the 1,378 nucleotide changes that were introduced during CPD affected the L gene template so as to reduce the efficiency of transcription elongation of the nascent L mRNA. L transcription was partly restored by the M2-1 mutations (and further enhanced by the N, P, and L mutations) through some effect on the polymerase complex, perhaps by reducing termination of the polymerase on the CPD template or nascent mRNA or by increasing processivity.
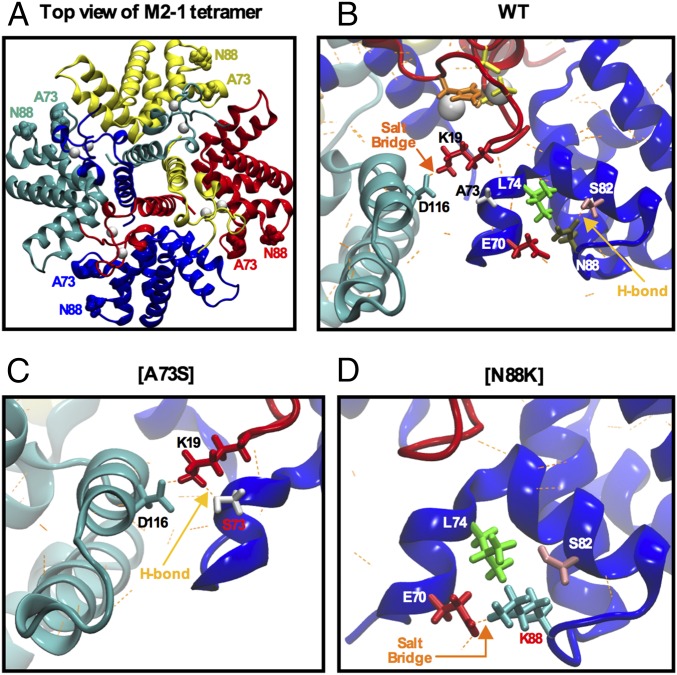
We used computer-based molecular dynamics simulations (MDSs) to investigate possible effects of the M2-1 [A73S] and [N88K] mutations on M2-1 structure (Fig. 6). The M2-1 tetramer is shown in Fig. 6A, with specific views in Fig. 6 B–D. In the WT M2-1 tetramer, a salt bridge is predicted to exist between K19 of one monomer and D116 of the adjoining monomer. These amino acids are shown for the red and cyan monomers (Fig. 6B). MDS suggests that the salt bridge helps stabilize the interaction between adjacent monomers. The A73 residue of a third monomer is predicted to be in close proximity but not involved in interactions. When A73 is changed to serine ([A73S]) (Fig. 6C), the salt bridge between K19 and D116 is predicted to be maintained. In addition, unlike the alanine, a serine at codon 73 is predicted to form a hydrogen bond with K19 and in some MDS timeframes, a hydrogen bond with D116. Thus, S73 could provide stabilizing links between each adjoining monomers. The predicted effect of the N88K mutation is to increase stability within rather than between monomers. Specifically, in the WT M2-1 tetramer structure, N88 is predicted to form a hydrogen bond with S82 (Fig. 6B). In contrast, a lysine residue at codon 88 is predicted to form an intramonomer salt bridge with E70 (Fig. 6D). The K88 would no longer interact with S82. In addition, the hydrophobic carbon chain of K88 is predicted to form a number of intramonomer van der Waals interactions with L74. Thus, the prominent M2-1 mutations acquired during the stress test are predicted to create interactions between (A73S) and within (N88K) M2-1 monomers. This increased stability presumably could contribute to rescue transcription of the CPD L gene. Interestingly, this increased stability is not expected to be maintained when both mutations are present together. Indeed, these two mutations could possibly form an H-bonded pair between the side chains of the S73 and K88, which would result in less flexibility of the loop on which K88 resides. This reduced flexibility could explain the incompatibility of these two mutations.
Fig. 6.
Molecular modeling of the impact of deattenuating mutations on the M2-1 tetramer. (A) Top view of the WT M2-1 tetramer. Each monomer is represented by a different color (yellow, red, blue, and cyan). A73 and N88 are colored in each monomer and rendered as van der Waals spheres. Gray spheres represent zinc atoms. (B) Enlargement of one WT tetramer’s region that contains amino acids A73 and N88. The residues K19 and D116 that are in close proximity to A73 are indicated in black, and their side chains are colored in red, cyan, and gray, respectively. The residues L74, S82, and E70 that are in the close proximity of N88 are indicated in white, and their side chains are colored in green, pink, red, and brown, respectively. The putative salt bridge and the hydrogen bond are indicated by orange and yellow arrows, respectively. (C) Molecular dynamics snapshot of the region proximal to the S73 mutation. The [A73S] mutation is shown in red, and the yellow arrow indicates the predicted new hydrogen bond. (D) Molecular dynamics snapshot of the K88 mutant region. The [N88K] mutation is indicated in red, with its side chain colored in cyan, and an orange arrow indicates the expected new salt bridge.
Interestingly, mutations that were found in P ([E113G] and [E114V]) are localized in the interaction domain of P with M2-1. Mutations at these two positions were shown to increase the affinity of P for M2-1 (29). This work further supports the theory that the compensatory mutations act by increasing the stability of the ribonucleoprotein complex, which we hypothesize may facilitate transcription of the CPD L gene.
As mentioned, a single mutation in the M2-1 gene (A73S) that appeared in the first passage of Min L at 37 °C and was found in 8 of 10 cultures was sufficient to rescue Min L replication at that temperature. In addition, this single mutation conferred increased replication to Min L in hamsters. We had anticipated that deattenuation of a CPD ORF would involve multiple changes in the CPD sequence conferring incremental deattenuation. However, this study shows that a single mutation in a different gene was sufficient to yield substantial deattenuation. Therefore, deoptimization involving large numbers of nucleotide changes does not necessarily provide a stable attenuation phenotype. However, analysis of the presumptive in vitro deattenuating mutations that appeared during passage of Min L in vitro and incorporation of several of these mutations into Min L resulted in an improved vaccine candidate. Specifically, the NPM2-1[N88K]L virus (TSH of 40 °C) represents a substantial improvement over Min L for a number of reasons. (i) It exhibited increased replication compared with Min L in Vero cells, important for vaccine manufacture. (ii) It did not accumulate additional mutations when passaged in stress tests at 39 °C to 40 °C. (iii) Of paramount importance, the virus was significantly more attenuated in vivo than Min L but as immunogenic as WT rRSV. (iv) Furthermore, because the M2-1[N88K] and [A73S] mutations are incompatible, this virus should be highly refractory to acquiring the M2-1[A73S] mutation that was deattenuating in the hamster model. Therefore, NPM2-1[N88K]L is an improved vaccine candidate, appropriate for evaluation in a clinical study.
Materials and Methods
Detailed protocols are in SI Materials and Methods.
Virus Harvest and Titration.
Vero cells were scraped into the tissue culture medium, vortexed for 30 s, clarified by low-speed centrifugation, and snap-frozen. Virus titers in the clarified fluids were determined by immunoplaque assay on Vero cells at 32 °C (22).
Ion Torrent Deep Sequencing.
Purified viral RNA from clarified culture fluids was copied into eight overlapping fragments spanning the viral genome. Libraries were prepared following the Ion Torrent protocol, loaded into a semiconductor sequencing chip, and sequenced on a Personal Genome Machine (Ion Torrent). A nucleotide variant was called if it occurred >50 times with an average read depth of 1,000× and a P value < 10−7 (quality score > 70) (30).
Deep Sequencing of Long PCR Fragments.
Purified viral RNA from culture fluids was reverse-transcribed using the Maxima H Minus First Strand cDNA Synthesis Kit (Thermo Scientific). Using RSV-specific primers and the SequalPrep Long PCR Kit (Life Technologies), the cDNAs were used to generate a PCR product of 8.2 kb spanning the genome from the 3′ end to the middle of the M2-2 ORF. DNA template libraries were prepared, sequenced, and analyzed using PacBio kits and instrumentation and CluCon software (https://github.com/mpsbpbi/clusteringConsensus).
Strand-Specific rRSV RNA Quantification.
Cell-associated RNA derived from single-cycle replication experiments was used to specifically quantify viral negative sense (genomic) and positive sense (mRNA and antigenomic) RNA as described previously (22). Quantitative PCR (qPCR) results were analyzed using the comparative threshold cycle (∆Ct) method, normalized to 18S rRNA, and then, expressed as log2 fold increase over the indicated reference sample.
Evaluation of the Replication of CPD rRSVs in Mice and Hamsters.
Animal studies were approved by the National Institute of Allergy and Infectious Diseases Animal Care and Use Committee and performed using previously described methods (22).
Molecular Dynamics Analysis of M2-1 Tetramer.
Mutations were introduced to the crystal structure of the transcription antiterminator M2-1 protein of human RSV (Protein Data Bank ID code 4C3D) (26) using the SYBYL program (Certara). MDSs were performed using the NAMD program (v.2.9).
Statistical Analysis.
Distributions of the plaques sizes were analyzed using the Kolmogorov–Smirnov test followed by Bonferroni correction. Virus replication and antibody responses in the animal experiments were analyzed using the nonparametric Kruskal–Wallis test with Dunn’s posthoc analysis. A log10 transformation was applied to datasets when necessary to obtain equal SDs among groups. Statistics were performed using Prism 6 (GraphPad Software). Data were only considered significant at P ≤ 0.05.
SI Materials and Methods
Generation of Min L and Min FLC.
The design of the CPD RSV genes and the construction and rescue of Min L and Min FLC have been described previously (22). Briefly, previously described computational algorithms (8) were used to design CPD ORFs based on the RSV strain A2. Min L contains the CPD L ORF, which exhibits 1,378 silent mutations compared with WT L ORF. Min FLC (for FLC) contained all CPD ORFs except M2-1 and M2-2, which were kept unmodified, because these overlapping ORFs engage in coupled stop–start translation that depends on sequence (and possibly, secondary structure) that is presently incompletely defined. Min FLC contains 2,692 silent mutations compared with WT RSV. The amino acid sequence of Min L and Min FLC is identical to that of WT RSV. The viruses were constructed using the RSV 6120 backbone, which has a 112-nt deletion in the downstream noncoding region of the SH gene and five silent nucleotide point mutations involving the last three codons and termination codon of the SH ORF. These changes in the SH gene stabilized the RSV cDNA during propagation in Escherichia coli (31). WT RSV in this study was the 6120 virus. Min L and Min FLC virus stocks were completely sequenced by Sanger and Ion Torrent deep sequencing and found free of adventitious mutations.
Temperature Stress of CPD Viruses in Cell Culture.
We previously found that Min L and Min FLC were temperature-sensitive (22). Min L and Min FLC have temperature shutoffs of 37 °C and 35 °C on Vero cells, respectively (22). The genetic stability of Min L and Min FLC was evaluated in cell culture through a temperature stress test. Ten independent 25-cm2 flasks of Vero cells were infected with an initial MOI of 0.1 pfu per cell of Min L or Min FLC and incubated at the indicated starting temperatures until extensive cytopathology was observed. Viruses were harvested and serially passed at increasingly restrictive temperatures (1 °C temperature increase every other passage). In parallel, two replicates were passed at 32 °C (the nonrestrictive temperature), serving as controls; 1 mL (of a total of 5 mL) supernatant was used to inoculate the next passage. After each passage, aliquots were frozen for titration and sequence analysis by Sanger sequencing and/or deep sequencing as indicated. Virus titers were determined by plaque assay at the permissive temperature (32 °C) (22).
Ion Torrent Deep Sequencing.
Viral RNAs were extracted using the Qiagen Viral RNA Extraction Kit from the indicated aliquots of viruses that were passed during the temperature stress test of Min L or Min FLC. Viral RNAs were reverse-transcribed using the Superscript II RT (Life Technologies) following the manufacturer’s recommendations. Then, the cDNAs were amplified by PCR using RSV-specific primers and the pfx DNA Polymerase Enzyme (Life Technologies) in eight overlapping fragments that cover the whole viral genome. Each PCR product was purified using the QIAquick PCR Purification Kit (Qiagen).
Equal amounts of DNA from each of eight PCR reactions were pooled into a 1.5-mL LoBind Tube (Eppendorf). The DNA was subjected to enzymatic shearing using the ShearEnzyme (Ion Torrent) for 30 min at 37 °C in a heat block. The sheared DNA was then purified using 1.8 vol Agencourt Magnetic Beads (Beckman). The Agencourt beads were washed twice with 0.2 mL 70% (vol/vol) ethanol, air dried for 5 min, and resuspended with 20–30 μL 10 mM Tris⋅HCl, pH 7.5, buffer followed by incubation at room temperature for 5 min. DNA was recovered in the supernatant by placing the 1.5-mL LoBind Tube containing the Agencourt beads on a magnetic rack for 2 min. The DNA was treated with end-repairing enzyme (Ion Torrent) according to the manufacturer’s instructions. The end-repaired DNA was purified with 1.8 vol Agencourt beads and recovered in a magnetic rack as described above.
Approximately 100 ng repaired DNA from each sample was used to ligate with a specific barcode adapter and a sequencing adaptor in a 20-μL reaction volume containing ligase and buffer (Ion Torrent) according to the manufacturer’s instruction. The ligation reaction was carried out at room temperature for 30 min and terminated by adding 4 μL 0.5 M EDTA, pH 8.0. Equal volumes of different ligated DNA libraries were then combined in a 1.5-mL LoBind Tube and purified with 1.8 vol Agencount, and the DNA libraries were recovered as described above. The DNA further underwent nick translation using Bst 2.0 DNA Polymerase and Buffer (NEB). Digested DNA was purified using a spin column MinElute Kit (Qiagen).
Approximately 100 ng DNA libraries were then added into a PCR mix using the Platinum High Fidelity DNA Polymerase Master Mix (Life Technologies) followed by two cycles of PCR amplification at 95 °C for 10 min, two cycles at 95 °C for 30 s, two cycles at 58 °C for 30 s, and two cycles at 72 °C for 30 s The PCR products were further purified with 1.8 vol Agencourt, and DNA was recovered using a magnetic rack as described above. The DNA was quantified using the Qubit System (Invitrogen).
Approximately 70 million DNA molecules in 1 mL PCR solution were mixed with a fixed ratio (0.5–1.0) of Ion Sphere Particles (ISPs; Ion Torrent) in the presence of PCR mix and oil (Ion Torrent) to form tens of millions of droplets of emulsion particles. These droplets were passed through an enclosed capillary PCR plate in OneTouch (Ion Torrent), which carried out the emulsion PCR amplification as the liquid and particles passed through the plate continuously. The ISPs were recovered by centrifugation in OneTouch in a pair of collection tubes. At the end of the OneTouch emulsion PCR, the collection tubes were centrifuged for 3 min at 15,000 × g to remove most supernatant. The ISPs were washed once in 1 mL wash buffer (Ion Torrent) and centrifuged for 3 min at 15,500 × g to remove most supernatant. ISPs containing amplified DNA were further enriched from ISPs without DNA by incubating with Dynabeads MyOne Streptavidin C1 Magnetic Beads at room temperature for 10 min in a rotating rack. The enriched ISPs were recovered by placing the tube on a magnetic rack for 2 min and washed twice with 0.2 mL wash buffer by pipetting and placing on a magnetic rack for 2 min and discarding the supernatant. The ISPs were eluted from the Dynabeads MyOne Streptavidin C1 Magnetic Beads by incubation with 0.4 mL 0.125 N NaOH and 0.1% Tween-20 for 7 min at room temperature in a rotating rack. The eluted ISPs were washed twice with wash buffer and centrifuged for 4 min at 15,500 × g to remove most of the supernatant. The ISPs were resuspended by pipetting and placed on a magnetic rack for 2 min to remove the last traces of Dynabeads MyOne Beads.
One hundred microliters solution was transferred to a new tube as the final library of ISPs ready for QC testing and sequencing. For sequencing, the ISPs were centrifuged for 3 min at 15,500 × g to remove most of the supernatant. The ISPs were resuspended by pipetting and transferred into a 0.2-mL PCR tube containing 150 µL annealing buffer. Five-microliter Control Ion Spheres (Ion Torrent) were added to the ISPs mix and centrifuged for 3 min at 15,500 × g to remove most supernatant from the top to leave 15 μL at the bottom followed by adding 12 µL sequencing primer denatured and annealed at 95 °C for 2 min and 2 min at 37 °C. Three microliters DNA polymerase (Ion Torrent) was added, and samples were loaded into a semiconductor sequencing chip 316 or 318 (Ion Torrent) to perform DNA sequencing on a Personal Genome Machine (Ion Torrent).
DNA sequences were analyzed against Min FLC or Min L reference sequences using VariantCaller 3.2 software from Ion Torrent on the Ion Torrent Server. The analysis pipeline was set at the default somatic variant configuration. A nucleotide variant was called if the variant occurred >50 times with an average read depth of 1,000× and a P value < 10−7 (quality score > 70) as previously described (30). The raw read data were also manually verified using a genome browser IVG (The Broad Institute).
PacBio Long-Range Deep Sequencing.
We also investigated by deep sequencing the coexistence or not of mutations that arose in the M2-1 and P genes during the first four passages of Min L lineage 3 at 38 °C and 39 °C. To do so, viral RNAs from aliquots of viruses derived from these passages were extracted using the Qiagen Viral Extraction Kit as described above. Then, the viral RNAs were reverse-transcribed using the Maxima H Minus First-Strand cDNA Synthesis Kit (Thermo Scientific) following the manufacturer’s recommendations. Using RSV-specific primers and the SequalPrep Long PCR Kit (Life Technologies), cDNAs were then used to generate a PCR product of 8.2 kb that covered a region from the 3′ end of the genome to the M2-2 gene.
To prepare PacBio SMRTbell DNA Template Libraries, PCR products were purified as described above and then, concentrated using 0.45 vol AMPure PB Magnetic Beads. To allow the DNA to bind to beads, the mixture was mixed in a VWR Vortex Mixer at 2,000 rpm for 10 min at room temperature. After a short spinning to pellet beads, each tube was placed in a magnetic bead rack, and the supernatant was carefully discarded. Beads were then washed twice with 1.5 mL freshly prepared 70% (vol/vol) ethanol. After removal of the ethanol, the bead pellet was allowed to dry for about 1 min. Then, the tube was removed from the magnetic bead rack and centrifuged to pellet the beads. DNA was then eluted using the PacBio Elution Buffer. To repair any DNA damage, the concentrated DNA was incubated at 37 °C for 20 min in a LoBind Tube in DNA damage repair buffer, NAD+, ATP high, dNTP, and a DNA damage repair enzyme mix. Then, DNA was incubated at 25 °C for 5 min with a DNA end repair mix. After the reaction, DNA was purified using AMPure PB Beads as described above and eluted off the beads in 30 μL elution buffer.
Then, end-repaired DNA was annealed with a blunt end adapter in a reaction containing the adapter, buffer, ATP, and a ligase for 15 min at 25 °C. Ligase was inactivated at 65 °C for 10 min. Finally, an exonuclease step for 1 h at 37 °C was included to remove any failed ligation products. SMRTbell DNA Template Libraries were then purified three times using AMPure PB Beads as described above.
After purification, SMRTbell Library Templates were sequenced in SMRTcells with the PacBio RSII instrument using the PacBio DNA Polymerase Binding Kit P6. Each sample library was sequenced on two SMRTcells using MagBead loading and movie collection time of 240 min.
Data were analyzed using CluCon software (https://github.com/mpsbpbi/clusteringConsensus). All reads were aligned to the reference Min L sequence. Only reads that span 99% of the full target (8,161 bases or greater) were analyzed, yielding 32,738 near full-length reads per time point on average (minimum of 24,131 reads; maximum of 41,118 reads). The algorithm identifies variant positions by examining the alignments and finding positions where the minor frequencies observed cannot be explained statistically by chance noise. Fully phased haplotypes are then estimated by tallying what was sequenced in each of the near full-length reads at the variant positions. A statistical test is used to discard “noisy” haplotypes or those that are simply explained by other true observed haplotypes that have been corrupted by sequencing noise.
Introduction of Mutation(s) and Generation of CPD Viruses.
Mutations identified in the N, P, M2-1, and L genes during the stress test of Min L were reintroduced in the indicated combinations into the Min L, Min FLC, or WT cDNA backbones using the Quickchange Lightning Site-Directed Mutagenesis Kit (Agilent) following the manufacturer’s recommendations. cDNAs were completely sequenced by Sanger sequencing using a set of specific primers. CPD viruses with targeted mutations were then rescued from cDNA as described previously (22). Briefly, BSR T7/5 cells were transfected using Lipofectamine 2000 (Life Technologies) and a plasmid mixture containing 5 μg full-length cDNA, 2 μg each pTM1-N and pTM1-P, and 1 μg each pTM1-M2-1 and pTM1-L. After overnight incubation at 37 °C, transfected cells were harvested by scraping into media, added to subconfluent monolayers of Vero cells, and incubated at 32 °C. The rescued viruses were harvested between 11 and 14 d posttransfection.
Virus Growth and Titration.
After rescue, all CPD rRSVs were propagated once on Vero cells at 32 °C in media containing 2% FBS. Virus stocks were generated by scraping infected cells into media followed by vortexing for 30 s and clarification of the supernatant by centrifugation. Virus aliquots were snap-frozen and stored at −80 °C. Virus titers were determined by plaque assay on Vero cells with a 0.8% methylcellulose overlay. After a 10- to 12-d incubation at 32 °C, plates were fixed with 80% (vol/vol) cold methanol, and plaques were visualized by immunostaining with a mixture of three RSV-specific mAbs (22). Titers were expressed as pfu per 1 ml. Viral RNA was isolated from all virus stocks, and sequence analysis of the viral genomes was performed from overlapping RT-PCR fragments by Sanger sequencing, confirming that the genomic sequences of the recombinant viruses were correct and free of adventitious mutations. The only sequences that were not directly confirmed for each genome were the positions of the outermost primers, namely nucleotides 1–23 and 15,174–15,222.
Determination of the Temperature Shutoff of CPD rRSVs.
The Ts phenotype of each of the rRSV viruses was evaluated by efficiency of plaque formation at 32 °C, 35 °C, 36 °C, 37 °C, 38 °C, 39 °C, and 40 °C. Plaque assays were performed on Vero cells in duplicate and incubated in sealed caskets at various temperatures in temperature-controlled water baths as previously described (22). The TSH is defined as the lowest restrictive temperature at which there is a reduction in plaque number compared with 32 °C that is 100-fold or greater than that observed for WT RSV at the two temperatures.
Kinetics of Virus Replication in Vitro.
Multicycle and single-cycle growth kinetics were performed on confluent monolayers of Vero cells at both 32 °C and 37 °C in six-well plates.
In the multicycle growth kinetic experiments, Vero cells were infected in duplicate at an MOI of 0.01 pfu per cell with the indicated viruses. From day 0 to 14, viruses were collected by scraping infected cells into media followed by vortexing for 30 s and clarification of the supernatant by centrifugation. Virus inoculum and the daily aliquots were snap-frozen and stored at −80 °C. Virus titers were determined by plaque assay as described above.
In the single-cycle growth kinetic experiments, three wells of Vero cells in six-well plates were infected at an MOI of 3 pfu per well at 32 °C or 37 °C with the indicated viruses. Every 4 h from 4 to 24 h pi, cell-associated RNA was collected from one well using the RNeasy Mini Kit (Qiagen) following the manufacturer’s instructions. For Western blot analysis, total cell lysates were collected in NuPage LDS Sample Buffer (Life Technologies) and then, homogenized using a QIAshredder Spin Column (Qiagen). Finally, the last well was used to collect virus and determine the virus titers as described above.
Strand-Specific rRSV RNA Quantification.
Cell-associated RNA derived from single-cycle replication experiments was used to specifically quantify viral negative sense (genomic) and positive sense (mRNA and antigenomic) RNA as described previously (22). Taqman assays for antigenomic/mRNA specific for each of 11 WT RSV genes were designed using Primer Express 3.0 software (Life Technologies). Specifically, for the L gene, three different Taqman assays were designed for the WT sequence, and four were designed for the CPD sequence.
One microgram DNA-digest RNA was reverse-transcribed using SuperScript III (Life Technologies) in a 20-μL reaction using a tagged first-strand primer specific to either genome or antigenomic/mRNA. After a fivefold dilution, each of the cDNAs was amplified in triplicate with a tag-specific primer, a second gene-specific primer, and a probe. Thus, only cDNAs containing the tagged RT primer sequence were amplified. The probe sequence was RSV gene-specific. To normalize results, 18S rRNA was quantified in parallel using first-strand cDNA generated with random primers and a standard 18S rRNA Taqman assay (Applied Biosystems). qPCR results were analyzed using the ∆Ct method, normalized to 18S rRNA, and then, expressed as log2 fold increase over the Min L 4-h time point, with the exception of WT L quantification, for which data were expressed as fold increase over the WT 4-h time point. Negative controls without first-strand primer were included for each of the strand-specific qPCRs to show the absence of nonspecific priming during first-strand cDNA synthesis.
Western Blot Analysis.
Cell lysates prepared from single-cycle infection experiments described above were separated on NuPAGE 4–12% (grams per 100 mL) Bis⋅Tris SDS/PAGE gels with MES Electrophoresis Buffer (Life Technologies) in parallel with Odyssey Two-Color Protein Molecular Weight Marker (Li-Cor); 30 μg proteins were transferred to polyvinylidene difluoride membranes (Millipore) in 1× NuPAGE buffer. The membranes were blocked with Odyssey blocking buffer (Li-Cor) and incubated with primary antibody in the presence of 0.1% Tween-20. The primary antibodies and the dilutions used were as follows: mouse anti-RSV N, P, G, F, and M2-1 mAbs (1:1,000) purchased from Abcam; rabbit polyclonal antiserum that recognized both NS1 and NS2 was generated by peptide immunization of rabbits (Abgent) with a synthetic peptide representing the C-terminal 14 amino acids of NS2 (the C termini of NS2 and NS1 are identical for the last 4 amino acids, which presumably accounts for the cross-reactivity); and rabbit anti-GAPDH polyclonal antibody (1:200) used as loading control (Santa-Cruz Biotechnologies, Inc.). The secondary antibodies used at a 1:15,000 dilution were goat anti-rabbit IgG IRDye 680 (Li-Cor) and goat anti-mouse IgG IRDye 800 (Li-Cor). Membranes were scanned on the Odyssey Infrared Imaging System. Data were analyzed using Odyssey software, version 3.0 (Li-Cor). For quantification of identified RSV proteins of interest, fluorescence signals were background-corrected. Values indicate the median fluorescence intensity of each protein band.
Determination of Plaques Sizes.
Virus plaque sizes were determined by plaque assay on Vero cells using 24-well plates. Vero cells monolayers were inoculated with 30 pfu per well of previously titered and sequenced virus stocks. After 2 h of adsorption, a 0.8% methylcellulose overlay was added to each well. After a 12-d incubation at 32 °C, plates were fixed with 80% cold methanol. Then, wells were incubated with a mixture of three RSV-specific mAbs in blocking buffer (Odyssey Buffer; Li-Cor) for 1 h. After washing with blocking buffer, plaques were stained with goat anti-mouse IRdye 680LT (Li-Cor) secondary antibody, and plaques were visualized using the Odyssey Infrared Imaging System. Images were analyzed using ImageJ, and the areas of more than 1,000 plaques per virus were measured and expressed in pixel2. Distribution of the virus plaque sizes was compared for statistical significance using the Kolmogorov–Smirnov test followed by Bonferroni correction (Prism 6.0; GraphPad). Sets of data were only considered statistically different at P ≤ 0.05.
Evaluation of the Replication of CPD rRSVs in Mice.
All animal studies were approved by the NIH Institutional Animal Care and Use Committee. Replication of CPD viruses was evaluated in the upper and lower respiratory tracts of 6-wk-old BALB/c mice as described previously (22). Groups of 20 mice were inoculated IN under isoflurane anesthesia with 106 pfu WT rRSV, Min L, M2-1[A73S], M2-1[N88K], or NPM2-1[N88K]L. On days 4 and 5, eight mice from each group were killed by carbon dioxide inhalation. The remaining four mice in each group were killed on day 10. NTs and lung tissues were harvested and homogenized separately in Leibovitz (L)-15 medium containing 1× sucrose phosphate glutamate, 2% l-glutamine, 0.06 mg/mL ciprofloxacin, 0.06 mg/mL clindamycin phosphate, 0.05 mg/mL gentamycin, and 0.0025 mg/mL amphotericin B. Virus titers were determined in duplicate on Vero cells incubated at 32 °C as described above. The limits of virus detection were 100 and 50 pfu/g for the NT and lung specimens, respectively.
Evaluation of the Replication and Immunogenicity of CPD rRSVs in Hamsters.
Replication of CPD viruses was evaluated in the upper and lower respiratory tracts of 6-wk-old Golden Syrian hamsters, and immunogenicity was also investigated. On day 0, groups of 18 hamsters were inoculated IN under methoxyflurane anesthesia with 106 pfu WT rRSV, Min L, M2-1[A73S], M2-1[N88K], or NPM2-1[N88K]L.
On day 3, which corresponds to the peak of replication of WT rRSV in hamsters (data not shown), nine hamsters from each group were killed by carbon dioxide inhalation. NT and lung tissue were harvested and homogenized as described above. Virus titers were determined in duplicate on Vero cells incubated at 32 °C as described above. The limit of virus detection was 50 pfu/g in the NTs and lungs.
Two days before immunization and on day 26 postimmunization, blood from nine hamsters per group was collected for serum collection and to measure RSV antibody titers. On day 31, the hamsters were challenged by IN administration of 106 pfu WT rRSV. Three days after challenge, the hamsters were killed by carbon dioxide inhalation. NT and lung tissue were harvested, and WT rRSV titers were determined in duplicate on Vero cells incubated at 32 °C as described above.
Molecular Dynamics Analysis of M2-1 Tetramer.
Mutations were made to the crystal structure of the transcription antiterminator M2-1 protein of human RSV (Protein Data Bank ID code 4C3D) (26) using the SYBYL program (Certara). Mutants or WT RSV M2-1 were explicitly solvated with TIP3P water molecules and Na+ and Cl− counterions using the VMD program (32). All atom and isobaric–isothermal (1 atm, 310 K) MDSs were performed with periodic boundary conditions using the NAMD program (v.2.9) (33) on the Biowulf Linux cluster at the NIH (https://hpc.nih.gov) after explicitly solvating and energy-minimizing followed by warming to 310 K in 10-K increments. Electrostatic interactions were calculated using the Particle-Mesh Ewald summation. The CHARMM27 force field was used with CHARMM atom types and charges (34). For all simulations, a 2-fs integration time step was used along with a 12-Å cutoff. Langevin dynamics were used to maintain temperature at 310 K, and a modified Nosé–Hoover Langevin Piston was used to control pressure. Simulations were run for 100 ns.
Acknowledgments
This research was supported by the Intramural Research Program of the National Institute of Allergy and Infectious Diseases, NIH (C.L.N., T.M., M.A.D., M.M., L.Y., C.L., B.L., S. Munir, J.M.D., P.L.C., and U.J.B.).
Footnotes
Conflict of interest statement: C.L.N., J.M.D., S. Mueller, E.W., P.L.C., and U.J.B. are coinventors on a patent application for the development of respiratory syncytial virus vaccines by codon pair deoptimization.
This article contains supporting information online at www.pnas.org/lookup/suppl/doi:10.1073/pnas.1619242114/-/DCSupplemental.
References
- 1.Abil Z, Xiong X, Zhao H. Synthetic biology for therapeutic applications. Mol Pharm. 2015;12(2):322–331. doi: 10.1021/mp500392q. [DOI] [PMC free article] [PubMed] [Google Scholar]
- 2.Martínez MA, Jordan-Paiz A, Franco S, Nevot M. Synonymous virus genome recoding as a tool to impact viral fitness. Trends Microbiol. 2016;24(2):134–147. doi: 10.1016/j.tim.2015.11.002. [DOI] [PubMed] [Google Scholar]
- 3.Gaunt E, et al. Elevation of CpG frequencies in influenza A genome attenuates pathogenicity but enhances host response to infection. eLife. 2016;5:e12735. doi: 10.7554/eLife.12735. [DOI] [PMC free article] [PubMed] [Google Scholar]
- 4.Nogales A, et al. Influenza A virus attenuation by codon deoptimization of the NS gene for vaccine development. J Virol. 2014;88(18):10525–10540. doi: 10.1128/JVI.01565-14. [DOI] [PMC free article] [PubMed] [Google Scholar]
- 5.Broadbent AJ, et al. Evaluation of the attenuation, immunogenicity, and efficacy of a live virus vaccine generated by codon-pair bias de-optimization of the 2009 pandemic H1N1 influenza virus, in ferrets. Vaccine. 2016;34(4):563–570. doi: 10.1016/j.vaccine.2015.11.054. [DOI] [PMC free article] [PubMed] [Google Scholar]
- 6.Cheng BY, Ortiz-Riaño E, Nogales A, de la Torre JC, Martínez-Sobrido L. Development of live-attenuated arenavirus vaccines based on codon deoptimization. J Virol. 2015;89(7):3523–3533. doi: 10.1128/JVI.03401-14. [DOI] [PMC free article] [PubMed] [Google Scholar]
- 7.Diaz-San Segundo F, et al. Synonymous deoptimization of foot-and-mouth disease virus causes attenuation in vivo while inducing a strong neutralizing antibody response. J Virol. 2015;90(3):1298–1310. doi: 10.1128/JVI.02167-15. [DOI] [PMC free article] [PubMed] [Google Scholar]
- 8.Coleman JR, et al. Virus attenuation by genome-scale changes in codon pair bias. Science. 2008;320(5884):1784–1787. doi: 10.1126/science.1155761. [DOI] [PMC free article] [PubMed] [Google Scholar]
- 9.Yang C, Skiena S, Futcher B, Mueller S, Wimmer E. Deliberate reduction of hemagglutinin and neuraminidase expression of influenza virus leads to an ultraprotective live vaccine in mice. Proc Natl Acad Sci USA. 2013;110(23):9481–9486. doi: 10.1073/pnas.1307473110. [DOI] [PMC free article] [PubMed] [Google Scholar]
- 10.Kunec D, Osterrieder N. Codon pair bias is a direct consequence of dinucleotide bias. Cell Reports. 2016;14(1):55–67. doi: 10.1016/j.celrep.2015.12.011. [DOI] [PubMed] [Google Scholar]
- 11.Tulloch F, Atkinson NJ, Evans DJ, Ryan MD, Simmonds P. RNA virus attenuation by codon pair deoptimisation is an artefact of increases in CpG/UpA dinucleotide frequencies. eLife. 2014;3:e04531. doi: 10.7554/eLife.04531. [DOI] [PMC free article] [PubMed] [Google Scholar]
- 12.Lauring AS, Jones JO, Andino R. Rationalizing the development of live attenuated virus vaccines. Nat Biotechnol. 2010;28(6):573–579. doi: 10.1038/nbt.1635. [DOI] [PMC free article] [PubMed] [Google Scholar]
- 13.Hanley KA. The double-edged sword: How evolution can make or break a live-attenuated virus vaccine. Evolution (N Y) 2011;4(4):635–643. doi: 10.1007/s12052-011-0365-y. [DOI] [PMC free article] [PubMed] [Google Scholar]
- 14.Bull JJ. Evolutionary reversion of live viral vaccines: Can genetic engineering subdue it? Virus Evol. 2015;1(1):vev005. doi: 10.1093/ve/vev005. [DOI] [PMC free article] [PubMed] [Google Scholar]
- 15.Burns CC, et al. Modulation of poliovirus replicative fitness in HeLa cells by deoptimization of synonymous codon usage in the capsid region. J Virol. 2006;80(7):3259–3272. doi: 10.1128/JVI.80.7.3259-3272.2006. [DOI] [PMC free article] [PubMed] [Google Scholar]
- 16.Mueller S, Papamichail D, Coleman JR, Skiena S, Wimmer E. Reduction of the rate of poliovirus protein synthesis through large-scale codon deoptimization causes attenuation of viral virulence by lowering specific infectivity. J Virol. 2006;80(19):9687–9696. doi: 10.1128/JVI.00738-06. [DOI] [PMC free article] [PubMed] [Google Scholar]
- 17.Bull JJ, Molineux IJ, Wilke CO. Slow fitness recovery in a codon-modified viral genome. Mol Biol Evol. 2012;29(10):2997–3004. doi: 10.1093/molbev/mss119. [DOI] [PMC free article] [PubMed] [Google Scholar]
- 18.Nougairede A, et al. Random codon re-encoding induces stable reduction of replicative fitness of Chikungunya virus in primate and mosquito cells. PLoS Pathog. 2013;9(2):e1003172. doi: 10.1371/journal.ppat.1003172. [DOI] [PMC free article] [PubMed] [Google Scholar]
- 19.Vabret N, et al. Large-scale nucleotide optimization of simian immunodeficiency virus reduces its capacity to stimulate type I interferon in vitro. J Virol. 2014;88(8):4161–4172. doi: 10.1128/JVI.03223-13. [DOI] [PMC free article] [PubMed] [Google Scholar]
- 20.Meng J, Lee S, Hotard AL, Moore ML. Refining the balance of attenuation and immunogenicity of respiratory syncytial virus by targeted codon deoptimization of virulence genes. MBio. 2014;5(5):e01704–e01714. doi: 10.1128/mBio.01704-14. [DOI] [PMC free article] [PubMed] [Google Scholar]
- 21.Ni YY, et al. Computer-aided codon-pairs deoptimization of the major envelope GP5 gene attenuates porcine reproductive and respiratory syndrome virus. Virology. 2014;450-451:132–139. doi: 10.1016/j.virol.2013.12.009. [DOI] [PubMed] [Google Scholar]
- 22.Le Nouën C, et al. Attenuation of human respiratory syncytial virus by genome-scale codon-pair deoptimization. Proc Natl Acad Sci USA. 2014;111(36):13169–13174. doi: 10.1073/pnas.1411290111. [DOI] [PMC free article] [PubMed] [Google Scholar]
- 23.White MD, Bosio CM, Duplantis BN, Nano FE. Human body temperature and new approaches to constructing temperature-sensitive bacterial vaccines. Cell Mol Life Sci. 2011;68(18):3019–3031. doi: 10.1007/s00018-011-0734-2. [DOI] [PMC free article] [PubMed] [Google Scholar]
- 24.Nielsen R. Molecular signatures of natural selection. Annu Rev Genet. 2005;39:197–218. doi: 10.1146/annurev.genet.39.073003.112420. [DOI] [PubMed] [Google Scholar]
- 25.Fearns R, Collins PL. Role of the M2-1 transcription antitermination protein of respiratory syncytial virus in sequential transcription. J Virol. 1999;73(7):5852–5864. doi: 10.1128/jvi.73.7.5852-5864.1999. [DOI] [PMC free article] [PubMed] [Google Scholar]
- 26.Tanner SJ, et al. Crystal structure of the essential transcription antiterminator M2-1 protein of human respiratory syncytial virus and implications of its phosphorylation. Proc Natl Acad Sci USA. 2014;111(4):1580–1585. doi: 10.1073/pnas.1317262111. [DOI] [PMC free article] [PubMed] [Google Scholar]
- 27.Tran TL, et al. The respiratory syncytial virus M2-1 protein forms tetramers and interacts with RNA and P in a competitive manner. J Virol. 2009;83(13):6363–6374. doi: 10.1128/JVI.00335-09. [DOI] [PMC free article] [PubMed] [Google Scholar]
- 28.Blondot ML, et al. Structure and functional analysis of the RNA- and viral phosphoprotein-binding domain of respiratory syncytial virus M2-1 protein. PLoS Pathog. 2012;8(5):e1002734. doi: 10.1371/journal.ppat.1002734. [DOI] [PMC free article] [PubMed] [Google Scholar]
- 29.Mason SW, et al. Interaction between human respiratory syncytial virus (RSV) M2-1 and P proteins is required for reconstitution of M2-1-dependent RSV minigenome activity. J Virol. 2003;77(19):10670–10676. doi: 10.1128/JVI.77.19.10670-10676.2003. [DOI] [PMC free article] [PubMed] [Google Scholar]
- 30.Chapman MA, et al. Initial genome sequencing and analysis of multiple myeloma. Nature. 2011;471(7339):467–472. doi: 10.1038/nature09837. [DOI] [PMC free article] [PubMed] [Google Scholar]
- 31.Bukreyev A, Belyakov IM, Berzofsky JA, Murphy BR, Collins PL. Granulocyte-macrophage colony-stimulating factor expressed by recombinant respiratory syncytial virus attenuates viral replication and increases the level of pulmonary antigen-presenting cells. J Virol. 2001;75(24):12128–12140. doi: 10.1128/JVI.75.24.12128-12140.2001. [DOI] [PMC free article] [PubMed] [Google Scholar]
- 32.Humphrey W, Dalke A, Schulten K. VMD: Visual molecular dynamics. J Mol Graph. 1996;14(1):33–38. doi: 10.1016/0263-7855(96)00018-5. [DOI] [PubMed] [Google Scholar]
- 33.Phillips JC, et al. Scalable molecular dynamics with NAMD. J Comput Chem. 2005;26(16):1781–1802. doi: 10.1002/jcc.20289. [DOI] [PMC free article] [PubMed] [Google Scholar]
- 34.Brooks BR, et al. CHARMM: The biomolecular simulation program. J Comput Chem. 2009;30(10):1545–1614. doi: 10.1002/jcc.21287. [DOI] [PMC free article] [PubMed] [Google Scholar]


