Abstract
Introduction:
One of the most important complications of post-transplant is rejection. Analyzing survival is one of the areas of medical prognosis and data mining, as an effective approach, has the capacity of analyzing and estimating outcomes in advance through discovering appropriate models among data. The present study aims at comparing the effectiveness of C5.0 algorithms, neural network and C&RTree to predict kidney transplant survival before transplant.
Method:
To detect factors effective in predicting transplant survival, information needs analysis was performed via a researcher-made questionnaire. A checklist was prepared and data of 513 kidney disease patient files were extracted from Sina Urology Research Center. Following CRISP methodology for data mining, IBM SPSS Modeler 14.2, C5.0, C&RTree algorithms and neural network were used.
Results:
Body Mass Index (BMI), cause of renal dysfunction and duration of dialysis were evaluated in all three models as the most effective factors in transplant survival. C5.0 algorithm with the highest validity (96.77%) was the first in estimating kidney transplant survival in patients followed by C&RTree (83.7%) and neural network (79.5%) models.
Conclusion:
Among the three models, C5.0 algorithm was the top model with high validity that confirms its strength in predicting survival. The most effective kidney transplant survival factors were detected in this study; therefore, duration of transplant survival (year) can be determined considering the regulations set for a new sample with specific characteristics.
Keywords: data mining, survival, kidney transplantation, C5.0 algorithm, C&RTree algorithm, neural network algorithm, CRISP methodology
1. INTRODUCTION
Chronic kidney disease (CKD) refers to a stage in which performance of kidneys is less than 50% of their normal performance and when this reaches no more than 10%-15%, the patient is referred to as ESRD (End Stage Renal Disease). In the latter, kidney transplant or dialysis (hemodialysis or peritoneal dialysis) would be necessary (1). The prevalence of renal dysfunction in Iran is estimated at 360/1,000,000. The number of ESRD patients under treatment in Iran in 2009 was approximately 24,000; however, studies show that the number is growing (2, 3).
According to the data provided by Transplant & Special Diseases Management Center, the number of ESRD patients under alternative renal treatment in Iran in 2006 reached 25,000 (of the total 70m) and considering the annual 12% growth trend, it is expected to reach 40,000 in 2011. The annual ESRD prevalence and incidence were 357 and 57 cases per 1m, respectively (4). In early 2014, the number of advanced CKD patients under an alternative treatment in Iran reached 50,000 (5). Kidney Transplantation or Renal Transplantation refers to using the kidney of one person for another due to which the patient releases from dialysis restriction and reversible uremia manifestations. Based on the analysis on WHO data (2008) on 104 countries representing 90% of all transplantations across the world, about 100800 organ transplants are performed and there are 69,400 cases of renal transplantations (over 68% of all transplants in the world) (46% from live donors) (6). It can be said that renal transplantation is the treatment of choice for ESRD patients (7). Donors are selected based on success rate predictions of transplantation. However, despite all considerations, complications like rejection, acute tubular necrosis, surgical complications, infectious diseases and kidney drug poisoning threaten the chance of survival in transplantation (8).
One of the data categories desired by researchers is the duration of events like mortality; i.e. attending to a group of people in a manner that after some time, a specific point of time called “failure or accident” can be defined for every individual. Since this was previously used for mortality studies exclusively and was designed for this and it was called “survival time analysis” (9).
Considering the fast growth in size and number of databases, knowledge, regulation or high-level information discovery from database to maintain decision making and predict future behaviors seems necessary (10); so many organizations are practicing data mining (11). Data mining, automatic search for large data sources, is performed to find models and attachments which cannot be obtained through simple statistical analyses (12). The process tries to discover unknown relationships and appropriate models of data and is known as an effective method of discovering information from data (13). In fact, data mining is a specific step in Knowledge Discovery in Databases (KDD) including the application of particular algorithms for extracting models from data (26-30). Practically, the two major aims of data analyses are prediction and description (13). One of the areas requiring the application of this tool for analyzing extensive data and predictive modeling with new calculation methods is medicine. “Classification” is one of the predictive methods for estimating the rate of occurrence of an event. In computer-based clinical predictive systems, different approaches and algorithms including rule-based reasoning, case-based reasoning and machine learning can be used; machine learning algorithms have been used in many medical and medicine-related areas like Decision Tree, artificial neural network, Support Vector Machine and Bayesian Network. However, for more precise diagnosis and preventing diagnostic errors, artificial neural network and decision tree have been widely used due to their exclusive characteristics (19, 20).
Artificial neural network is one of the most important concepts of machine learning (21). In the last decade, application of artificial neural network techniques has been extensively accepted in medicine and relevant fields (22). Studies have shown that the application of such networks along with specialized clinical diagnosis can slightly reduce diagnostic errors. The neural network uses learning concept for problem solving and Gradient descent methods are widely used (23). Decision trees are used based on decision-making rules for prediction and classification and have several advantages. For example, following the completion of the tree, causes of deduction rules can be easily observed; i.e. decision trees unlike neural networks do not work like a black box and their logic is quite clear. Another advantage of decision trees is providing the possibility of learning more about significant fields. This can lead to creating an appropriate view toward the importance of variables before entering other data mining techniques like neural networks (24).
The present study aims at comparing the three predictive classification models of neural networks, C5.0 and C&R Tree in predicting kidney transplant survival before transplantation.
2. MATERIALS & METHODS
Participants
There were 7 urologists and nephrologists taking part in determining effective parameters in predicting renal transplantation survival for devising a questionnaire and checklist on necessary information of the patients.
Patient files of Sina Hospital Urology Research Center from September 2007 to September 2013 were studied. Incomplete files due to lack of recording full information were excluded in the primary phase of the study. Finally, 513 files of kidney recipients (and donors) were selected as the sample of the study.
Questionnaire
A researcher-made questionnaire was devised for information needs analysis distributed among urologists and nephrologists of Sina Hospital aiming at collecting required data items for predicting kidney transplantation survival.
The questionnaire consists of three sections (total 46 questions) including demographic information (7 questions) and data items required for predicting kidney transplantation survival (39 questions).
Content and face validity of the questionnaire was tested and the validity was confirmed by nephrologists and urologists participating in the study (7 faculties with minimum 3 years of experience). The result was a checklist used for extracting the data. Reliability was also tested using test-retest method; i.e. the questionnaire was re-filled by the subjects after some time and scores obtained from the two tests were examined and the resulting correlation coefficient was 92%. The checklist also had three sections including demographic information, kidney recipient/donor as input variables and kidney transplantation survival as output variables.
Data Gathering
The input factors were 11 classified in three sections. The first section was demographic information including age (years) and sex of donor/recipient; the second part was clinical information of the recipient including causes of ESRD (8 items), type of dialysis (hemodialysis, peritoneal and preemptive dialysis), duration of dialysis (month), panel test (in positive and negative states; negative=0, positive=100, percentage: 0-100); BMI (dividing weight in kilograms by height squared in meters); relationship between kidney donor and recipient (cadaver, related or unrelated).
The information on the third section comprising the model output was gathered through contacting patients asking them about the duration of transplanted kidney survival. After extracting the information from the said fields from all files, the data were entered into an Excel file from the checklist.
Data mining
The three predictive data mining models of neural network, C5.0 Decision Tree and C&RTree were modeled and analyzed using IBM SPSS Modeler 14.2. The data of the database were randomly divided into two parts: 70% (360) for training and 30% (153 cases) for testing.
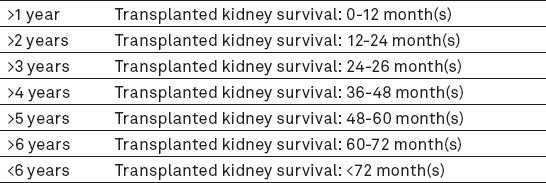
In most cases, raw data are rarely proper for analysis; therefore, they are processed before final analysis using the relevant algorithms. Data preparation is one of the most important and usually most time-consuming phases of data mining projects. After determining the sources of data, the data should be selected, cleaned and put into the proper format (12). After several analyses, a series of the recorded data were omitted due to being incomplete or incorrect. The outlier data were also specified to minimize errors in final results. Also, in some records in which age of the donor was not specified, mean was calculated. Height and weight fields were combined using BMI= Weight(kg)/(Height(m))2 formula and BMI was determined for every recipient to be used in modeling. The Table 1 was obtained after refining the data (the 11 independent variables (input) are demonstrated in Table 1). Also, the independent variable (output variable) has six different outputs including less than 1, 2, 3, 4, 5, 6 year(s) and more than 6 years’ survival (Table 2).
Table 1.
Input data and their type after cleaning
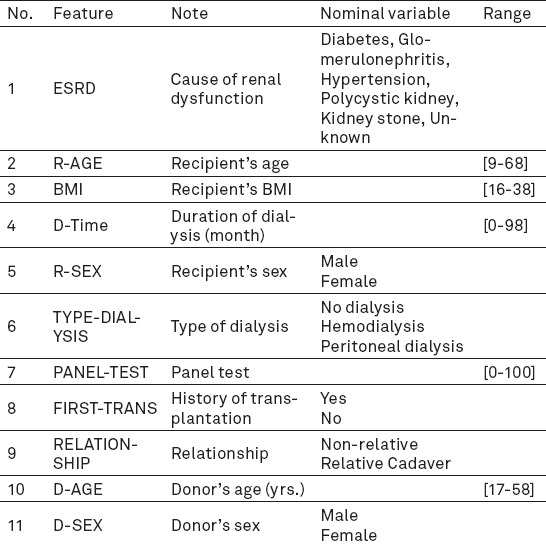
Table 2.
Model’s output group label
By modeling human brain, artificial neural networks can discover the hidden relationship among data, even when non-linear data have many deficiencies or are incomplete (21). There are several algorithms for learning neural networks and multilayer perceptron models are the most popular ones (8, 25-27). In this study, the number of required layers in the network was selected through testing, repeating and comparing the results; the obtained results indicate more precision of the system using double layer networks. The first layer, also called “hidden layer” has some neurons or neural units because in previous studies, the number of hidden layer neurons was very effective in increasing network function (26, 28-35). In the present study, hidden layer neurons of neural network were considered at 1-50 in order to increase the performance of the survival prediction model; network performance with the current topology was calculated with a different number of neurons in the hidden layer and the structure with an 8-neuron topology in one hidden layer was selected. The validity of the reference model was estimated at 79.5% (Figure 1).
Figure 1.
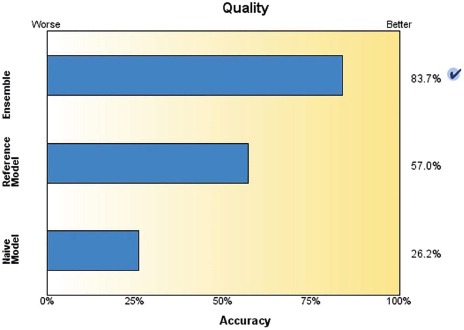
Validity of reference model
Classification and Regression Tree (C&RTree) node is a method of classification and prediction based on the tree. Like C5.0, this method divides educational records into sections with equal output fields. First, the C&RTree node tests input fields for the best result to minimize the gross indicator obtained from analysis. In order to reach the highest accuracy, the model resulting from the decision tree and regression or C&RTree produces 20 C&RTree and combines their relationships to provide the possibility of creating and generating an optimum model via boosting. The accuracy of the boosting and reference models was estimated at 83.7% and 57%, respectively (Figure 2).
Figure 2.

Accuracy of Optimum C&RTree
The C5.0 algorithm was used for making the decision tree or series of rules that it is the modified version of C4.5 and ID3 algorithms acting as a powerful approach for increasing classification precision. This algorithm has a specific method for improving the rate of prediction precision, called “Boosting”. In this study, the survival rate of each case was estimated at 96.77%. This model functions consecutively by making multi-purpose models. The first model is made conventionally. Then, the second model is constructed by focusing on records that are not classified by the first model. The third model is based on the errors of the second on and this goes on. In the end, records are classified based on the series of models and are combined into a single prediction model by valuing the votes (24). A portion of decision making levels of C5.0 is demonstrated in Figure 3. Using this tree, the survival rate of every new transplantation case is estimated at 96.77%.
Figure 3.
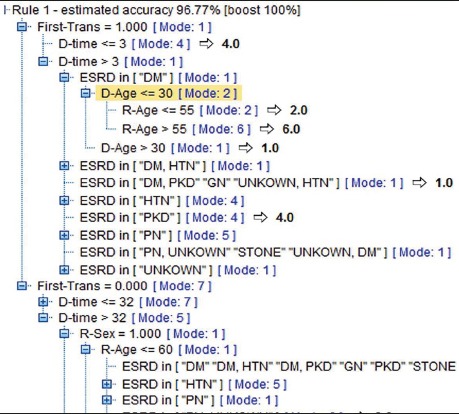
Portion of decision making levels of C5.0 Tree with 96.77% accuracy
Evaluation
Evaluation results improve the model and make it practical. Gains figure is used for evaluating classification models; i.e. a table is designed based in real responses and model predictions and a figure with vertical (real response) and horizontal (model prediction) axis is drawn accordingly. Evaluation results as well as training and testing data are visually displayed.
In order to examine the accuracy of the modes, the data were divided into education (70%) and testing (30%). Models were prepared using the education section’s data; the data of the testing section and a few other records check the models. There are various factors for evaluating the validity of classification methods. Therefore, sensitivity, specificity and accuracy are applied (16, 36, 37).
In the above formula, positive label refers to one of the labels of less than 1, 2, 3, 4, 5, 6 or more than 6 year (s) and negative label includes all series of data, except the positive group label.
3. RESULTS
In the present study, data of 513 kidney recipients (and the same number of donors) were modelled using the three data mining algorithms of neural networks, C5.0 and C&RTree and after entering the data in Table 1, the survival rate of the recipient was predicted in one of the seven output groups (Table 2).
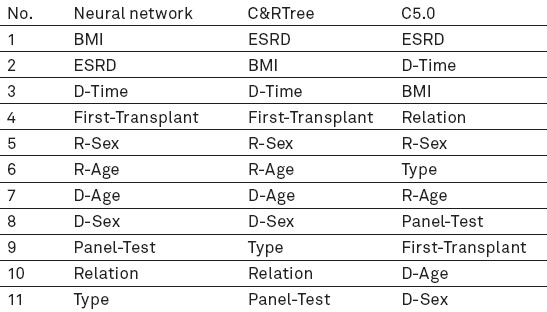
The significance of effective factors in predicting transplantation survival in the three models can be seen in Table 3.
Table 3.
Priority of effective, predictive kidney transplant factors in three models
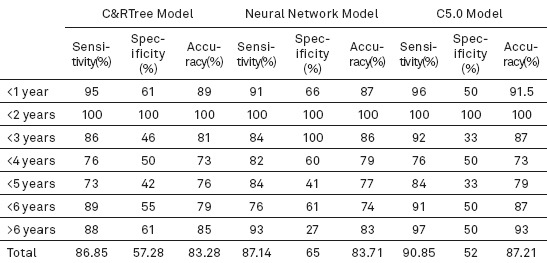
The three predictive models were evaluated according to accuracy, sensitivity and specificity. Confusion matrix was used for calculating the indices. The said matrix is a useful tool for analysing the performance of classification method in determining data or observations of various classifications. If the data is in M category, the table classification method with the minimum size is M*M. It is ideal to have most data associated with observations on the main diameter of matrix and the rest are zero or close to 0 (16, 36, 37). Considering the confusion matrix of the models, sensitivity, specificity and accuracy of each is demonstrated in Table 4.
Table 4.
Calculating sensitivity, specificity and accuracy of model’s testing data
Training data were calculated for each model separately using IBM SPSS Modeler 14.2, taking into account the three factors of sensitivity, specificity and accuracy. The accuracy of C&R Tree and neural network model was estimated at 83.7% and 79.5%, respectively; also, the accuracy of survival rate of each new case was estimated at 96.77% in the C5.0 model.
According to Table 4, the data following testing C&RTree model indicate 86.85% sensitivity, 57.28% specificity and 83.28% accuracy. Moreover, sensitivity, specificity and accuracy of the neural network model are estimated at 87.14%, 65% and 83.71%, respectively. The highest rate of accuracy belonged to the C5.0 model (87.21%) as well as sensitivity and specificity at 90.85% and 52%.
4. DISCUSSION and CONCLUSION
As kidney transplantation is increasing every day in the world and fear of transplantation rejection, high costs and growing number of ESRD patients on the other hand, designing a model for predicting transplantation survival would be a great help leading to increasing survival rates and consequently, decreasing transplantation waiting times and costs.
In the present study, factors affecting kidney transplantation survival are determined through information needs analysis conducted on nephrologists/urologists and a researcher-made questionnaire. After screening the data and omitting incomplete records, modelling was performed using neural network and the two decision making trees of C5.0 and C&RTree and their accuracy, specificity and sensitivity were evaluated and compared.
In the study of Ashrafi et al conducted on 316 kidney transplant patients, demographic information of recipients and donors, type and location of transplant, recipient’s BMI and diabetic status were extracted from patient files and death or transferring patients to dialysis were considered as the end point (38). In order to analyse 10-year survival of transplanted kidney and determining the effective factors, Hassanzadeh et al added cold ischemic time, relation to recipient (relative, non-relative), side of donated kidney, predialysis duration, creatinine level at discharge and duration of hospitalization to the said factors (7). The retrospective study of Hashiani examined the survival rate of kidney transplantation by studying variables like age and sex of donors and recipients (39). The strong point of the present study compared to the previous ones is the method of determining data effective in predicting survival which was conducted scientifically and through questionnaires distributed among nephrologists and urologists. Evaluating a series of factors affecting kidney dysfunction was a determining factor in predicting survival which were not, except one (diabetic status of recipient) taken into account in the study of Ashrafi et al.
In another study conducted by Saleh Nasab et al (39), a checklist was prepared (like the present study), information was extracted from files of kidney patients and modelling was performed based on the information. Although, the said study also aimed at extracting effective models in predicting survival using data mining, some factors like immunosuppressive regimen, cold ischemic time, creatinine level at discharge and duration of hospitalization were ignored due to the difference in the study’s perspective because the aim of the present study is predicting transplantation survival prior to surgery; however, factors similar to this study in the previous ones were post-transplant variables that cannot be considered in this present study.
In the study of Ashrafi, statistical methods of Kaplan–Meier, Cox regression and goodness of fit were compared in the artificial neural network and the neural network model was introduced as the highest one among others with 72% precision (38).
In a study titled “predicting chronic allograft kidney disease using decision making tree” by Lou Faro et al, C4.8 algorithm and laboratory factors if transplant patients were used; the validity of the model was <83% (40). In the same year, Greco et al predicted transplantation survival or rejection using a binary tree at 4 levels’ sensitivity and specificity of the tree were estimated at 88.2% and 73.8%, respectively. In the present study, C5.0 algorithm, the optimized version of C4.8 algorithm was used and the validity of the survival rate of the model in each transplantation case was estimated at 96.7%. On the other hand, the target field, in this study, should be classified; the difference between the recent study and that of Lou Faro and Greco is in the output of the tree. The output in the latter studies was merely failure or success of transplantation but the output of our study was not binary and could express duration of transplantation survival in 6 different conditions (41).
In this study, the three data mining algorithms were compared to estimate transplantation survival in kidney patients; the highest accuracy belonged to C5.0 model (96.77%) followed by C&RTree (83.7%) and neural network model (79.5%).
Evaluating the significance of transplantation survival predicting factors in the present study, cause of kidney dysfunction, BMI and pre-transplant dialysis were determined as the most effective factors that are compatible with the findings of previous studies. By comparing preceding researches in the area of data mining and kidney transplantation survival, it is clear that the C5.0 model offered in our study has the highest accuracy; moreover, another strong point of the study is implementing all phases of knowledge discovery according to CRISP standard that was not mentioned in other studies. On the other hand, in order to facilitate the application of the model, the researchers designed and run a mobile application under android and iOS platforms. Using the said apps, the user can see the predicted survival rate of transplanted kidney in one of the rows of Table 2 after filling out input fields according to Table 1.
Since the findings of our study are obtained from the data of one single hospital, it is suggested that data of different research centres are used and compared for further evaluation of the subject.
Acknowledgement
we would like to thank the personnel of Urology Research Centre of Sina Hospital for their cooperation. We would also like to thank Mrs. Bita Pourmand (Urology Research Centre, Sina Hospital) for translating the article into English and appreciate the guidance and assistance of Dr. Dehghani.
REFERENCES
- 1.Rajabfardi Z, Hatami H, Khodakarim S, S K. Factors associated with end stage renal disease among hemodialysis patients in Tuyserkan City in 2013. Pajouhan Scientific Journal. 2014 [Google Scholar]
- 2.Mahdavi-Mazdeh M. Why do we need chronic kidney disease screening and which way to go. Iran J Kidney Dis. 2010;4(4):275–81. (Persian) [PubMed] [Google Scholar]
- 3.Nedjat S, Montazeri A, Holakouie K, Mohammad K, Majdzadeh R. Quality of life and its measurement. Iranian Journal of Epidemiology. 2008;4(2):57–62. (Persian) [Google Scholar]
- 4.Abbaszadeh S, Nourbala M, Taheri S, Ashraf A, Einollahi B. Renal Transplantation from Deceased Donors in Iran. Saudi Journal of Kidney Diseases and Transplantation. 2008:664–8. (Persian) [PubMed] [Google Scholar]
- 5.Mortazavi N. Bright outlook in dialysis technology in Iran. MED & LAB engineering magazine. 2014;157:75–7. (Persian) [Google Scholar]
- 6.WHO. Transplantation Documentation center http://www.who.int/transplantation/publications/en . Department of Essential Health Technologies (HSS/EHT/CPR)] 2008. [cited 2013 February]. Available from: http://www.who.int/transplantation/gkt/statistics/en/
- 7.Hasan Zadeh J, Salahi H, Rajaei far A, Zeighami B, Hashyani A. 10-year survival analysis of its influencing factors in patients with renal transplantation and transplantation from a living donor transplant center. Namazi Hospital. 2011:28–39. (Persian) [Google Scholar]
- 8.Hagan MT, Demuth HB, Beale MH, De Jesús O. Neural network design. Boston: PWS publishing company; 1996. [Google Scholar]
- 9.ET L. Statistical methods for survival data mining. 2nd ed. New York: John Wiley Sons Inc; 1992. [Google Scholar]
- 10.Tan PN, Steinbach M, Kumar V. Introduction to data mining. Boston: Pearson Addison Wesley; 2006. [Google Scholar]
- 11.Moghadasi H, Hoseini A, Asadi F, Jahanbakhsh M. Data mining and its application in health. Health Information Management. 2012 (Persian) [Google Scholar]
- 12.Hassanzadeh M, Razavi Ebrahimi A. Comparison Classificaion of Data Mining Algorithms in Medical Sciences. Iranian Journal of Medical Informatics. 2012;2(2) (Persian) [Google Scholar]
- 13.Jalali M, Bozorgnia A. Clustering analysis based on the data mining process and verify the data mining software WEKA. Student Statistical Journal. 2010;7:18–22. (Persian) [Google Scholar]
- 14.Mitra STA. Data Mining: Multimedia, Soft Computing and Bioinformatics. 1nd ed. New Jersey: John Wiley & Sons; 2003. [Google Scholar]
- 15.Cios KJ, Pedrycz W, Swiniarsk RA. KL. Data Mining: A Knowledge Discovery Approach. 1nd ed. New York: Springer Science+Business Media, LLC; 2007. [Google Scholar]
- 16.Han J, Kamber M. Data Mining: Concepts and Techniques. 2nd ed. San Francisco: Morgan Kaufman; 2001. [Google Scholar]
- 17.Pal NR, L J. Advanced Techniques in Knowledge Discovery and Data Mining. 1nd ed. New York: Springer Science+Business Media; 2004. [Google Scholar]
- 18.Ohsuga L, L H . Foundations and Novel Approaches in Data Mining. 1nd ed. New York: Springer Science+Business Media; 2005. [Google Scholar]
- 19.Shortliffe EH, Cimino JJ. Biomedical informatics: computer applications in health care and biomedicine. Springer Science & Business Media; 2013. [Google Scholar]
- 20.Hayward J. Machine learning of clinical performance in a pancreatic cancer database. Artificial Intelligence in Medicine. 2010;49:187–95. doi: 10.1016/j.artmed.2010.04.009. [DOI] [PubMed] [Google Scholar]
- 21.Haykin S, NJ . Neural networks: a comprehensive foundation: Prentice Hall PTR Upper Saddle River,. NJ, editor. USA: 1998. [Google Scholar]
- 22.Paulo J. Lisboa a AFGT. The use of artificial neural networks in decision support in cancer: A systematic review. Neural Networks. 2006;19:408–15. doi: 10.1016/j.neunet.2005.10.007. [DOI] [PubMed] [Google Scholar]
- 23.Yanong Zhu SW, Reyer Zwiggelaar. Computer technology in detection and staging of prostate carcinoma: A review. Medical Image Analysis. 2006;10:178–99. doi: 10.1016/j.media.2005.06.003. [DOI] [PubMed] [Google Scholar]
- 24.Alizadeh S, Malek Mohamadi S. Data Mining & Knowledge Discovery Step by Step with Clementine. Tehran, Iran: Khajeh Nasir University; 2014. (Persian) [Google Scholar]
- 25.Gupta M, JLaHN . Static and Dynamic Neural Networks: From Fundamental to Advanced Theory. John Wiley & Sons Inc; 2003. [Google Scholar]
- 26.Haykin S. Neural networks: a comprehensive foundation. NJ, USA: Prentice Hall PTR Upper Saddle River; 1994. [Google Scholar]
- 27.Battiti R. First and second order methods for learning: Between steepest descent and Newton’s method. Neural Computation. 1992;4(2):141–66. [Google Scholar]
- 28.Murat Çınar ME EZE Y, Ziya Ates çi. Early prostate cancer diagnosis by using artificial neural networks and support vector machines. Expert Systems with Applications. 2006;36:6357–61. [Google Scholar]
- 29.Anagnostou T, Remzi M, Lykourinas M. Artificial Neural Networks for decision-making in urologic oncology. European Urology. 2003;43:596–603. doi: 10.1016/s0302-2838(03)00133-7. [DOI] [PubMed] [Google Scholar]
- 30.Bishop CM. Neural networks for pattern recognition. Oxford university press; 1995. [Google Scholar]
- 31.Cookson MS, Aus G, Burnett ALea. Variation in the definition of biochemical recurrence in patients treated for localized prostate cancer: the American Urological Association Prostate Guidelines for Localized Prostate Cancer Update Panel report and recommendations for a standard in the reporting of surgical outcomes. The Journal of urology. 2007;177(2):540–5. doi: 10.1016/j.juro.2006.10.097. [DOI] [PubMed] [Google Scholar]
- 32.Fausett L. Fundamentals of Neural Networks: Architectures, Algorithms, and Applications. NJ, USA: Prentice-Hall, Inc., Upper Saddle River; 1994. [Google Scholar]
- 33.Hagan M, M. B M Training feedforward networks with the Marquardt algorithm. IEEE Transactions on Neural Networks. 1994;5(6):989. doi: 10.1109/72.329697. [DOI] [PubMed] [Google Scholar]
- 34.MathWoks I, Matlab. Neural Networks Toolbox, V.7.14.0.739. MATH. 2012 [Google Scholar]
- 35.Saritas IO, Ilker Ali Sert, Ibrahim Unal. Prognosis of prostate cancer by artificial neural networks. Expert Systems with Applications. 2010;37(9):6646–50. [Google Scholar]
- 36.Alizadeh S, Ghazanfari M. Data Mining and Knowledge Discovery. 2nd ed. Tehran Iran: Iran University of Science and Technology; 2011. (Persian) [Google Scholar]
- 37.Ameri H, Alizadeh S, Barzegari A. Knowledge Extraction of Diabetics’ Data by Decision Tree Method. Journal of Health Administration. 2013;16(53):58–72. [Google Scholar]
- 38.Ashrafi M, Hamidi Beheshti M, Shahidi Sh, Ashrafi F. Application of artificial neural network to predict graft survival after kidney transplantation: Reports of 22 years follow up of 316 patients in Isfahan. Tehran University Medical Journal. 2009;67(5):353–9. [Google Scholar]
- 39.Hashiani AA, Rajaeefard A, Hassanzade J, Salahi H. Survival analysis of renal transplantation and its relationship with age and sex. Koomesh. 2010;11(4):302–7. [Google Scholar]
- 40.Lofaro D, Maestripieri S, Greco R, Papalia T, Mancuco D, Conforti D, et al. Prediction of Chronic Allograft Nephropathy Using Classification Trees. Elsevier; 2010. [DOI] [PubMed] [Google Scholar]
- 41.Greco R, Papalia T, Lofaro D, Maestripieri S, Mancuso D, Bonofiglio R. Decisional trees in renal transplant follow-up. Transplantation proceedings. 4. Vol. 42. Elsevier; 2010. May 31, pp. 1134–36. [DOI] [PubMed] [Google Scholar]


