

Abstract
During natural vision, humans make frequent eye movements but perceive a stable visual world. It is therefore likely that the human visual system contains representations of the visual world that are invariant to eye movements. Here we present an experiment designed to identify visual areas that might contain eye-movement-invariant representations. We used functional MRI to record brain activity from four human subjects who watched natural movies. In one condition subjects were required to fixate steadily, and in the other they were allowed to freely make voluntary eye movements. The movies used in each condition were identical. We reasoned that the brain activity recorded in a visual area that is invariant to eye movement should be similar under fixation and free viewing conditions. In contrast, activity in a visual area that is sensitive to eye movement should differ between fixation and free viewing. We therefore measured the similarity of brain activity across repeated presentations of the same movie within the fixation condition, and separately between the fixation and free viewing conditions. The ratio of these measures was used to determine which brain areas are most likely to contain eye movement-invariant representations. We found that voxels located in early visual areas are strongly affected by eye movements, while voxels in ventral temporal areas are only weakly affected by eye movements. These results suggest that the ventral temporal visual areas contain a stable representation of the visual world that is invariant to eye movements made during natural vision.
Keywords: eye movements, visual perception, natural movies, fMRI
Introduction
During natural vision, humans make rapid saccadic eye movements in order to foveate points of interest, and they use smooth pursuit to track moving objects (Yarbus, 1967). These eye movements bring stimuli of interest into the fovea, where they can be processed with high resolution (Curcio, Sloan, Kalina, & Hendrickson, 1990), and have substantial effects on the way that visual neurons encode information (Gallant, Connor, & Van Essen, 1998; Mazer & Gallant, 2003; Vinje & Gallant, 2000). However, they present a real problem for the visual system: Eye movements complicate object and motion detection as well as the formation of a stable internal representation of the external world. Therefore, it has long been believed that the human visual system must have evolved specific mechanisms that compensate for eye movements (Melcher, 2011; Melcher & Colby, 2008), and that some visual areas must contain representations of the external world that are invariant to eye movements (Duhamel, Bremmer, Ben Hamed, & Graf, 1997; Duhamel, Colby, & Goldberg, 1992).
Several recent studies have recorded blood-oxygen-level-dependent (BOLD) signals during free viewing of natural movies and found that many brain areas respond similarly across repeated presentations (Bartels & Zeki, 2004; Hasson, Malach, & Heeger, 2010; Hasson, Nir, Levy, Fuhrmann, & Malach, 2004). However, the evidence in those studies was not sufficient to identify eye movement-invariant representations. For example, if subjects made similar eye movements on different trials, then similar responses might be observed across repetitions even in visual areas that are not eye movement-invariant (Hasson et al., 2010). Conversely, differences in noise level or the amount of variance of BOLD signals across visual areas explainable by visual stimulus (Huth, Nishimoto, Vu, & Gallant, 2012; Kay, Naselaris, Prenger, & Gallant, 2008) would make it difficult to identify eye movement-invariant areas.
To see how we might identify eye movement-invariant visual areas, consider two experimental conditions (Figure 1). In the first, brain activity is measured while a subject fixates steadily on a natural movie. If the movie is repeated several times while fixation is maintained, then activity throughout the visual system should be similar across repetitions. (However, similarity will be limited by the quality of fixation, the resolution of spatial measurements, the intrinsic reliability of brain activity, and any processes of adaptation that might occur after repeated viewing of a single movie.) In the second condition, activity is measured while the subject freely views the movie using natural eye movements. If responses are affected by eye movements, then brain activity measured during free viewing will be different from that measured during fixation. On the other hand, if responses are invariant to eye movements, then brain activity measured during free viewing will be similar to that measured during fixation (though once again limited by the factors just listed). This logic suggests that it should be possible to identify brain areas that are eye movement-invariant by examining the similarity of responses across repeated fixation trials and comparing this correlation to the similarity of responses obtained between fixation and free viewing conditions that used the same movies as visual stimuli. The sensitivity of this metric will depend on the intrinsic variability of brain activity across repeats, but this can be accounted for by including information about the reliability of responses across repeats.
Figure 1.

Overview of experimental strategy. (Left) Human subjects watched identical 180-s natural movies while fixating and while freely viewing movies with natural eye movements. Movies were shown 10 times in each condition. Whole-brain functional activity was measured using BOLD functional MRI. BOLD responses were compared across repeats in the fixation condition (Vfixation) and across single trials between the fixation and free viewing conditions (Vcross). (Right) If the responses of a voxel are affected by eye movements, then Vfixation should be high and Vcross should be low. If the responses of a voxel are eye movement-invariant, then Vfixation and Vcross should be similar.
To identify brain areas that are invariant to eye movements, we therefore recorded BOLD functional MRI (fMRI) signals from four human subjects while they watched natural movies under two different conditions (Figure 1): during steady fixation, and during free viewing with voluntary eye movements. For each recorded voxel, we measured reliability of responses across repeated presentations of the movie during fixation, and separately measured the similarity of responses across each individual fixation trial and each individual free viewing trial. The ratio of these two measures indicates the degree of eye movement-invariance in each individual voxel across the entire visual hierarchy.
Methods
MRI data collection
MRI data were collected on a 3T Siemens TIM Trio scanner equipped with a 32-channel Siemens volume coil, located at the UC Berkeley Brain Imaging Center. Functional scans were collected using a gradient-echo echo-planar imaging sequence with repetition time = 2 s, echo time = 31 or 35 ms, flip angle = 70°, voxel size = 2.24 × 2.24 × 4.1 mm (including 10% slice gap), matrix size = 100 × 100, and field of view = 224 × 224 mm. To cover the entire brain, 30 to 32 axial slices were prescribed. A custom-modified water-excitation radio-frequency pulse was used to avoid signal from fat.
Anatomical data for subjects S2, S3, and S4 were collected using a T1-weighted magnetization-prepared rapid gradient-echo sequence on the same 3T scanner used to collect functional data. Anatomical data for subject S1 were obtained using a 1.5T Philips Eclipse scanner as described in an earlier publication (Hansen, Kay, & Gallant, 2007).
Subjects and tasks
Functional data were collected from four human subjects (age range: 25–34 years). All subjects were healthy and had normal or corrected-to-normal vision. The experimental protocol was approved by the Committee for the Protection of Human Subjects at the University of California, Berkeley.
During the fixation condition, subjects fixated at a small square (4 × 4 pixels, 0.16°) superimposed on the movie and located at the center of the screen. The color of the fixation spot changed three times per second to ensure that it was visible regardless of the color of the movie. During the free viewing condition, subjects made natural saccadic and smooth-pursuit eye movements under volitional control. The functional scans for these two conditions were performed in separate sessions.
Eye movements made during the free viewing condition were monitored using a ViewPoint EyeTracker (Arrington Research Inc., Scottsdale, AZ). Calibration revealed that the standard error of the eye-position estimates for this device is ∼0.3°. Eye movements during the fixation condition were not monitored. However, all subjects were highly experienced psychophysical observers who had previously spent many hours in the MRI scanner performing fixation tasks similar to those reported here (Huth et al., 2012; Nishimoto et al., 2011; see the Discussion for further information about the potential effects of eye movements in the fixation and free viewing conditions.)
Movie stimuli
Color natural movies were drawn from the Apple QuickTime HD gallery (http://www.apple.com/quicktime/guide/hd/) and YouTube (http://www.youtube.com). The original high-definition movies were cropped to a square and then spatially down-sampled to 512 × 512 pixels. Movies were then clipped to 10–20 s in length, and a composite movie was created by randomly drawing 12 movies from the entire set. Movies were displayed using a long-throw Avotec LCD projector system (Avotec Inc., Stuart, FL).
Each subject watched a total of 180 s of natural movies (24° × 24° at 15 Hz) on the gray (mean luminance) background 10 times each in both fixation and free viewing conditions. The movies were shown in six separate 10-min scan sessions. Of these, three sessions were used for the fixation condition and three were used for the free viewing condition. Thus, each condition included a total of 30 min of movies, and the movies themselves were identical across the conditions.
Functional localizers
Retinotopic localizer
Retinotopic maps were collected in four 9-min scans. Two scans used clockwise and counterclockwise rotating polar wedges, and two used expanding and contracting rings. Details about this procedure can be found in an earlier publication (Hansen et al., 2007).
Area MT+ localizer
Area MT+ localizers were collected in four 90-s scans consisting of alternating 16-s blocks that contained both continuous and temporally scrambled natural movies. Area MT+ was defined as a contiguous region anterior to the early visual cortex that showed significantly higher activation to continuous compared to temporally scrambled movies.
Visual-category localizers
Visual-category localizers were collected in six 4.5-min scans consisting of 16 blocks, each 16 s long. Each block consisted of 20 images drawn from one of several categories: places, faces, human body parts, nonhuman animals, household objects, and spatially scrambled household objects. Each image was displayed for 300 ms followed by a 500-ms blank. To control for attention, a one-back task was used; the same image was occasionally displayed twice in a row, and subjects had to press a button to indicate when this occurred. These localizers were used to define brain areas that are selective for places (parahippocampal place area [PPA], Epstein & Kanwisher, 1998), faces (fusiform face area [FFA], Kanwisher, McDermott, & Chun, 1997), body parts (extrastriate body area [EBA], Downing, Jiang, Shuman, & Kanwisher, 2001) and objects (lateral occipital complex).
Nonvisual localizers
In order to visualize cortical functional organization, we also localized and plotted nonvisual areas (auditory cortex, primary somatosensory cortex, and primary motor cortex). Details are described elsewhere (Huth et al., 2012).
fMRI data preprocessing
Each functional run was motion-corrected using the FMRIB Linear Image Registration Tool found in the FMRIB Software Library (Jenkinson & Smith, 2001). All volumes in the run were then averaged to obtain a high-quality template volume for that run. The tool was also used to automatically align the template volume for each run to the overall template, which was chosen to be the template for the first functional movie run for each subject. These automatic alignments were manually checked and adjusted for accuracy. The cross-run transformation matrix was then concatenated to the motion-correction transformation matrices, and the concatenated transformation was used to resample the original data directly into the overall template space.
Low-frequency voxel response drift was identified using a median filter with a 120-s window, and this was subtracted from the signal. The mean response for each voxel was then subtracted, and the remaining response scaled to have unit variance.
Flattened map construction
Cortical surface meshes were generated from the T1-weighted anatomical scans using Caret5 software (Van Essen, Drury, Dickson, Harwell, Hanlon, & Anderson, 2001). Five relaxation cuts were made into the surface of each sphere, and the medial wall was removed. The calcarine-sulcus cut was made at the horizontal meridian in V1 using retinotopic mapping data as a guide. Surfaces were then flattened using Caret5. Functional data were aligned to the anatomical data for surface projection using custom software written in MATLAB (MathWorks, Natick, MA).
Eye movement-invariance ration
For each voxel, we first estimated the similarity of responses obtained in the fixation condition. We expressed similarity in terms of the average explained variance (R2) according to the following formula:
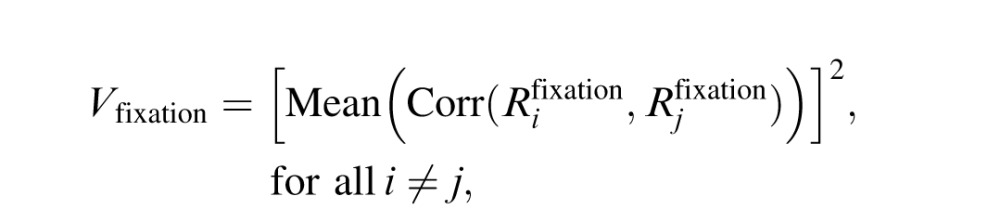 |
where  represents the BOLD-signal time course for the ith fixation trial (i = 1, …, 10). The square brackets denote a half-wave rectification (i.e., negative correlations were truncated to zero). Because we aim to focus on visually responsive voxels, we selected for further analysis voxels that show significant reproducibility in terms of Vfixation (p < 0.0001, uncorrected). To further examine if our measures of explained variance result from spurious stimulus effects (e.g., peripheral borders or spurious retinal motion), we split the BOLD signals in two separate sets randomly for 100 permutations and measured the within-class correlations. The R2 values for the resampled signals were very low, and we did not observe any notable clusters of significant voxels. This control analysis confirms that our measures of explained variance reflect representations of the movie contents.
Next we estimated the proportion of response variance shared across the fixation and free viewing conditions:
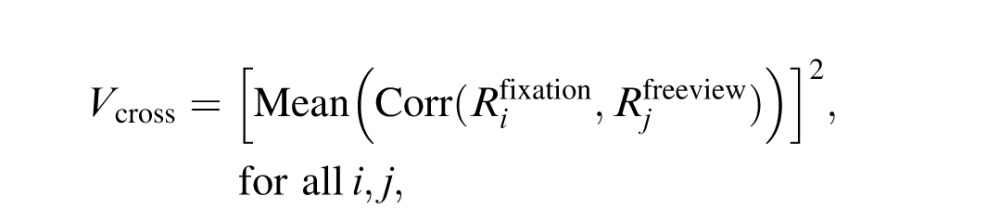 |
where  represents the BOLD-signal time course for the ith free viewing trial.
Finally, we used these figures to obtain an eye-movement invariance ratio (EMIR):
 .
.
|
For a small minority of voxels that show EMIR > 2.0, we truncated the value to 2.0 in order to stabilize the calculation.
Results
To ensure that fixation data are reliable, we first examined the similarity of voxel responses recorded on different repeats of the fixation condition. The across-repeats/within-condition correlations were calculated individually for each voxel in each subject, and these values were plotted on flattened cortical maps (Figure 2A). Next, we assessed similarity of voxel responses between the fixation and free viewing conditions. The across-repeats/across-conditions correlations were calculated for each voxel in each subject, and these were also plotted on flattened cortical maps (Figure 2B). Comparison of Figure 2A and 2B suggests that response similarity within the fixation condition is higher than the similarity between fixation and free-viewing conditions in early visual areas V1, V2, V3, and V4. In contrast, response similarity between fixation and free viewing conditions is much higher in ventral temporal visual areas FFA, EBA, and hMT+. Thus, these maps suggest that eye movements affect visual responses in early visual areas but that higher visual areas are relatively eye movement-invariant.
Figure 2.
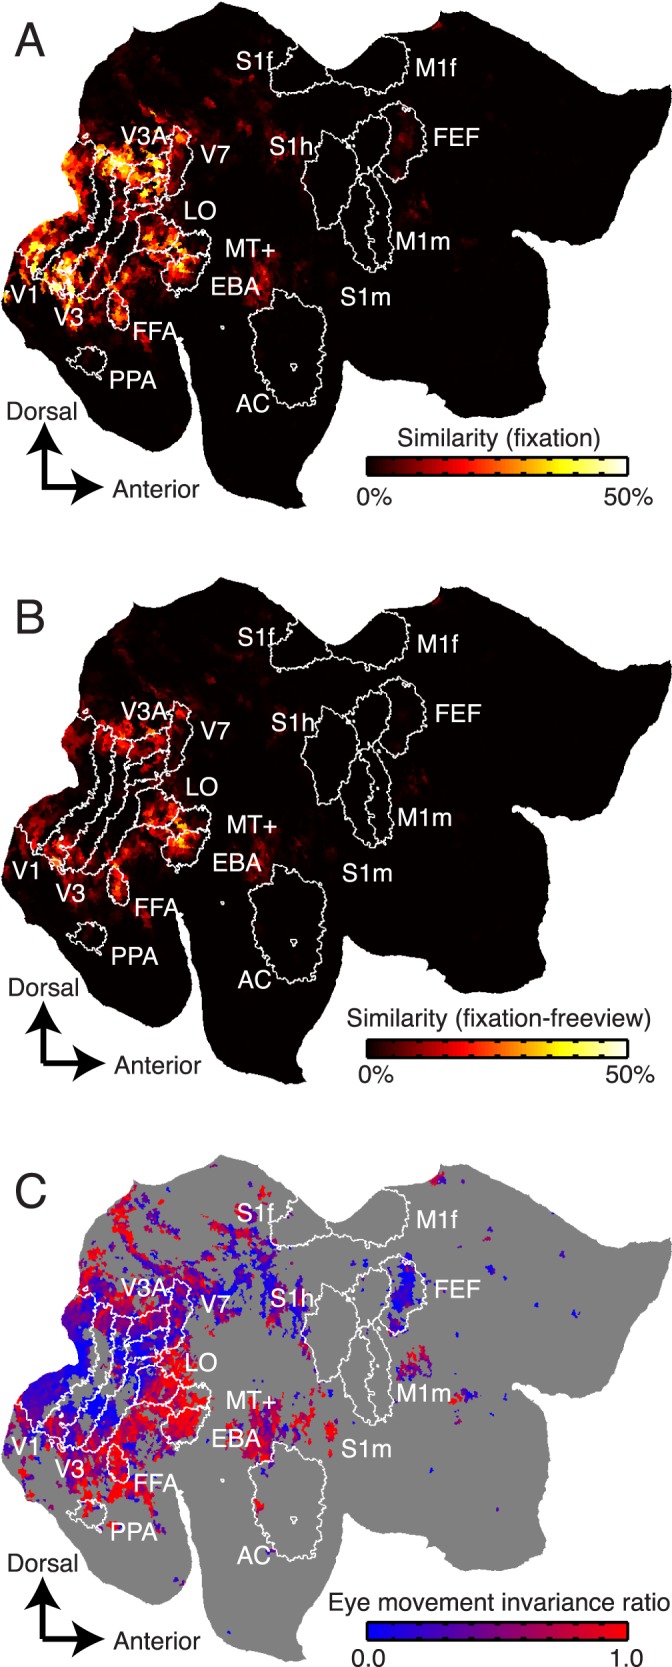
Response similarity measures for voxels projected onto a flattened map of the right hemisphere. (A) Similarity of voxel responses (R2) across single presentations of the movie during steady fixation. Responses of voxels shown in black are relatively less similar across repeats, and those in hot colors are relatively more similar. The white contours show boundaries of functional brain areas identified using conventional functional localizers. Responses of voxels in many visual areas are similar across fixation trials. (B) Similarity of voxel responses between single presentations in the fixation condition and single presentations in the free viewing condition. Responses of voxels located in early visual areas V1–V4 are much less similar between single trials drawn from separate conditions than they are in (A). However, responses in higher visual areas (MT+, FFA, and EBA) tend to be similar between fixation and free viewing. (C) EMIR. Voxels located in early visual areas (V1, V2, V3, and V4) tend to have relatively low EMIRs, indicating that their responses are affected by eye movements. Voxels located in higher visual areas (MT+, FFA, PPA, EBA) tend to have higher EMIRs, indicating that their responses are eye movement-invariant. Voxels that had unreliable visual responses during fixation (p > 0.0001, uncorrected) are shown in gray and are omitted from subsequent analysis.
To quantify eye movement-invariance in each voxel individually, we computed the ratio of across-condition response correlations and within-fixation-condition response correlations. We call this quantity the eye movement-invariance ratio. If a given voxel is modulated by eye movements, then responses within the fixation condition will be more similar than those between fixation and free viewing conditions, and the EMIR will be close to 0. However, if the voxel is eye-movement invariant, then responses within the fixation condition will be similar to those between the two conditions and the EMIR will be close to 1. Figure 2C shows EMIR plotted as in Figure 2A and 2B. Voxels in early visual areas (V1, V2, V3, and V4) tend to have low EMIR, and those in ventral temporal visual areas (FFA, EBA, and hMT+) tend to have high EMIR. Figure 3 shows EMIR plotted for all four subjects and hemispheres.
Figure 3.

EMIR for all four subjects and hemispheres. The format is the same as in Figure 2C.
To summarize the degree of eye movement-invariance in each specific brain area, we averaged the EMIRs obtained for all voxels in several common visual regions of interest separately for each individual subject (Figure 4A through D), and then aggregated these data across subjects (Figure 4E). The aggregate data show that visual areas V1, V2, and V3 have average EMIRs of 0.35, 0.39, and 0.36, respectively. This value indicates that only about 35%–40% of the response variance in these areas that can be explained by visual stimuli (David & Gallant, 2005) is shared between fixation and free viewing conditions. In contrast, ventral temporal areas PPA, MT+, FFA, and EBA have average EMIRs of 0.81, 0.88, 0.93, and 0.84, respectively. Therefore, it appears that more than 80% of the explainable response variance in these areas is shared between fixation and free viewing conditions. Thus, these higher visual areas appear to be relatively eye movement-invariant. The average EMIR values for intermediate areas V3A, V3B, V4, V7, and lateral occipital complex are 0.52, 0.32, 0.38, 0.48, and 0.57, respectively. The intermediate values in and around the parietal lobe (V3A and V7) are consistent with previous studies that show spatially invariant activity around the parietal cortex (Burgess 2008; Duhamel et al., 1997; Galletti, Battaglini, & Fattori, 1993; Pertzov, Avidan, & Zohary, 2011).
Figure 4.
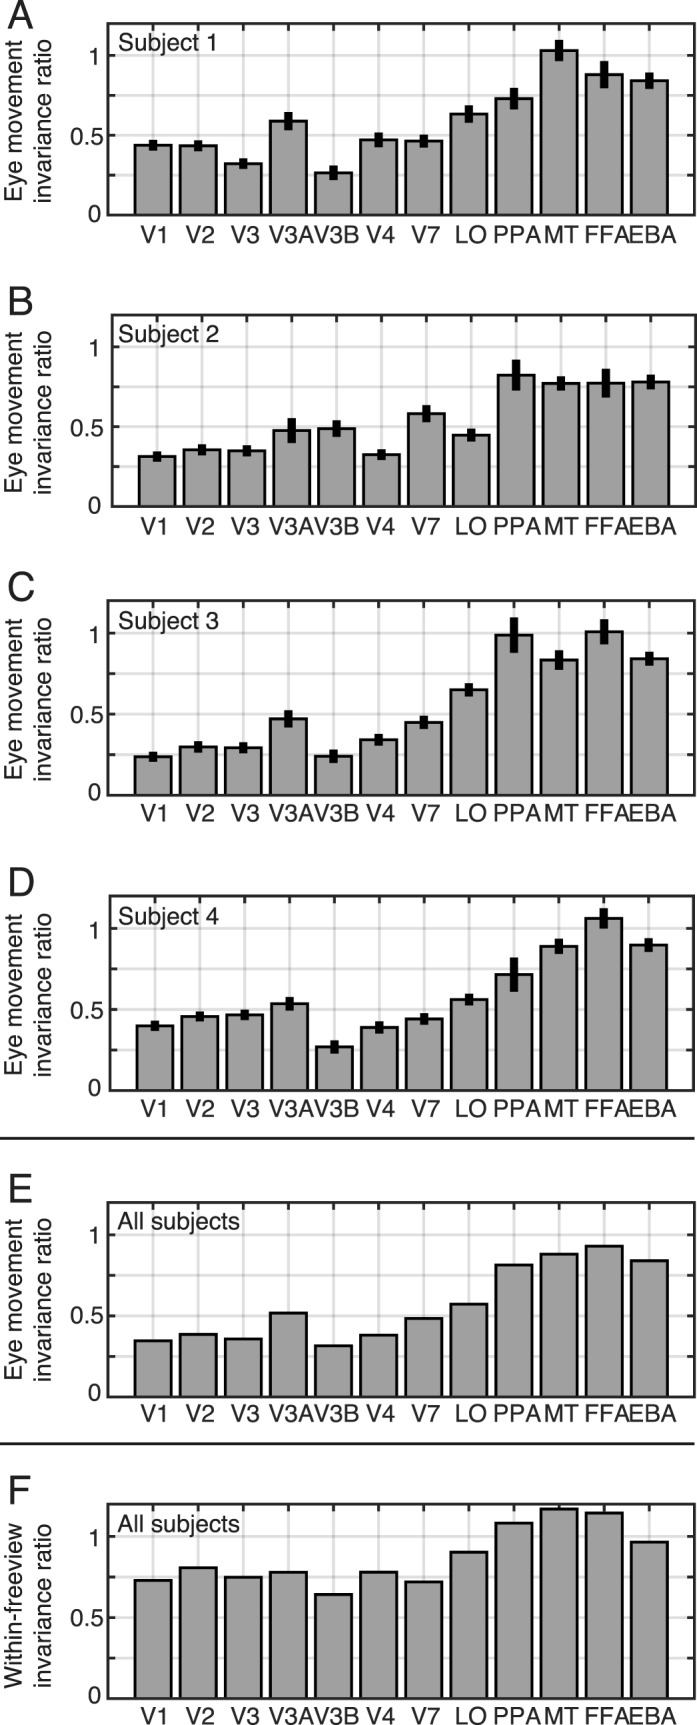
Summary of eye movement-invariant responses across visual areas. (A–D) EMIRs for each visual area, for separate subjects. Error bars indicate ±1 standard error of the mean across voxels (bootstrap procedure; Efron & Tibshirani, 1993). (E) EMIRs averaged across the subjects. EMIR in early visual areas (V1–V4) is relatively low, while EMIR in higher areas (MT+, PPA, FFA, and EBA) is relatively high. In these eye movement-invariant areas, about 80% of the response variance is not affected by eye movements. (F) Response similarity across trials within the free viewing condition (normalized by those for the fixation condition, as in the EMIR).
To further examine eye movement-invariance in the aforementioned areas, we also calculated the response similarity across trials within the free viewing condition (after normalizing by responses obtained in the fixation condition, as in the original EMIR; Figure 4F). If an area is invariant to eye movements, response similarity across different free viewing trials should be high. As expected (Figure 4F), we found higher similarity of the explained variances for the ventral temporal areas, while the interareal differences are not as prominent as those for EMIR (Figure 4E). These results provide an additional support that responses in the ventral temporal areas are eye movement-invariant. However, as noted earlier, such a high response similarity is necessary but not sufficient to identify eye movement-invariant areas (see also the Introduction). This is because subjects tend to exhibit similar eye movements for identical movies, and thus the response similarity across free viewing trials could be explained by cross-trial correlation in retinal inputs, eye movement-invariance, or both of these factors together.
Discussion
This study aimed to identify human visual areas whose responses are invariant to eye movements. To examine this issue we compared the similarity of BOLD responses measured in single voxels during repeated fixation of a single movie to responses measured during free viewing of the same movie. After aggregating this information within several conventional functional regions of interest, we found that responses in early visual areas are strongly affected by eye movements, while those in ventral temporal visual areas are largely unaffected by eye movements. These results suggest that the ventral temporal areas maintain a stable representation of the visual world during natural vision, when eye movements are common. To our knowledge, our study provides the first direct evidence that some specific areas within human visual cortex are eye movement-invariant. Although we have applied our procedure to BOLD signals in this article, the technique itself is general and can be applied to different measurement domains, such as cellular-level neurophysiology, magnetoencephalography, or electroencephalography.
Several previous studies have tested eye movement-invariance under the implicit assumption that any eye-movement-invariant area will have localized receptive fields within a world-centered reference frame (d'Avossa et al., 2007; Duhamel et al., 1992; Gardner, Merriam, Movshon, & Heeger, 2008). No such areas have been found thus far (Gardner et al., 2008; but see d' Avossa et al., 2007). However, neither local receptive-field organization nor a world-centered reference frame is absolutely necessary to produce a representation that is invariant to eye movements. Thus, these previous studies may simply have defined the phenomenon in a way that was too narrow to identify invariant areas. Indeed, other studies have failed to find evidence supporting a world-centered reference frame anywhere in the human brain (Cohen & Andersen, 2002). The method used in our study does not require any strong assumptions about receptive-field organization or reference frames, and so it provides a more general and sensitive approach for identifying eye movement-invariant representations.
One common view is that eye movement-invariant representations are an inevitable consequence of large receptive fields. The size of visual receptive fields is known to increase gradually from area V1 to higher-order visual areas (Rosa, 1997; Winawer, Horiguchi, Sayres, Amano, & Wandell, 2010). However, it is possible to construct large receptive fields so that they retain sensitivity to eye movements. For example, because neurons in extrastriate visual areas are spatially inhomogeneous (Anzai, Peng, & Van Essen, 2007; Tao et al., 2012; Willmore, Prenger, & Gallant, 2010), slight spatial shifts of a visual scene could have substantial effects on neuronal responses. For this reason, although large receptive fields could be one of the plausible mechanisms that contribute to eye-movement invariance, measurements of receptive-field size within a visual area are not sufficient to determine whether that area is eye movement-invariant. The results that we report here provide the first direct evidence for eye movement-invariant representations in ventral temporal visual areas. We could further examine the neural mechanisms by identifying cellular-level receptive fields in multiple visual areas under free viewing conditions. This will be a focus of future studies.
Though the experimental approach used here has substantial advantages over the methods used in previous studies, it is not perfect. Two different aspects of the experimental procedure might have biased our estimates of eye movement-invariance in individual voxels. First, eye movement-invariant estimates might be biased by small eye movements that might have occurred even in our cohort of highly trained observers. If subjects moved their eyes during fixation, then this would decrease the similarity of responses across repeats of the fixation condition, which would increase the EMIR and bias results toward eye movement-invariance. If this occurred, then some of the areas that we have identified as eye-movement invariant may be somewhat less invariant than they appear in our study. Because our observers had extensive experience in a wide variety of fixation experiments, including hours of experience fixating in natural-movie experiments (Nishimoto et al., 2011), we do not think that this is a serious problem. However, the possibility must be factored into any evaluation of the results.
Second, because BOLD fMRI measurements at 3T are spatially coarse, it is difficult to measure eye-movement invariance accurately within very small visual areas that have relatively few voxels. In fact, this problem likely accounts for one very surprising result in our study: the finding that hMT+ appears to be eye-movement invariant. This result is suspicious because many neurophysiological studies have demonstrated that area MT represents the world in a retinotopic reference frame (Nishimoto & Gallant, 2011). Recall, however, that hMT+ is quite small (Zimmermann et al., 2011), and that the MT+ localizer used here and in other studies likely includes multiple visual areas that are homologues to macaque areas MT, MST, and FST (Huk, Dougherty, & Heeger, 2002; Kolster, Peeters, & Orban, 2010). If voxels within areas MST and FST are relatively eye movement-invariant, then they likely mask the effect of eye movements within MT itself. Alternatively, the BOLD signals recorded from each hMT+ voxel in our study might reflect the aggregate activity of neurons sensitive to many different locations across the visual field.
Some readers might be left with the suspicion that the observed invariance results from the excitation of the peripheral screen borders and spurious retinal motion. Although it is difficult to completely rule out this explanation, it is likely that its effect is minimal given the lower correlation values for early dorsal areas (e.g., V3), which are known to be more affected by spurious motion.
Another potential source of eye movement-invariance is invariance in the allocation of attention (Crespi et al., 2011). Although the subjects were engaged in a fixation task, their attention would likely have been drawn to any salient stimuli that appeared in the visual periphery. It has been reported in both the neurophysiological and fMRI literature that attention can shift receptive fields in extrastriate visual areas (Connor, Preddie, Gallant, & Van Essen, 1997; Hansen et al., 2007). This could contribute to the observed similarity between BOLD signals. Note that our EMIR maps are quantitatively similar to the attention-related spatiotopic selectivity maps reported by Crespi et al. (2011).
In this study, we did not use functional localizers that would allow us to identify functionally defined regions of interest around the parietal cortex. However, we did find high-EMIR voxels around the intraparietal sulcus (e.g., just dorsal to V7; see Figures 2C and 3). This observation, together with the intermediate EMIRs around V7, is consistent with previous studies showing eye-position-invariant responses in parietal areas (Burgess, 2008; Duhamel et al., 1997; Galletti et al., 1993; Pertzov et al., 2011).
One practical contribution of our study is that the results provide a way to help interpret BOLD signals measured under free viewing conditions. Recently, an increasing number of researchers have adopted naturalistic experimental paradigms (Bartels & Zeki, 2005; Hasson et al., 2004; Kay et al., 2008). Because it has been unclear how eye movements affect visually evoked BOLD signals, many of these studies still use a fixation paradigm (Huth et al., 2012; Kay et al., 2008; Naselaris, Prenger, Kay, Oliver, & Gallant, 2009; Nishimoto et al., 2011). Our results show that in ventral temporal cortex, BOLD signals are largely unaffected by natural eye movements. This suggests that both fixation and more naturalistic free viewing paradigms will produce largely equivalent results in these areas and in more anterior areas that also represent visual information.
Supplementary Material
Acknowledgments
This work was supported by a grant from the National Eye Institute (EY019684) to JLG and by JSPS KAKENHI Grants JP26120536 and JP15H05311 to SN. AGH was partly supported by the William Orr Dingwall Neurolinguistics Fellowship. NYB was partly supported by a National Science Foundation Graduate Research Fellowship. We thank An Vu and Tolga Çukur for helping with fMRI data collection. SN, AGH, and JLG conceived and designed the experiment. AGH, SN, and NYB collected the fMRI data. SN, AGH, and NYB analyzed the data. SN and JLG wrote the article. The authors declare no conflict of interest.
Commercial relationships: none.
Corresponding author: Shinji Nishimoto.
Email: nishimoto@nict.go.jp.
Address: Center for Information and Neural Networks, National Institute of Information and Communications Technology and Osaka University, Osaka, Japan.
References
- Anzai, A., Peng, X., & Van Essen, D.C.C.. (2007). Neurons in monkey visual area V2 encode combinations of orientations. Nature Neuroscience, 10, 1313–1321. [DOI] [PubMed] [Google Scholar]
- Bartels, A., & Zeki, S.. (2004). The chronoarchitecture of the human brain—Natural viewing conditions reveal a time-based anatomy of the brain. NeuroImage, 22, 419–433. [DOI] [PubMed] [Google Scholar]
- Bartels, A., & Zeki, S.. (2005). Brain dynamics during natural viewing conditions—A new guide for mapping connectivity in vivo. NeuroImage, 24, 339–349. [DOI] [PubMed] [Google Scholar]
- Burgess, N. (2008). Spatial cognition and the brain. Annals of the New York Academy of Sciences, 1124, 77–97. [DOI] [PubMed] [Google Scholar]
- Cohen, Y. E., & Andersen, R. A.. (2002). A common reference frame for movement plans in the posterior parietal cortex. Nature Reviews Neuroscience, 3, 553–562. [DOI] [PubMed] [Google Scholar]
- Connor, C. E., Preddie, D. C., Gallant, J. L., & Van Essen, D. C.. (1997). Spatial attention effects in macaque area V4. The Journal of Neuroscience, 17, 3201–3214. [DOI] [PMC free article] [PubMed] [Google Scholar]
- Crespi, S., Biagi, L., d'Avossa, G., Burr, D. C., Tosetti, M., & Morrone, M. C.. (2011). Spatiotopic coding of BOLD signal in human visual cortex depends on spatial attention. PLoS One, 6 7, e21661. [DOI] [PMC free article] [PubMed] [Google Scholar]
- Curcio, C. A., Sloan, K. R., Kalina, R. E., & Hendrickson, A. E.. (1990). Human photoreceptor topography. The Journal of Comparative Neurology, 292, 497–523. [DOI] [PubMed] [Google Scholar]
- David, S. V., & Gallant, J. L.. (2005). Predicting neuronal responses during natural vision. Network: Computation in Neural Systems, 16, 239–260. [DOI] [PubMed] [Google Scholar]
- d' Avossa, G., Tosetti, M., Crespi, S., Biagi, L., Burr, D. C., & Morrone, M. C.. (2007). Spatiotopic selectivity of BOLD responses to visual motion in human area MT. Nature Neuroscience, 10, 249–255. [DOI] [PubMed] [Google Scholar]
- Downing, P. E., Jiang, Y., Shuman, M., & Kanwisher, N.. (2001, Month DD). A cortical area selective for visual processing of the human body. Science, 293, 2470–2473. [DOI] [PubMed] [Google Scholar]
- Duhamel, J. R., Bremmer, F., Ben Hamed, S., & Graf, W.. (1997). Spatial invariance of visual receptive fields in parietal cortex neurons. Nature, 389, 845–848. [DOI] [PubMed] [Google Scholar]
- Duhamel, J. R., Colby, C. L., & Goldberg, M. E.. (1992, Jan 3). The updating of the representation of visual space in parietal cortex by intended eye movements. Science, 255, 90–92. [DOI] [PubMed] [Google Scholar]
- Efron, B., & Tibshirani, R.. (1993). An introduction to the bootstrap. New York: Chapman & Hall. [Google Scholar]
- Epstein, R., & Kanwisher, N.. (1998). A cortical representation of the local visual environment. Nature, 392, 598–601. [DOI] [PubMed] [Google Scholar]
- Gallant, J. L., Connor, C. E., & Van Essen, D. C.. (1998). Neural activity in areas V1, V2 and V4 during free viewing of natural scenes compared to controlled viewing. NeuroReport, 9, 2153–2158. [DOI] [PubMed] [Google Scholar]
- Galletti, C., Battaglini, P. P., & Fattori, P.. (1993). Parietal neurons encoding spatial locations in craniotopic coordinates. Experimental Brain Research, 96, 221–229. [DOI] [PubMed] [Google Scholar]
- Gardner, J. L., Merriam, E. P., Movshon, J. A., & Heeger, D. J.. (2008). Maps of visual space in human occipital cortex are retinotopic, not spatiotopic. The Journal of Neuroscience, 28, 3988–3999. [DOI] [PMC free article] [PubMed] [Google Scholar]
- Hansen, K. A., Kay, K. N., & Gallant, J. L.. (2007). Topographic organization in and near human visual area V4. The Journal of Neuroscience, 27, 11896–11911. [DOI] [PMC free article] [PubMed] [Google Scholar]
- Hasson, U., Malach, R., & Heeger, D. J.. (2010). Reliability of cortical activity during natural stimulation. Trends in Cognitive Sciences, 14, 40–48. [DOI] [PMC free article] [PubMed] [Google Scholar]
- Hasson, U., Nir, Y., Levy, I., Fuhrmann, G., & Malach, R.. (2004, Mar 12). Intersubject synchronization of cortical activity during natural vision. Science, 303, 1634–1640. [DOI] [PubMed] [Google Scholar]
- Huk, A. C., Dougherty, R. F., & Heeger, D. J.. (2002). Retinotopy and functional subdivision of human areas MT and MST. The Journal of Neuroscience, 22, 7195–7205. [DOI] [PMC free article] [PubMed] [Google Scholar]
- Huth, A. G., Nishimoto, S., Vu, A. T., & Gallant, J. L.. (2012). A continuous semantic space describes the representation of thousands of object and action categories across the human brain. Neuron, 76, 1210–1224. [DOI] [PMC free article] [PubMed] [Google Scholar]
- Jenkinson, M., & Smith, S.. (2001). A global optimisation method for robust affine registration of brain images. Medical Image Analysis, 5, 143–156. [DOI] [PubMed] [Google Scholar]
- Kanwisher, N., McDermott, J., & Chun, M. M.. (1997). The fusiform face area: A module in human extrastriate cortex specialized for face perception. The Journal of Neuroscience, 17, 4302–4311. [DOI] [PMC free article] [PubMed] [Google Scholar]
- Kay, K. N., Naselaris, T., Prenger, R. J., & Gallant, J. L.. (2008). Identifying natural images from human brain activity. Nature, 452, 352–355. [DOI] [PMC free article] [PubMed] [Google Scholar]
- Kolster, H., Peeters, R., & Orban, G. A.. (2010). The retinotopic organization of the human middle temporal area MT/V5 and its cortical neighbors. The Journal of Neuroscience, 30, 9801–9820. [DOI] [PMC free article] [PubMed] [Google Scholar]
- Mazer, J. A., & Gallant, J. L.. (2003). Goal-related activity in area V4 during free viewing visual search: Evidence for a ventral stream salience map. Neuron, 40, 1241–1250. [DOI] [PubMed] [Google Scholar]
- Melcher, D. (2011). Visual stability. Philosophical Transactions of the Royal Society of London, Series B: Biological Sciences, 366, 468–475. [DOI] [PMC free article] [PubMed] [Google Scholar]
- Melcher, D., & Colby, C. L.. (2008). Trans-saccadic perception. Trends in Cognitive Sciences, 12, 466–473. [DOI] [PubMed] [Google Scholar]
- Naselaris, T., Prenger, R. J., Kay, K. N., Oliver, M., & Gallant, J. L.. (2009). Bayesian reconstruction of natural images from human brain activity. Neuron, 63, 902–915. [DOI] [PMC free article] [PubMed] [Google Scholar]
- Nishimoto, S., & Gallant, J. L.. (2011). A three-dimensional spatiotemporal receptive field model explains responses of area MT neurons to naturalistic movies. The Journal of Neuroscience, 31, 14551–14564. [DOI] [PMC free article] [PubMed] [Google Scholar]
- Nishimoto, S., Vu, A. T., Naselaris, T., Benjamini, Y., Yu, B., & Gallant, J. L.. (2011). Reconstructing visual experiences from brain activity evoked by natural movies. Current Biology, 21, 1641–1646. [DOI] [PMC free article] [PubMed] [Google Scholar]
- Pertzov, Y., Avidan, G., & Zohary, E.. (2011). Multiple reference frames for saccadic planning in the human parietal cortex. The Journal of Neuroscience, 31, 1059–1068. [DOI] [PMC free article] [PubMed] [Google Scholar]
- Rosa, M. (1997). Visuotopic organization of primate extrastriate cortex. Rockland, K. H. Kaas, J. H. & Peters A.. (Eds.), Cerebral cortex: Extrastriate cortex in primates (12th ed., 127–203 ). New York: Plenum Press. [Google Scholar]
- Tao, X., Zhang, B., Smith, E. L., Nishimoto, S., Ohzawa, I., & Chino, Y. M.. (2012). Local sensitivity to stimulus orientation and spatial frequency within the receptive fields of neurons in visual area 2 of macaque monkeys. Journal of Neurophysiology, 107, 1094–1110. [DOI] [PMC free article] [PubMed] [Google Scholar]
- Van Essen, D. C., Drury, H. A., Dickson, J., Harwell, J., Hanlon, D., & Anderson, C. H.. (2001). An integrated software suite for surface-based analyses of cerebral cortex. Journal of the American Medical Informatics Association, 8, 443–459. [DOI] [PMC free article] [PubMed] [Google Scholar]
- Vinje, W. E., & Gallant, J. L.. (2000, Feb 18). Sparse coding and decorrelation in primary visual cortex during natural vision. Science, 287, 1273–1276. [DOI] [PubMed] [Google Scholar]
- Willmore, B. D., Prenger, R. J., & Gallant, J. L.. (2010). Neural representation of natural images in visual area V2. The Journal of Neuroscience, 30, 2102–2114. [DOI] [PMC free article] [PubMed] [Google Scholar]
- Winawer, J., Horiguchi, H., Sayres, R. A., Amano, K., & Wandell, B. A.. (2010). Mapping hV4 and ventral occipital cortex: The venous eclipse. Journal of Vision, 10 5: 1, 1–22, doi:10.1167/10.5.1 [PubMed] [Article] [DOI] [PMC free article] [PubMed] [Google Scholar]
- Yarbus, A. L. (1967). Eye movements and vision. New York: Plenum. [Google Scholar]
- Zimmermann, J., Goebel, R., De Martino, F., van de Moortele, P.-F., Feinberg, D., Adriany, G.,… Yacoub, E.. (2011). Mapping the organization of axis of motion selective features in human area MT using high-field fMRI. PLoS ONE, 6 12, e28716. [DOI] [PMC free article] [PubMed] [Google Scholar]
Associated Data
This section collects any data citations, data availability statements, or supplementary materials included in this article.