Abstract
Imaging is pivotal in the evaluation and management of patients with seizure disorders. Elegant structural neuroimaging with magnetic resonance imaging (MRI) may assist in determining the etiology of focal epilepsy and demonstrating the anatomical changes associated with seizure activity. The high diagnostic yield of MRI to identify the common pathological findings in individuals with focal seizures including mesial temporal sclerosis, vascular anomalies, low-grade glial neoplasms and malformations of cortical development has been demonstrated. Positron emission tomography (PET) is the most commonly performed interictal functional neuroimaging technique that may reveal a focal hypometabolic region concordant with seizure onset. Single photon emission computed tomography (SPECT) studies may assist performance of ictal neuroimaging in patients with pharmacoresistant focal epilepsy being considered for neurosurgical treatment. This chapter highlights neuroimaging developments and innovations, and provides a comprehensive overview of the imaging strategies used to improve the care and management of people with epilepsy.
The etiologies of epilepsies are varied and multifactorial in most cases (Berg et al., 2010). Therefore, investigation of the underlying causes of seizures will depend on the clinical context, in particular, the type of syndrome, age, types of seizures, associated diseases, presence or absence of progressive or static motor and cognitive dysfunction, among other factors.
In this context, in addition to electroencephalogram (EEG), neuroimaging techniques, in particular magnetic resonance imaging (MRI), are the most important tools for determining the syndromic diagnosis and possible etiology of epilepsy.
COMPUTED TOMOGRAPHY (CT)
CT has the advantage of being available in most hospitals worldwide and has a relatively low operating cost. In addition, the logistics of CT make it easier for unstable patients as compared to MRI. CT can detect most tumors (except for some low-grade tumors), large arteriovenous malformations and extensive brain malformations, stroke, and infectious lesions. CT is sensitive for detection of calcified lesions and bone lesions, while MRI often misses these. CT has low sensitivity for detecting small cortical lesions in general and particularly lesions in the base of the skull, as in the orbitofrontal and medial temporal regions. The overall percentage of success of CT in detecting lesions in focal epilepsies is low, approximately 30% (Bronen et al., 1996). Therefore, although CT may be a good indication for new-onset seizures in an emergency, it is not a substitute for MRI in the investigation of epilepsy.
WHEN TO PERFORM AN MRI IN A PATIENT WITH SEIZURES
All patients with epilepsy should undergo an MRI, except those with very typical forms of primary generalized epilepsy (e.g., juvenilemyoclonic epilepsy, childhoodabsence) or benign focal epilepsies of childhood with characteristic clinical and EEG features (e.g., benign epilepsy with centrotemporal spikes, early-onset childhood epilepsy with occipital spikes (Panayiotopoulos type)) and adequate response to antiepileptic drugs (AEDs) (Commission on Neuroimaging of the International League Against Epilepsy, 1997; Berg et al., 2010; Gaillard et al., 2011).
There are two basic situations in which to perform an MRI in patients with seizures. The first applies to newly diagnosed patients and those with longstanding epilepsy who have not been properly investigated. The second applies to patients with refractory seizures and therefore candidates for surgery (Berg et al., 2010). Even patients with long-term focal epilepsy of unknown etiology should undergo an MRI. Low-grade tumors and other surgically treatable lesions may be found in patients with a history of epilepsy of more than 20 years’ duration.
Priority should be given to patients with focal findings in the neurologic exam. Imaging examinations of emergency (CT or MRI) should be performed in patients with early onset of seizures with focal neurologic deficits, fever, persistent headache, cognitive changes, and a recent history of head trauma. Focal seizures with onset in adulthood should be considered as a possible indication for an emergency neuroimaging examination.
MRI exam is crucial for the diagnosis and treatment of patients with epilepsy. MR images allow the characterization of the nature of the lesion and whether it is progressive (e.g., cancer, Rasmussen’s encephalitis) or static (e.g., ischemic lesions, congenital malformations).
By helping to define the etiology of epilepsy, MRI becomes an important tool for prognostic counseling and defining treatment strategy. We can also use MRI to monitor progression of lesions. Diffusion tensor imaging (DTI), three-dimensional (3D) reconstructions, and coregistrations of different imaging modalities are important tools in surgical planning.
Not all MRI abnormalities cause seizures and not all seizures originate from identified structural cerebral abnormalities (Gaillard et al., 2011). It is necessary to establish with clinical and neurophysiologic data whether a given lesion is likely to cause the seizures. However, in the context of presurgical evaluation, the identification of a lesion closely associated with the EEG seizure onset zone is associated with better postoperative seizure control (Cascino, 2001; Berg et al., 2009; Téllez-Zenteno et al., 2010). In the research field, MRI allows us to better understand the pathophysiology of epilepsy (Mishra et al., 2011).
HOW TO PERFORM AN MRI IN PATIENTS WITH EPILEPSY
The epileptogenic lesion may be detected using routine MRI protocols. However, routine MRIs often miss smaller or subtle lesions and are considered normal. Therefore, in these cases, an optimized epilepsy protocol with adequate spatial resolution and multiplanar reformatting is essential (Gaillard et al., 2011; Cendes, 2013).
A proper MRI investigation of patients with focal epilepsy requires the use of specific protocols, selected based on identification of the region of onset by clinical and EEG findings. For practical purposes, focal epilepsy can be divided into mesial temporal-lobe epilepsy (MTLE) and neocortical epilepsy. This distinction is due to the relative specificity and consistency of clinical, MRI, and pathologic findings (most frequently hippocampal sclerosis: HS) (Figs 51.1 and 51.2) observed in MTLE (Table 51.1) compared to neocortical epilepsies. The clinical manifestations and EEG changes in neocortical epilepsy are varied, and the pathologic substrate involved in its genesis comprises a broader range of etiologies (Table 51.2) (Von Oertzen et al., 2002; Gaillard et al., 2011; Cendes, 2013).
Fig. 51.1.
Coronal T1 inversion recovery (A) and fluid-attenuated inversion recovery (FLAIR) axial (B) and coronal (C) magnetic resonance imaging (MRI) showing left hippocampal atrophy associated with changes in morphology and internal structure and hyperintense FLAIR signal (arrows) – all classic signs of hippocampal sclerosis on MRI that were confirmed on postoperative histopathology. Patient with left mesial temporal-lobe epilepsy and seizure-free after left amygdalohippocampectomy.
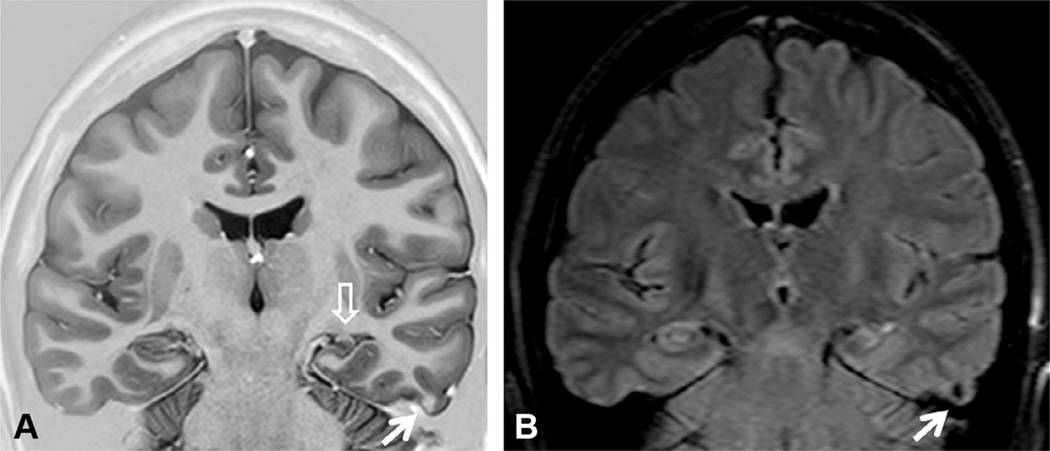
Fig. 51.2.
Coronal T1 inversion recovery (IR) (A) and fluid-attenuated inversion recovery (FLAIR) (B) magnetic resonance imaging showing left hippocampal atrophy associated with change in morphology and internal structure (open arrow) and hyperintense FLAIR signal. There is also a small nodular lesion which is slightly hyperintense in the T1 IR and hypointense in FLAIR images (arrows) in the third temporal gyrus that corresponded to a calcified lesion on computed tomography scan. Postoperative histopathology confirmed hippocampal sclerosis and a degenerated calcified neurocysticercosis nodule. Patient with left mesial temporal-lobe epilepsy and seizure-free after left anterior temporal lobe resection.
Table 51.1.
Magnetic resonance imaging (MRI) features of hippocampal sclerosis (HS) by visual analysis of MRI
| Hippocampal atrophy |
| The most specific and reliable feature: determined by comparing the hippocampal size on each side on all available coronal slices. Small asymmetries can be present due to normal variation or a tilted position in the scanner, and should not be considered as abnormal. It is important to evaluate the shape of the hippocampus as well. The normal hippocampus has an oval shape. In the presence of hippocampal sclerosis it is usually flattened and inclined |
| Increased T2/FLAIR signal |
| May be insufficient to diagnose HS in isolation. It is important to compare both hippocampi and the signal intensity of the nearby cortex to avoid false positives. Clearly asymmetric hyperintense signal is more reliable |
| Loss of internal structure |
| Usually associated with atrophy and hyperintense T2/FLAIR signal. The loss of normal internal hippocampal structure is a consequence of neuronal loss and gliosis |
| Asymmetry of the horns of the lateral ventricles |
| Usually present when the lesion occurs later in life, and therefore, it is variable and may lead to false lateralization |
| Atrophy of the anterior temporal lobe |
| Often present, but nonspecific |
| Atrophy of the ipsilateral fornix and mammillary bodies |
| Secondary to the neuronal loss of the hippocampus, and considered secondary signs. Seen in cases of pronounced hippocampal atrophy |
| T2 mapping (relaxometry) |
| An objective method for measuring abnormal T2 signal which may be difficult to detect visually |
FLAIR, fluid-attenuated inversion recovery.
Table 51.2.
Imaging investigation in patients with suspected neocortical lesions
Imaging protocol should include at least the following:
|
| If nothing is found in the first evaluation, reexamination by an experienced observer may reveal a subtle lesion such as focal cortical dysplasia:
|
| If focal findings are suspected, correlation with seizure semiology, EEG findings, ictal and interictal SPECT images or PET may add additional information on the localization of the epileptogenic zone:
|
| The most common lesions causing neocortical epilepsies are low-grade tumors; malformations of cortical development, posttraumatic; postischemic and inflammatory-infectious scars; cavernous angioma; and arteriovenous malformations |
3D, three-dimensional; GRE, gradient echo; FLAIR, fluid-attenuated inversion recovery; MRI, magnetic resonance imaging; FDG-PET, fluorodeoxyglucose positron emission tomography; EEG, electroencephalogram; SPECT, single-photon emission computed tomography.
It is recommended that the MRI epilepsy protocols include a T1-weighted volumetric acquisition (3D) with isotropic voxel size of 1 mm or 1.5 mm in order to enable the reconstruction of images in any plane (Gaillard et al., 2011; Cendes, 2013).
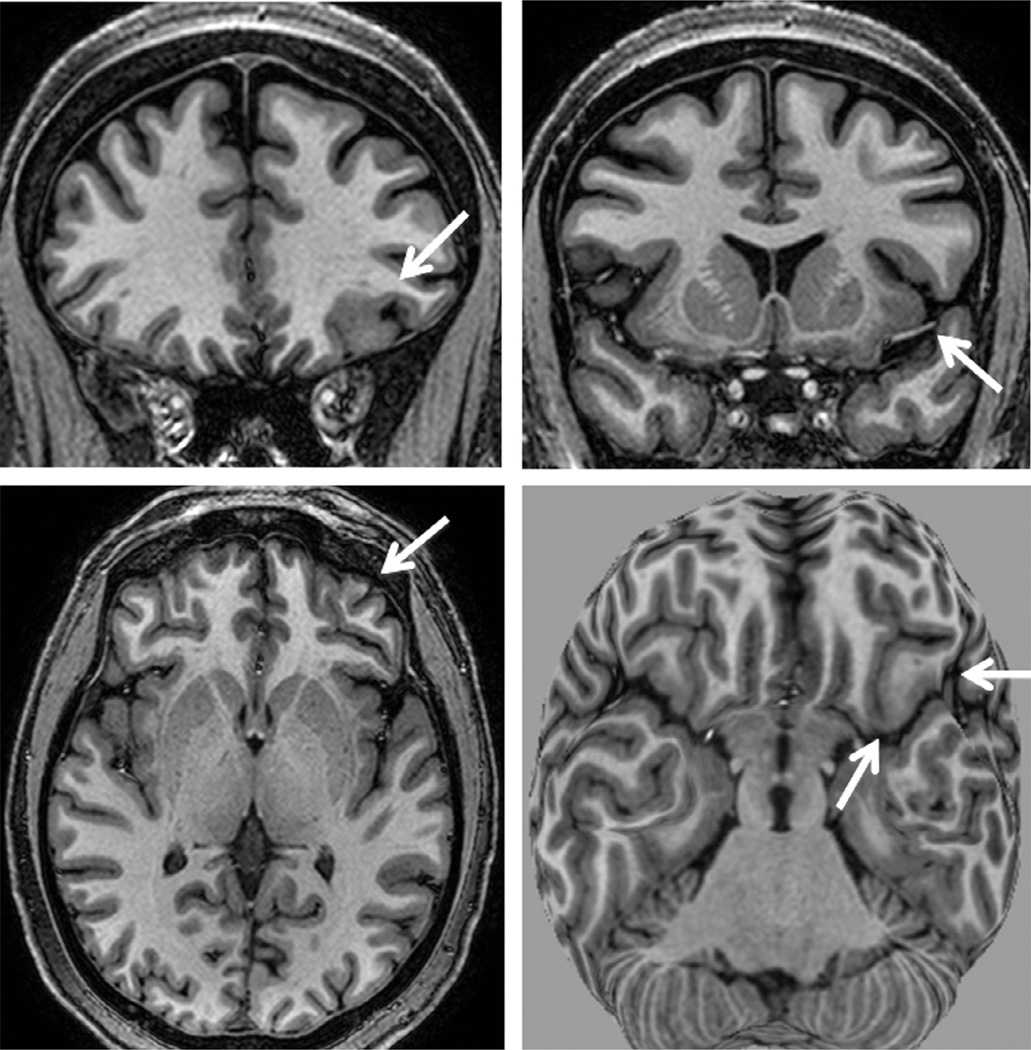
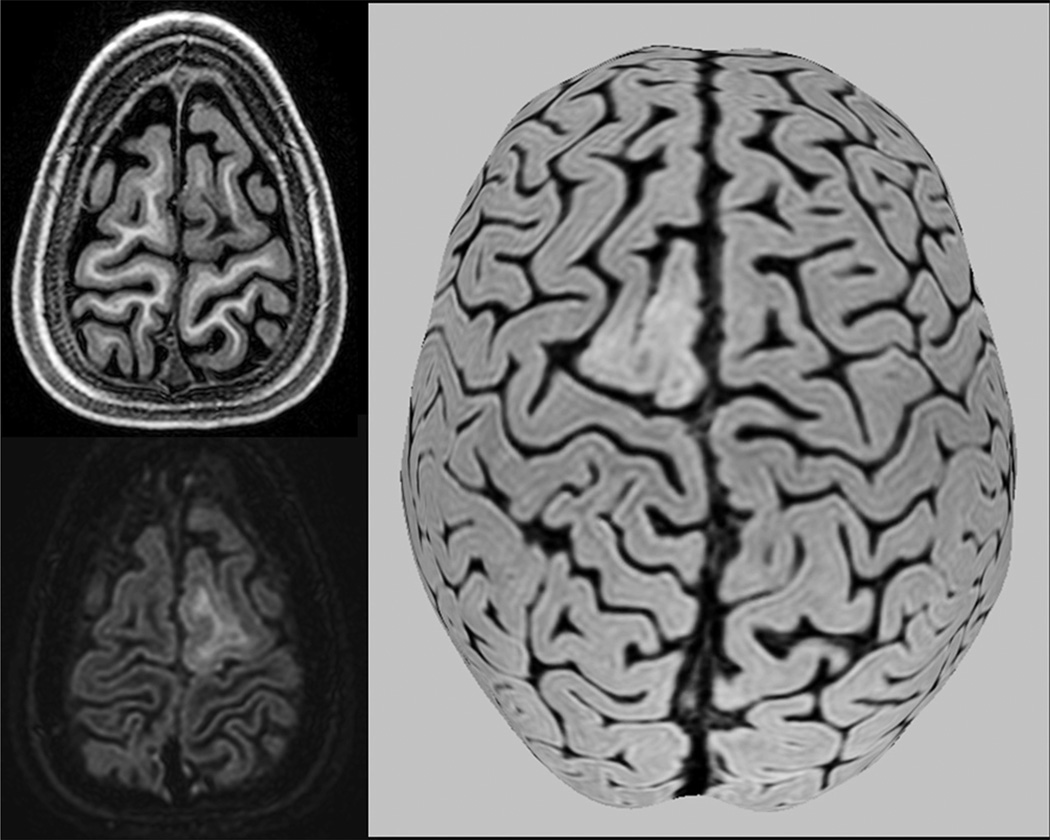
Studies demonstrated that more sophisticated methods of image reconstruction from 3D acquisitions allow a better evaluation of patients with discrete structural lesions, in particular focal cortical dysplasia (FCD) (Figs 51.3–51.6), where the main findings are cortical thickening, abnormal gyri, and poor delineation of the transition between white and gray matter (Bastos et al., 1999; Colombo et al., 2009; Bernasconi et al., 2011; Blumcke et al., 2011). The 3D images obtained have the characteristics of a volume, which may be handled on a computer workstation to serve various purposes. Among the methods for postprocessing and analysis of images with great diagnostic application in epilepsy are multiplanar (Figs 51.3 and 51.4) (Barkovich et al., 1995) and curvilinear reconstruction (Fig. 51.3) (Bastos et al., 1999).
Fig. 51.3.
T1-weighted magnetic resonance imaging (MRI) multiplanar (MPR) and curvilinear reconstruction (bottom right) in a patient with frontal-lobe seizures and previous MRIs considered as normal. Note an area with abnormal gyri and slightly thickened cortex and blurred cortical-subcortical transition in the left lateral-basal frontal lobe (arrows). These abnormalities and the focal cortical-subcortical blurring became obvious in the curvilinear reconstructions in layers going from 4 to 8 mm deep from the surface of the brain (bottom right). The T2-weighted and fluid-attenuated inversion recovery images did not show abnormal signal (not shown here). These changes are suggestive of focal cortical dysplasia (FCD) type I or IIA.
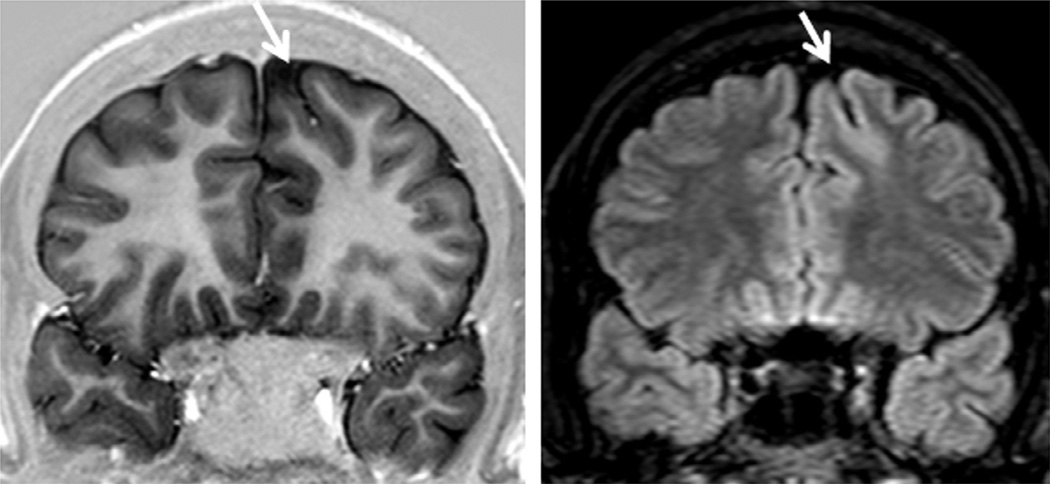
Fig. 51.6.
Coronal T1 inversion recovery and fluid-attenuated inversion recovery (FLAIR) images showing typical changes of the bottom of the sulcus dysplasia (arrows). This is a focal cortical dysplasia (FCD) type IIB localized in the bottom of a (usually) deep sulcus with a mildly thickened cortex and hyperintense FLAIR signal, as seen in this patient with left frontal epilepsy. Histopathology showed FCD type IIB and the patient became seizure-free after surgery.
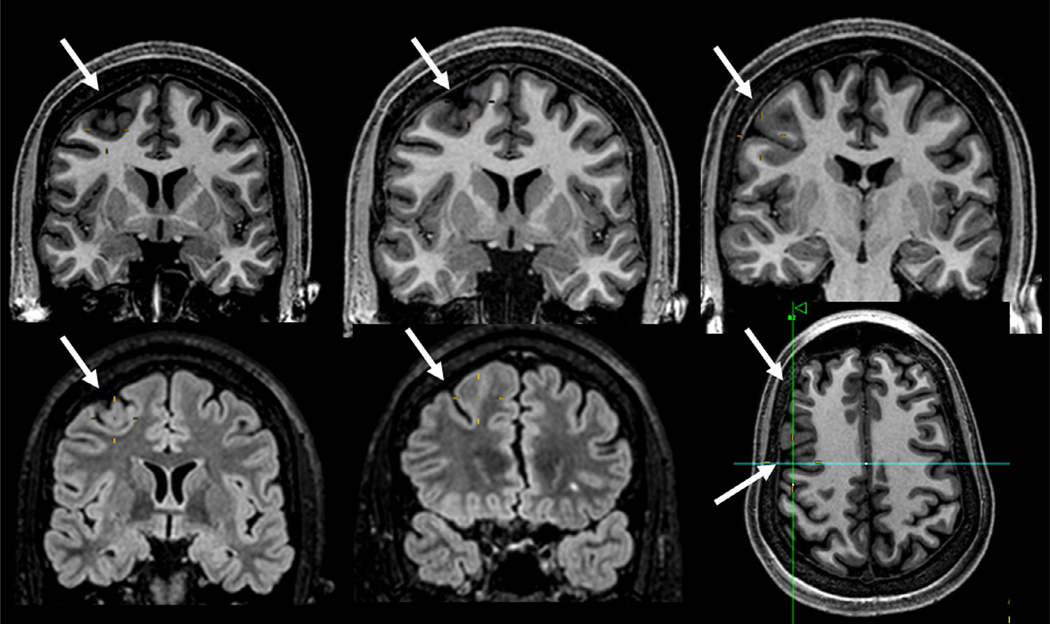
Fig. 51.4.
Magnetic resonance imaging (MRI) multiplanar reconstruction (MPR) in a patient with frontal-lobe seizures due to focal cortical dysplasia (FCD) who had previous MRIs considered as negative. Top row shows reconstructed volumetric coronal T1-weighted images, and bottom row shows reconstructed volumetric fluid-attenuated inversion recovery (FLAIR) images and an axial reconstructed T1-weighted image (all with 1-mm thickness). The area with FCD in the left frontal lobe presents with slightly thickened cortex associated with abnormal gyri and cortical dimple (arrows). The FLAIR images did not show a clearly abnormal signal, except for a slightly blurred cortical-subcortical transition. The postoperative histopathology showed classic signs of FCD type IIA.
Multiplanar analysis is the interactive visual evaluation of brain parenchyma, acquired by volumetric MRI. These techniques allow the inspection of details of brain structure through the simultaneous analysis of brain in different planes of section, which is very important for the detection of FCDs (Cendes, 2013).
In addition to the technical aspects of MRI acquisition, the experience of the examiner and a clinical/ encephalographic correlation are essential when searching for subtle epileptogenic lesions (Von Oertzen et al., 2002).
MRI IN MESIAL TEMPORAL-LOBE EPILEPSY
In MTLE, EEG findings, clinical history, and neuroimaging findings are important to define the diagnosis. Although there are other etiologies that cause TLE, HS is the most common pathologic substrate. MTLE with HS is often associated with a precipitating injury such as complex febrile seizures, birth trauma, meningitis, or head injury that happens in early life. A latent period of several years may precede dyscognitive seizures (previously known as complex partial seizures) (Cendes et al., 2014).
High-resolution MRI is a highly sensitive and specific noninvasive method to diagnose HS in vivo. Images need to be optimized for the evaluation of features indicating hippocampal pathology. Coronal slices are mandatory and they need to be obtained on a plane perpendicular to the long axis of the hippocampus guided by a sagittal scout image. The slices need to be thin to allow appreciation of fine details of the different portions of hippocampal anatomy. Ideally, the slice thickness should be 3 mmor preferably less. To evaluate volume, shape, orientation, and internal structure, high-resolution T1-weighted images, particularly with inversion recovery (IR), are highly recommended. T2-weighted or fluid-attenuated inversion recovery (FLAIR) images are important to assess qualitatively the signal intensity (Figs 51.1 and 51.2). FLAIR imaging sequences demonstrated an accuracy of 97% for the demonstration of abnormalities associated with HS defined on histopathologic examination (Kuzniecky et al., 1997). The presence and severity of HS in both hippocampi may provide useful prognostic information about less favorable postoperative seizure control and memory outcome (Arruda et al., 1996; Yasuda and Cendes, 2012).
Qualitative MRI interpretation, and quantitation of hippocampal volume (volumetry) and T2 signal (T2 relaxometry), are very sensitive and specific in detecting HS (Coan et al., 2014). However, simple qualitative visual analysis is also quite sensitive, especially if the MR images are carefully and properly acquired (Labate et al., 2010). Visual discrimination of a normal from an abnormal hippocampus is straightforward when one is clearly normal and the other is grossly abnormal, but the visual binary paradigm breaks down in the presence of symmetric bilateral disease or mild unilateral disease. Therefore, absolute quantitative measurements may be useful to determine the presence and severity of hippocampal atrophy in both hippocampi accurately (Table 51.1).
While MRI is the only technique able to diagnose HS in vivo, qualitative and quantitative MRI may fail to detect mild HS that is subsequently found on histopathologic examination. The hippocampal MRI abnormalities in MTLE HS can be bilaterally symmetric, but more often are unilateral or clearly asymmetric. Brain MRI also frequently shows abnormalities of volume (atrophy) and signal (T2 increase or T1 decrease) in structures outside of the hippocampus, usually ipsilateral to the sclerotic hippocampus (Cendes et al., 2014).
More detailed high-resolution quantitative MRI analysis reveals a network of gray-matter atrophy that involves mesial temporal and other structures interconnected with the limbic system, including amygdala, entorhinal, perirhinal, and parahippocampal cortices, and thalamus (Coan et al., 2014).
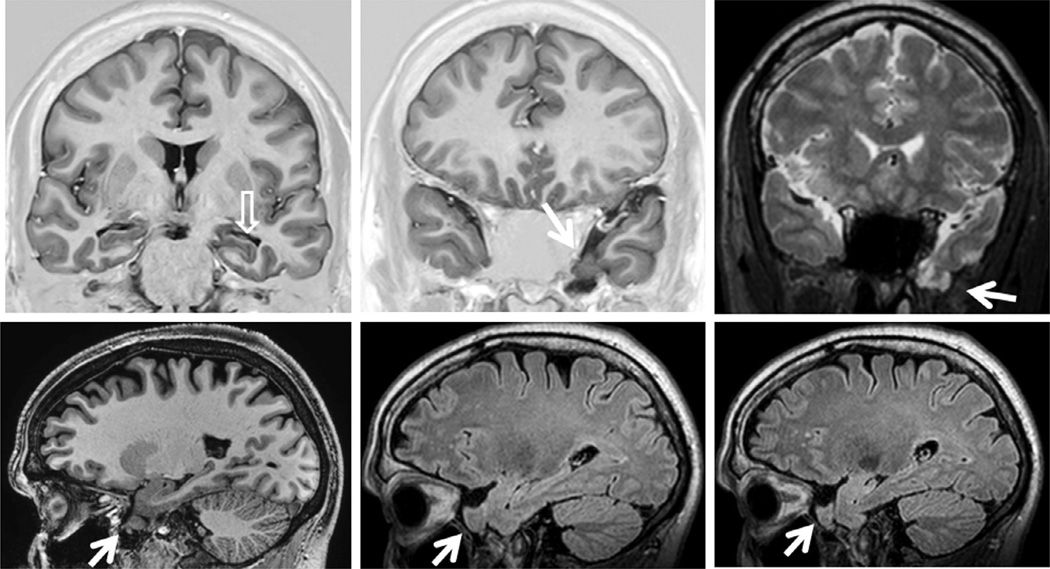
MRI is highly sensitive and specific in detecting lesions that cause TLE and may have similar clinical manifestations as MTLE HS, such as tumors, dysplasias, vascular malformations and other lesions, such as temporal-lobe encephaloceles (Fig. 51.7) (Saavalainen et al., 2015).
Fig. 51.7.
Coronal T1-weighted inversion recovery and T2-weighted images (top) and sagittal T1-weighted and fluid-attenuated inversion recovery images showing a small left anterior temporal encephalocele (arrows) and a left hippocampus with an abnormal shape and loss of internal structure (open arrow), in a patient with left temporal-lobe epilepsy.
EPILEPSY DUE TO NEOCORTICAL LESIONS
MRI investigation will detect most common lesions causing neocortical epilepsy, which are: low-grade tumors, malformations of cortical development, posttraumatic and postischemic lesions, inflammatory infectious scars, cavernous malformations, and arteriovenous malformations. However, routine MRI may be unremarkable, particularly in some forms of malformations of cortical development. In these cases, multimodal imaging techniques can be useful for localizing suspected lesions. Among the multimodal imaging, interictal fluorodeoxyglucose positron emission tomography (FDG-PET), ictal single-photon emission computed tomography (SPECT), ictal/interictal subtraction of SPECT scans, PET/MRI coregistration, multiplanar reconstruction, and curvilinear reformatting represent noninvasive methods to evaluate patients with focal seizures (Salamon et al., 2008; Hong et al., 2014; Perissinotti et al., 2014).
Subtle structural lesions can be missed in patients with neocortical TLE or extratemporal epilepsy. Therefore, MRI should be performed with adequate protocols evaluated by professionals with experience in epilepsy workup (Von Oertzen et al., 2002). Correlation with semiology, EEG, and structural and functional imaging data is essential (Gaillard et al., 2011).
The ideal sequence for the acquisition of MRI should be the one that results in excellent spatial resolution and contrast in a short period of time. Unfortunately, these goals are mutually exclusive due to limitations imposed by the physical principles of MRI. The images must include T1- and T2-weighted sequences covering the entire brain in at least two orthogonal planes, with minimum thickness allowed by the machine used. The injection of contrast (gadolinium) is not routinely necessary but can be useful in situations when the images without contrast are not sufficient for diagnosis or if a tumoral or inflammatory lesion is suspected. The ideal MRI in patients with focal epilepsy should include a volumetric acquisition (3D) with thin sections (less than 2 mm) in order to enable the reconstruction of images on any plane (Table 51.2). Studies have shown that more methods of image reconstruction from 3D acquisitions allow a better evaluation of patients with discrete structural lesions, especially FCDs (Barkovich et al., 1995; Bastos et al., 1999; Bernasconi et al., 2011) (Figs 51.3, 51.4, and 51.6).
The use of appropriate MRI protocols targeted for the study of patients with epilepsy provides the diagnosis of the majority of patients with lesional epilepsy. However, in a considerable number of patients, the MRI is considered normal. Although the etiology remains unclear in these cases, the disorders of cortical development, mainly FCD, are the most likely pathologic substrates. The effort involved in trying to increase the detection of these “invisible” lesions involves the improvement of signal-to-noise ratio and contrast of structural imaging techniques and imaging postprocessing (Bernasconi et al., 2011). Among the techniques used to implement image quality, two methods are highlighted: the use of higher magnetic fields (e.g., 3 T or higher) and surface coils or coils with a higher number of channels (e.g., 32-channel coils, instead of the most often used eight-channel coils) (Knake et al., 2005; Zijlmans et al., 2009).
MRI IN MALFORMATIONS OF CORTICAL DEVELOPMENT
Focal cortical dysplasia
Refractory epilepsy, particularly in childhood, is often associated with malformations of cortical development, especially FCD. Many patients have seizures refractory to medication and are candidates for surgical treatment. However, not all patients with malformations of cortical development present with refractory epilepsy (Barkovich et al., 2012).
FCD is characterized by disorganization of the cortical lamination associated with bizarre (dysplastic) neurons or cells with eosinophilic cytoplasm and increased volume (ball cells) (Taylor et al., 1971). FCD may be evidenced by MRI examinations as areas of cortical thickening, loss of the interface between white and gray matter, focal atrophy, and hyperintense signal in T2/ FLAIR sequences (Figs 51.3–51.6).
In the current classification, FCDs are subdivided into three types: type I (no dysmorphic neurons or balloon cells); type 2 (presence of dysmorphic neurons with or without balloon cells); and type 3 (FCD associated with another lesion): these in turn have subdivisions (Blumcke et al., 2011).
FCD type I (Fig. 51.3) may present with mild hyperintensity of the white matter in T2/FLAIR with loss of gray–white-matter differentiation, but in many patients MRI does not show abnormalities in the white matter. It may present with mild focal increase in cortical thickness and abnormal gyrus in shape and deep sulci, but it may also be associated with focal volume loss and thin cortex, in particular when the temporal lobe is affected.
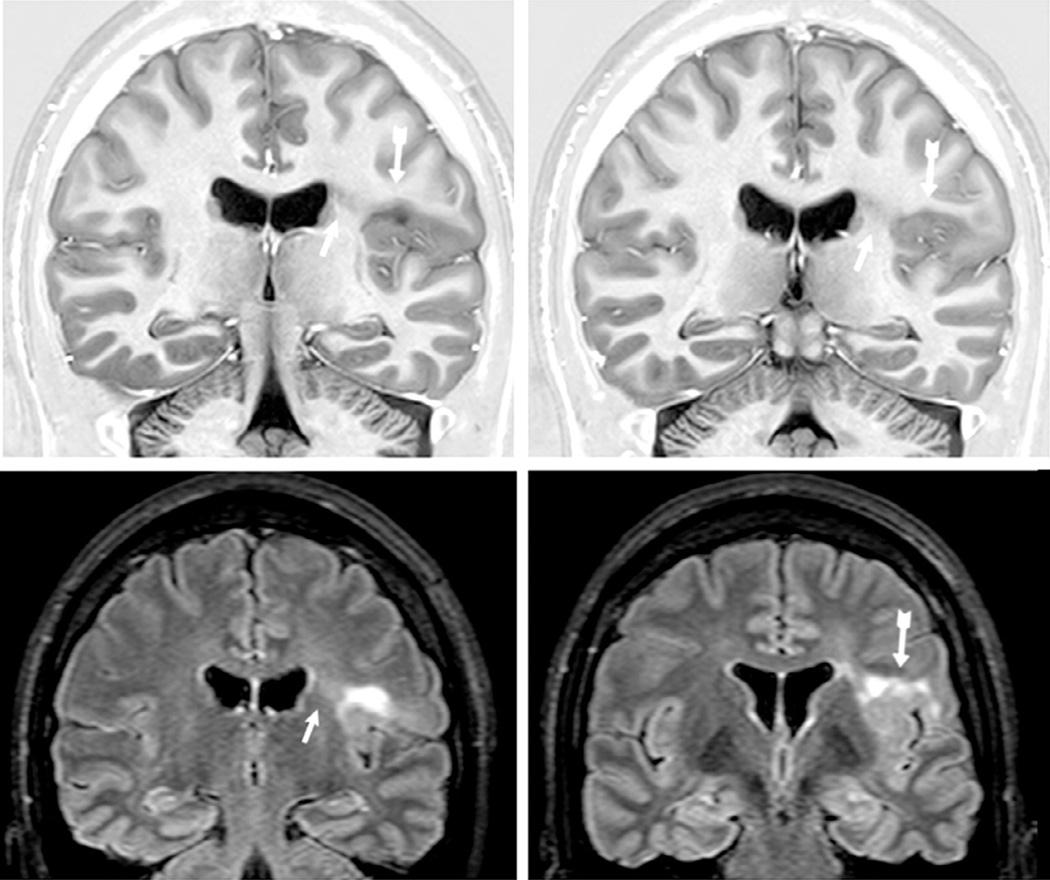
FCD type II presents with a gradient of morphologic changes, from dysplastic lesions that can be easily identified by conventional MRI techniques to minor structural abnormalities, including small areas of discrete cortical thickening and/or blurring of the gray–white-matter interface that often go unrecognized. Sometimes it shows subtle hyperintense T2 signal in the subcortical and deep white matter. It is divided into two types. FCD type IIA has dysmorphic neurons without balloon cells in the histopathology and the alterations on MRI are often discrete and without hyperintense signal in FLAIR (Fig. 51.4). FCD type IIB, or FCD with balloon cells, or Taylor-type dysplasia, is characterized by areas of thickening of the cortex on MRI, with blurring of the differentiation between the gray–white-matter interfaces, deep sulci, and abnormal cortical gyration. Its main MRI feature is hyperintense T2 FLAIR signal in the subcortical white matter with a wedge shape that extends to the ipsilateral ventricle ependymal surface (transmantle sign) (Blumcke et al., 2011) (Fig. 51.5). Sometimes the lesion is localized only in the bottom of the sulcus (Fig. 51.6).
Fig. 51.5.
Coronal T1 inversion recovery and axial fluid-attenuated inversion recovery (FLAIR) images showing typical changes of focal cortical dysplasia type IIB (arrows) confirmed by postoperative histopathology in a patient with refractory focal seizures with temporal-insular semiology. Note area of cortical thickening and loss of sharpness of the cortical-subcortical transition and cortical-subcortical signal changes (increased FLAIR signal and decreased T1 signal) below the area of cortical thickening that extends toward the ventricle (“transmantle” sign).
Other malformations of cortical development associated with epilepsy
Polymicrogyria is one of the most common malformations of cortical development, characterized by excessive small and prominent convolutions separated by shallow sulci. It appears to be caused by a variety of mechanisms and often is associated with other malformative lesions such as cerebellar hypoplasia, callosum agenesis, and periventricular nodular heterotopia, among others (Barkovich et al., 2012). Polymicrogyria is not always associated with epilepsy, and in those patients with epilepsy the seizures are often well controlled with medication (Montenegro et al., 2007).
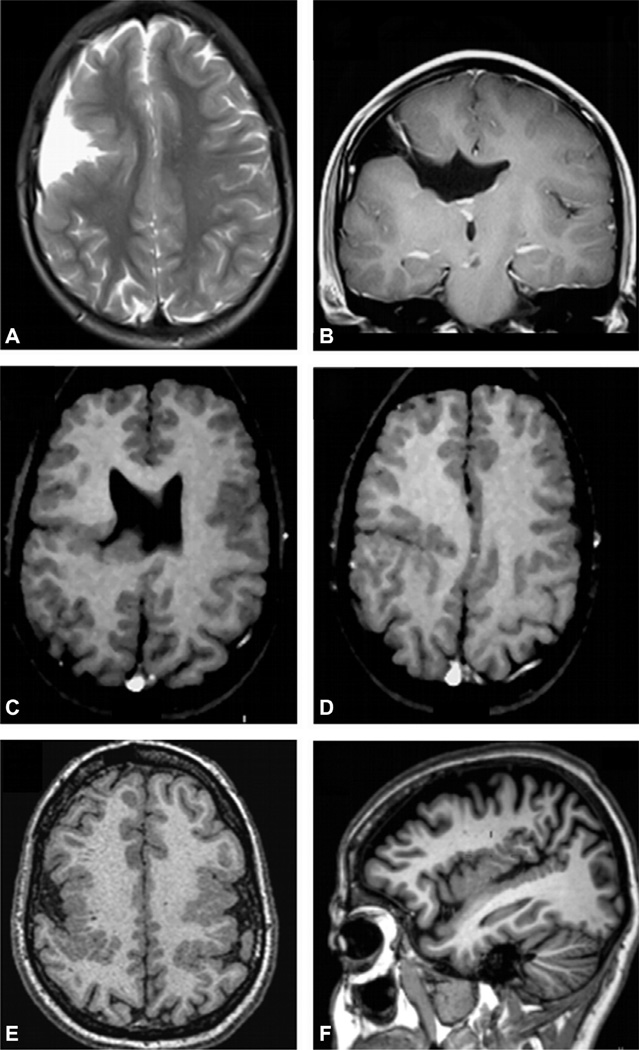
Polymicrogyria is characterized by developmental abnormalities where cortical neurons achieve the cerebral cortex, but are distributed abnormally, resulting in abnormal small gyri that may appear as thickened cortex if the MRI is acquired with low resolution and thick cuts (Barkovich et al., 2012) (Fig. 51.8).
Fig. 51.8.
Open-lips (A, B) and closed-lips (C, D) schizencephaly; bilateral perisylvian polymicrogyria (E, F).
Schizencephaly is characterized by a cleft that connects the cortical surface with the ventricular lumen. At its edges, the cortical tissue is usually abnormal (polymicrogyria). When the edges are juxtaposed it is called closed-lips schizencephaly, and open-lips schizencephaly when the edges are separated (Barkovich et al., 2012) (Fig. 51.8).
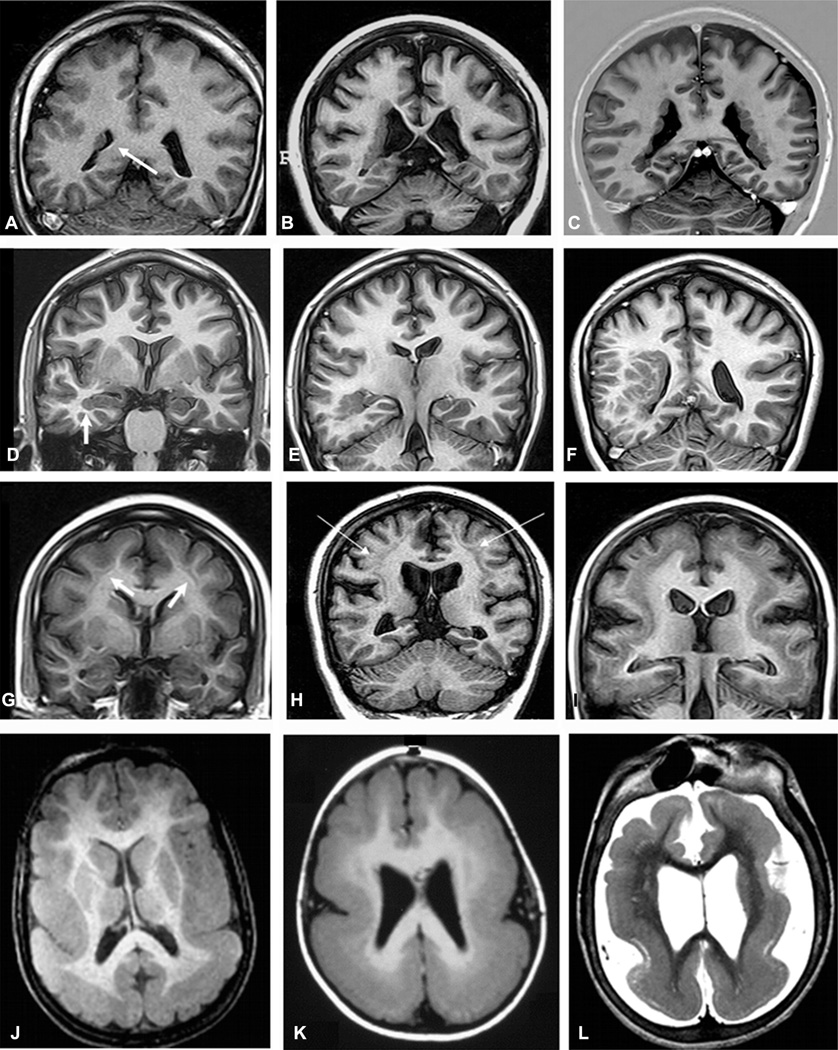
Periventricular nodular heterotopia is characterized by clusters of ectopic neurons and can be located at the periventricular areas (subependymal). These nodules consist of mature neurons and glial cells, without well-defined lamellar organization (Fig. 51.9). The subcortical nodular heterotopia is characterized by nodules of ectopic gray matter, which vary in number and size, sometimes in the posterior peritrigonal region (vascular border zone), and may extend toward the white matter, compromising the adjacent neocortex (Pisano et al., 2012). The subcortical laminar heterotopia (double cortex) is characterized by a continuous or semicontinuous ectopic band of gray matter below the cortical mantle (Blumcke et al., 2011) (Fig. 51.9).
Fig. 51.9.
Unilateral periventricular nodular heterotopia (PNH) (A: arrow) with polymicrogyria in the adjacent cortex; two different patients with bilateral PNH (B, C); a patient with PNH in the right temporal horn of the ventricle (D: arrow) and a large subcortical heterotopia extending to the posterior quadrant of the brain (E, F); three patients with different thickness of subcortical laminar heterotopia (double cortex), from thin and discontinuous bands (G) to continuous bands (H, I); three patients with different degrees of lissencephaly–agyria–pachygyria complex, from pachygyria (J), posterior agyria and anterior pachygyria (K), to diffuse lissencephaly (L).
Lissencephaly-agyria-pachygyria and subcortical laminar heterotopia represent extremes in the spectrum of the same entity that results from the arrest of the neuronal migration process. In lissencephalyagyria-pachygyria the brain has a limited number of gyri and sulci, resulting in shallow sulci and large gyri with thickened cortex or an almost complete absence of sulci in lissencephaly (Barkovich et al., 2012) (Fig. 51.9).
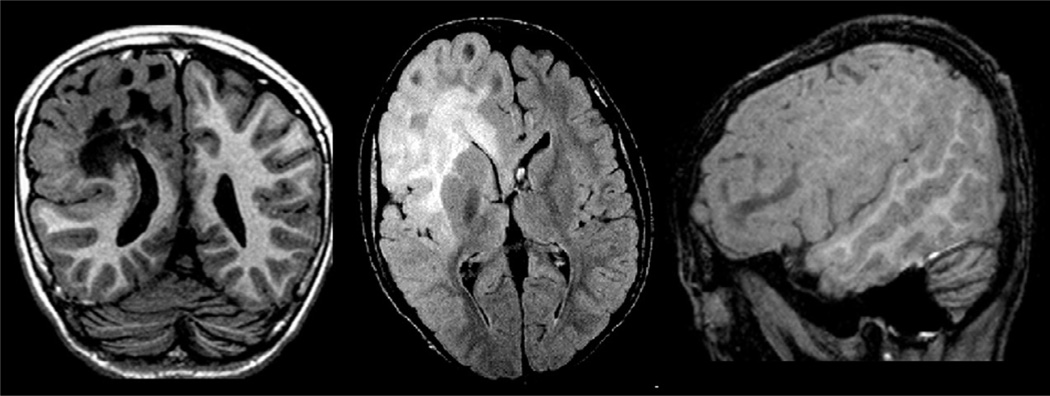
Hemimegalencephaly is characterized by hamartomatous growth of part or all of the cerebral hemisphere. This is visualized on MRI as hemispheric enlargement, often associated with ipsilateral ventricular dilatation and clearly abnormal signal in the white matter (hyperintense in T2/FLAIR and hypointense in T1-weighted images) (Fig. 51.10). In addition, there are often areas of pachygyria, polymicrogyria, heterotopia, FCD, and gliosis of the underlying white matter (Barkovich et al., 2012).
Fig. 51.10.
Coronal T1-weighted inversion recovery, axial fluid-attenuated inversion recovery (FLAIR), and T1-weighted sagittal images in a patient with right hemimegalencephaly, more intense in the frontal region. Note the abnormal signal in the white matter of the affected hemisphere (hypointense on T1-weighted and hyperintense on FLAIR images), areas of pachygyria and hemispheric enlargement. Periventricular nodular heterotopia is also present (coronal image).
Tuberous sclerosis
Tuberous sclerosis is a phakomatosis with dysplasias and hamartomas affecting the brain. It may be sporadic or hereditary, with an autosomal-dominant pattern of inheritance, and often causes pharmaco-resistant seizures that start as infantile spasms in the first months of life. MRI features includes cortical tubers that may be indistinguishable from FCD type II, subependymal calcified nodules and subependymal giant cell astrocytoma (Koh et al., 2000).
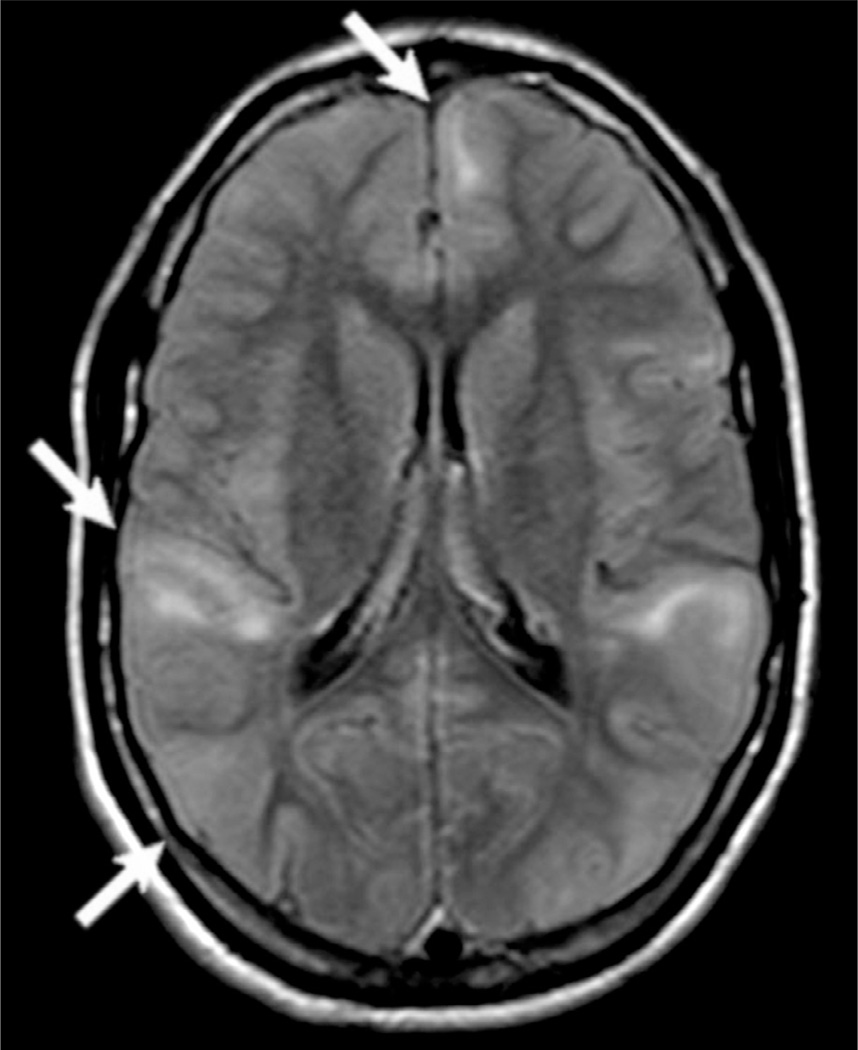
The cortical hamartomas or “tubers” are the most characteristic lesions in tuberous sclerosis complex and these may be related to focal seizures, oftentimes refractory to AEDs; however, not all tubers are epileptogenic. Cortical hamartomas appear as dark lesions on CT with broadened gyri in young children, but these tubers may be difficult to identify on CT in adults, unless they are calcified. The MRI appearance of tubers also changes with myelination. In neonates, they are hyperintense on T1 and hypointense on T2-weighted images compared to the surrounding white matter. In older children, they are hyperintense on T2-weighted images with poorly defined borders (Fig. 51.11) (Barkovich et al., 2012).
Fig. 51.11.
Multiple cortical tubers (arrows) in a fluid-attenuated inversion recovery image in a patient with tuberous sclerosis and epilepsy.
Sturge–Weber syndrome
Sturge–Weber syndrome (SWS), also called encephalotrigeminal angiomatosis, is a rare neurocutaneous phakomatosis, characterized by capillary-venous malformations involving skin and brain that may be associated with other types of brain malformation and epilepsy (Fig. 51.12). SWS classically presents with: unilateral (less frequently, bilateral) facial nevus, with a port-wine patch appearance typically located in the trigeminal nerve innervation regions; dural and leptomeningeal angiomatosis more often in the occipital and posterior parietal lobes; hemangiomas of the choroid; and congenital glaucoma (Osborn et al., 2010; Wang et al., 2015).
Fig. 51.12.
Axial T2-weighted (A), susceptibility-weighted imaging (SWI) (B) and postgadolinium T1-weighted (C) images, and coronal fluid-attenuated inversion recovery (D) and T1-weighted (E, F) images in a patient with Sturge–Weber syndrome and epilepsy. Note the dural and leptomeningeal angiomatosis involving the right occipital and posterior temporal regions (arrows) which are best seen in the SWI (B). There is an associated right hippocampal sclerosis (open arrows), and an atrophy of the right temporal-occipital region.
Long-term epilepsy-associated tumors
Long-term epilepsy-associated tumors (Blumcke et al., 2014) are identified in about 20–30% of patients operated on for refractory epilepsy. These types of tumor may encompass gangliogliomas, dysembryoblastic neuroepithelial tumors, pleomorphic astrocytomas, diffuse astrocytomas, oligodendrogliomas, and a few anaplastic tumors. They can occur in any part of the brain, but preferentially affect the temporal-lobe region. These tumors usually present with slow growth, and the main clinical feature is epilepsy (Blumcke et al., 2014). Typical MRI features are characterized by cystic alterations with or without calcification. Mural nodules can be enhanced after gadolinium injection. However, other MRI findings are associated with these tumors depending on the histologic type (Thom et al., 2012).
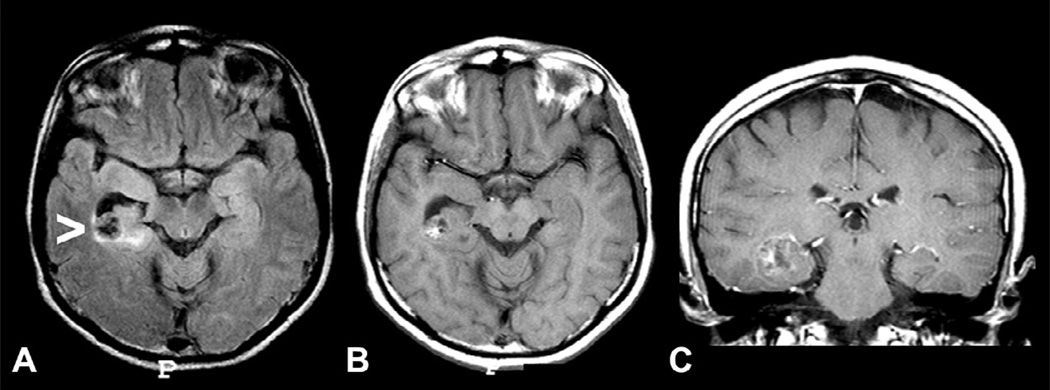
Gangliogliomas (Fig. 51.13), oligodendrogliomas (Fig. 51.14), and dysembryoplastic neuroepithelial tumors (DNT) are frequently located in the temporal lobe, may be associated with FCD (Fig. 51.15), and theirmost common clinical manifestation is epilepsy.
Fig. 51.13.
Coronal magnetic resonance imaging (MRI) showing ganglioglioma in three patients with temporal-lobe epilepsy and seizures not responding to antiepileptic drugss who became seizure-free after surgical resection of the lesion. (A) T1 inversion recovery image showing a small ganglioglioma in the right collateral sulcus (arrow) which was previously missed on an MRI without thin coronal cuts. (B) T2-weighted image showing a ganglioglioma in the left amygdala. (C) Axial T1-weighted and (D) coronal T2-weighted images showing a ganglioglioma in the left uncal region with cystic and solid components.
Fig. 51.14.
Axial fluid-attenuated inversion recovery (FLAIR) (A) and T1-weighted (B) images and postgadolinium coronal T1-weighted image (with a slight peritumoral enhancement (C) in a patient with temporal-lobe epilepsy due to oligodendroglioma in the right temporal horn of the ventricle adjacent to the hippocampus. The area with hypointense signal on FLAIR (arrow) and T1 images corresponds to a small calcification seen on computed tomography scan.
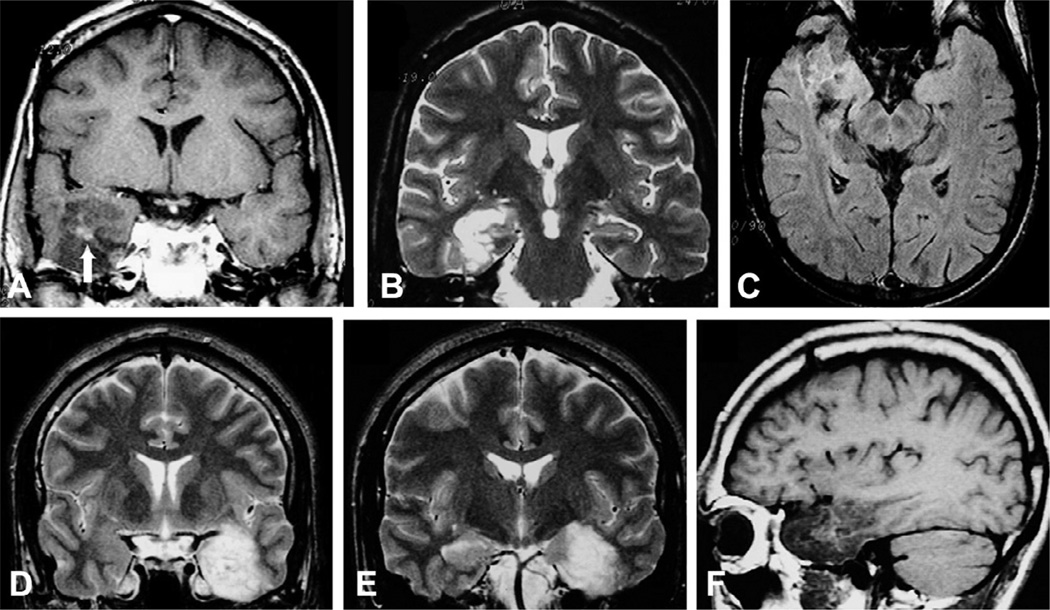
Fig. 51.15.
(A–C) T1 postgadolinium, T2-weighted coronal and axial fluid-attenuated inversion recovery images showing a dysembryoplastic neuroepithelial tumor (DNT) associated with focal cortical dysplasia (confirmed in the postoperative histopathology) in the right temporal lobe in a 23-year-old patient with refractory partial seizures since the age of 9 years, who became seizure-free after lesionectomy. Note a small area of intratumoral contrast enhancement (A: arrow), and the classic heterogeneous aspect of the tumor in all magnetic resonance imaging (sequences, sometimes given the appearance of small microcysts inside the lesion. (D–F) Coronal T2-weighted and sagittal T1-weighted images showing a DNT in the left temporal lobe in a patient with seizures since childhood who became seizure-free after lesionectomy.
Gangliogliomas usually have clear limits, hypointense on T1- and hyperintense on T2-weighted images. Contrast enhancement is variable, from absent to intense, and may present with annular pattern. Gangliogliomas should be considered when a poorly defined, slightly enhancing mass is present in the temporal lobes (Fig. 51.13).
Oligodendrogliomas are nonspecifically hypointense on T1-weighted and hyperintense on T2-weighted MR images. Occasionally, foci of increased signal on T1-weighted images reflect intratumoral hemorrhage (Fig. 51.14). Enhancement on CT or MR is variable. On CT, calcifications are expected and may be shell-like, ring-like, or nodular.
DNTs are hypodense on CT scan and may show calcifications. Close to one-third of cases show contrast enhancement. On MRI, the lesion is often limited to the cortex, hypointense on T1 and hyperintense on T2/FLAIR sequences. There is no peritumoral edema or mass effect and there may be variable contrast enhancement (Fig. 51.15).
The differential diagnosis of these low-grade tumors in adults primarily includes other gliomas, particularly astrocytoma. In children, astrocytoma, ganglioglioma/gangliocytoma, neuroblastoma, or other primitive neuroectodermal tumors could have a similar imaging appearance (Osborn et al., 2010). In addition, some long-term epilepsy-associated tumors may present on MRI with features resembling FCD type IIB (Fig. 51.16).
Fig. 51.16.
Axial T1-weighted and double inversion recovery (DIR), and three-dimensional fluid-attenuated inversion recovery (FLAIR) curvilinear reconstruction showing a left superior frontal gyrus lesion with hyperintense FLAIR signal and blurred cortical-subcortical interface in a 6-year-old girl with refractory frontal-lobe epilepsy. Postoperative histopathology showed an angiocentric glioma (a rare grade I glioma).
Cavernous malformations
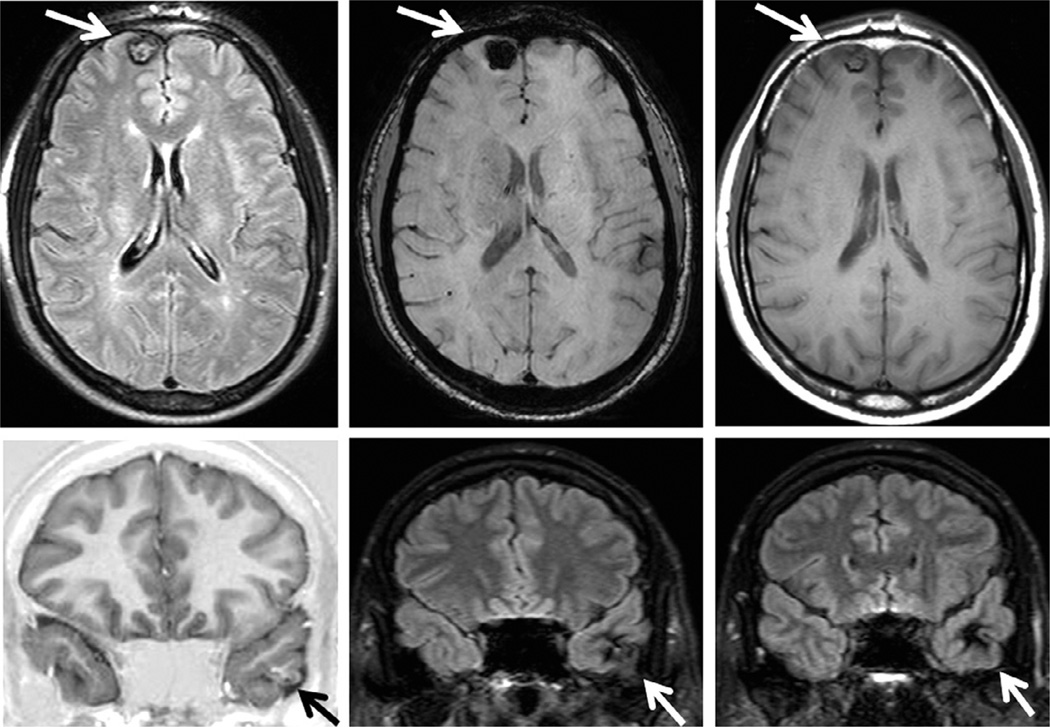
Cerebral cavernous malformations, also known as cavernomas, are a well-defined epilepsy-associated pathology. They represent conglomerates of abnormally configured vessels leading to seizures (Fig. 51.17).
Fig. 51.17.
Axial fluid-attenuated inversion recovery (FLAIR), susceptibility-weighted imaging (SWI), and T1-weighted images in a patient with a cavernoma (arrows) and right frontal epilepsy (top) and coronal T1-weighted inversion recovery and FLAIR images in a patient with left temporal-lobe epilepsy due to a cavernoma (bottom). Note the classic hypointense signal surrounding the lesion on FLAIR and T1-weighted images.
Destructive brain insults in early life
Destructive brain lesions of early development include a wide variety of congenital, perinatal, and postnatal acquired neuropathologic conditions that have in common tissue necrosis of a previously normally formed brain, and constitute an important cause of neurologic morbidity (Barkovich and Truwit, 1990; Teixeira et al., 2003).
Different topographic and morphologic patterns of brain lesions are recognized depending on the nature of the insult, its severity, and the period of development in which it occurs. It has long been known that certain regions of the brain are more vulnerable than others when the whole brain is submitted to an insult (e.g., diffuse hypoperfusion, status epilepticus) and this can be connoted by the term regional selective vulnerability. The hippocampus is considered one of these vulnerable regions (Barkovich and Truwit, 1990; Teixeira et al., 2003). Epilepsy is a common long-term sequel of those precocious destructive lesions, often presenting with intractable seizures (Teixeira et al., 2003) (Fig. 51.18).
Fig. 51.18.
Axial and coronal images from four patients with perinatal insults and epilepsy. (A) and (E) show hemiatrophy (right hemisphere); (B) and (F), a large left middle cerebral artery infarct; (C) and (G), a bilateral occipital gliosis and atrophy; and (D) and (H), porencephaly in the territory of the left middle cerebral artery. Note that all four patients have severe hippocampal atrophy, and in (H), hyperintense T2 signal ipsilateral to the main lesion.
There are several neuropathologic terms to designate these early-life destructive lesions, including porencephaly, encephalomalacia, ulegyria, hemiatrophy, and leukomalacia.
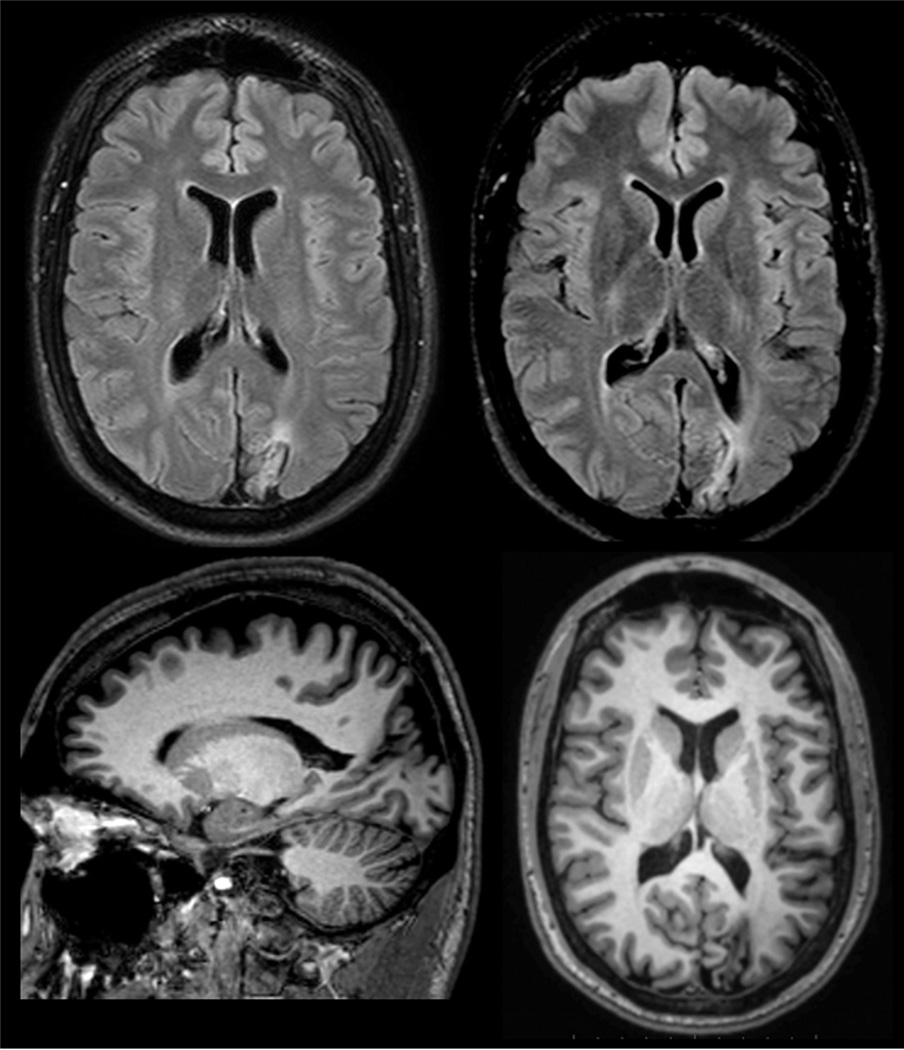
Destructive lesions in early life are sometimes associated with cortical dsysplasia, which is classified as FCD type III (Blumcke et al., 2011) (Fig. 51.19).
Fig. 51.19.
Fluid-attenuated inversion recovery (FLAIR) and T1-weighted images showing an area of gliosis (best seen in the FLAIR images) and ulegyria (best seen in the sagittal image) in the left occipital region in a patient with refractory occipital epilepsy. Postoperative histopathology showed an area of focal cortical dysplasia and a gliotic scar tissue.
Hypothalamic hamartomas
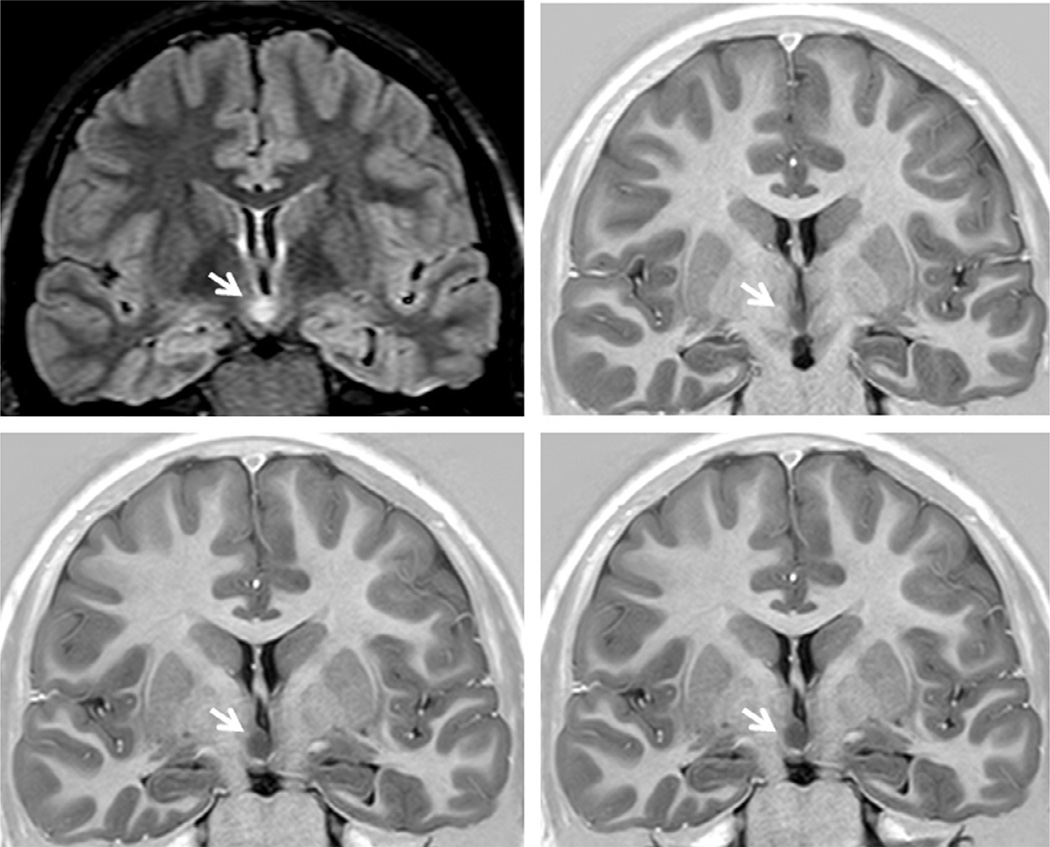
Hypothalamic hamartomas are rare but well-recognized developmental malformations that are classically associated with gelastic seizures and other refractory seizure types. Patients commonly exhibit debilitating cognitive, behavioral, and psychiatric disturbances. The lesion is hypointense on T1-weighted and variably hyperintense on T2-weighted and FLAIR images (Fig. 51.20) (Mittal et al., 2013).
Fig. 51.20.
Coronal fluid-attenuated inversion recovery and T1-weighted images showing a hypothalamic hamartoma (arrows) in a patient with gelastic seizures.
Rasmussen encephalitis
Rasmussen syndrome is a progressive disorder, predominantly with childhood onset and characterized by intractable epilepsy, hemiparesis, and neurologic decline. Rasmussen syndrome is a rare immune-mediated reaction for which an etiology has yet to be determined (Andermann, 1991).
MRI in Rasmussen’s encephalitis shows progressive atrophy of one of the cerebral hemispheres, usually beginning in the opercular region. Many times the cortex presentshy perintense signal on T2 and FLAIR sequences (Fig. 51.21).
Fig. 51.21.
Axial T2-weighted (A), coronal T1-weighted inversion recovery (B), fluid-attenuated inversion recovery (FLAIR), axial (C), and coronal (D) images from two patients with Rasmussen’s encephalitis (A, B and C, D respectively) involving the right hemisphere. The progressive atrophy usually involves initially the insular-opercular regions, as seen in these patients. Sometimes, multiple cortical and subcortical foci of hyperintense FLAIR signal may be present, even in the initial stages of the disease, as in the patient shown in (C) and (D).
DIFFUSION TENSOR IMAGING AND TRACTOGRAPHY
DTI data provide information regarding the direction of the diffusion of water in each voxel, which can be used to estimate the orientation of white-matter tracts. Based on this information, it is possible to trace major myelinated tracts (tractography), offering additional information for surgical approach; for example, it can be used for visualization of the optic radiation and for predicting visual field deficits after surgery (Winston et al., 2011). In addition, DTI allows other quantitative data to be obtained, such as fractional anisotropy, diffusivity, and connectivity indices, which can indicate integrity or subtle lesions of white matter that have research applications.
MAGNETIC RESONANCE SPECTROSCOPY (MRS)
Proton-MRS assesses neuronal integrity by quantifying the peak of N-acetyl-aspartate (NAA), a marker of neuronal integrity, usually by comparing its concentrations with choline or creatine peaks. Unlike MRI, SPECT, and PET techniques, the entire brain is not included in typical MRS measurements and often only a few relatively large voxels are sampled with proton MRS (Cendes et al., 2002). The relatively poor signal-to-noise ratio of proton MRS and the relatively long time required to obtain spectra makes this technique of limited clinical use.
Comparisons with EEG localization and surgical results have demonstrated that the reduced signal intensity of NAA can lateralize and localize the epileptogenic focus in patients with focal epilepsy, especially MTLE. However, these changes are often bilateral in patients with MTLE. Moreover, the relative concentration of NAA can normalize after successful surgery for MTLE (Cendes et al., 2002).
POSITRON EMISSION TOMOGRAPHY
The role of PET, particularly using 18F-FDG, is well established. In addition to seizure focus localization, PET has been used for cognitive studies (now superseded by functional MRI), investigation of comorbidity, particularly psychiatric disorders, and investigations of neurotransmitter receptor binding. These studies may be important both for focus localization and understanding the pathophysiology of epilepsy. Coregistration with MRI has become standard for PET studies in epilepsy. Simultaneous image acquisition using PET/MR scanners may facilitate comparison of structural and functional images (Ding et al., 2014).
FDG-PET
Focal epilepsy
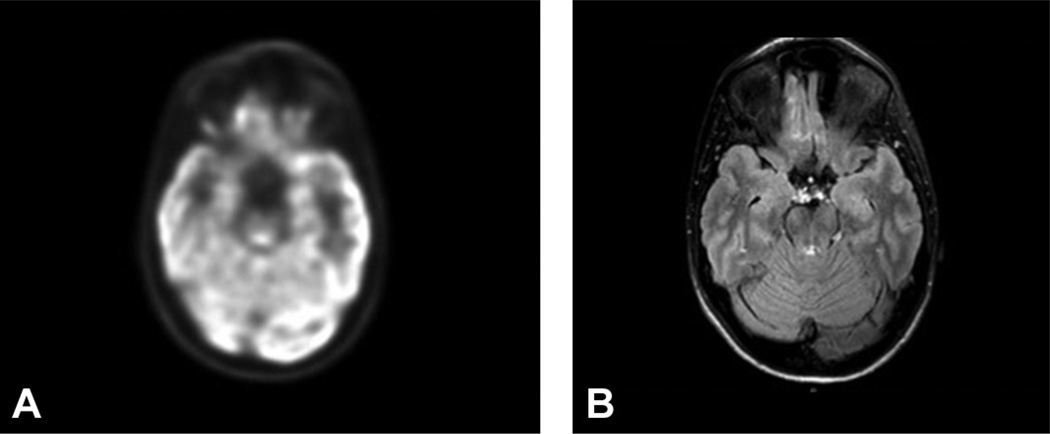
Depending on scanner resolution, sensitivity for detection of focal and regional hypometabolism in patients with TLE approaches 80% (Engel et al., 1982, 1990; Theodore et al., 1983; O’Brien et al., 2001) (Fig. 51.22). Specificity is more difficult to determine, since it can be based on agreement with one of several standards, including final electrographic localization of epileptogenic zones, or outcome from temporal lobectomy. The latter, of course, is itself subject to many factors, such as potential limitation of the extent of surgery due to the need to preserve cortex with functional importance. Thus, it can be difficult to determine the predictive value of FDG-PET for temporal lobectomy outcome. Willmann et al. (2007) performed a meta-analysis of 46 FDG-PET studies from 1992 to 2006; study design heterogeneity made it difficult to assess the overall results. PET hypometabolism alone was thought to have a predictive value of 86% for “good” outcome (not always equivalent to being seizure-free), but not to improved accuracy for seizure focus localization or surgery outcome in patients with congruent ictal scalp EEG and MRI localization.
Fig. 51.22.
(A) Right temporal focal hypometabolism seen on 18F-fluorodeoxyglucose positron emission tomography in a patient with normal magnetic resonance imaging (MRI) scan and right temporal seizure onset on ictal video-electroencephalogram monitoring. (B) MRI in the same patient.
The increasing sensitivity of structural MRI may reduce the role of FDG-PET in presurgical evaluation. Some investigators suggest that, when temporal hypometabolism extends beyond the limits of an MRI lesion such as mesial temporal sclerosis (MTS), wider resection may improve outcome (Vinton et al., 2007). However, hypometabolism that is not contiguous with, or distant from, the seizure focus, as opposed to perifocal hypometabolism, may be a negative prognostic factor in patients with both mesial temporal and neocortical electrographic seizure onsets (Wong et al., 2010, 2012). Bitemporal hypometabolism is associated with less-well-localized ictal epileptiform onset and may be a negative surgical prognostic indicator (Koutroumanidis et al., 2000; Joo et al., 2004; Kim et al., 2006). Patients with TLE and enlarged amygdala, but not MTS, have been reported to have ipsilateral hypometabolism (Lv et al., 2014).
Some studies suggest that quantitative methods for determination of hypometabolism may be more accurate than visual analysis for prediction of surgical outcome (Theodore et al., 1992a; Kim et al., 2003), while others have found visual assessment by consensus of expert readers more accurate than approaches such as statistical parametric mapping (van’t Klooster et al., 2014).
Several studies have shown that, when focal FDG-PET hypometabolism is present, but MRI is normal, patients’ surgical outcome is equivalent to those with clear MRI lesions; pathologic findings may not be as well defined in MRI-negative PET-positive patients as in MRI-negative patients (Carne et al., 2004; LoPinto-Khoury et al., 2012; Gok et al., 2013; Yang et al., 2014). In a study of 158 patients with normal MRI, 12 with subtle MRI abnormalities and 24 with discordant noninvasive data, FDG-PET was normal in 37%, showed unilateral hypometabolism in 51%, and bilateral hypometabolism 12%, leading to surgery in 6%, helped planning invasive EEG in 35%, and excluded surgery in 12% (Rathore et al., 2014). PET was more useful in patients with TLE (63%) than frontal- (38%) or extratemporal-lobe epilepsy (50%). Previous studies reported similar results (Swartz et al., 2002).
In frontal-lobe epilepsy patients who showed good outcome after surgical resection, 73% of patients with, and 36% without, MRI structural lesions had focal hypometabolism (Kim et al., 2002). Reexamination of MRI images in patients with hypometabolism and normal MRI, particularly with neocortical or extratemporal foci, may show initially undetected subtle lesions such as FCD.
The correlation between the degree of mesial temporal neuronal loss and hypometabolism is limited, although studies may be limited by resolution (Henry et al., 1994; Foldvary et al., 1999). The physiologic basis for hypometabolism in the absence of MRI lesions is uncertain, perhaps related to decreased synaptic activity, impaired maintenance of membrane potential differences in hippocampal surface anatomy, or alterations in adjacent white-matter tracts on DTI (O’Brien et al., 1997; Theodore et al., 2001; Hogan et al., 2008; Lippé et al., 2012). In patients with FCD, data suggest that hypometabolism is associated with reduced mitochondrial complex IV function, but not degree of dysplasia (Tenney et al., 2014).
The degree of hypometabolism at seizure onset was a prognostic factor for poor AED response in some studies, particularly in children, but not others (Gaillard et al., 1995, 2002; Weitemeyer et al., 2005).
Nonfocal epilepsy syndromes
In patients with primary generalized absence, interictal metabolism imaged by PET was normal, and diffuse increases were seen during seizures (Engel et al., 1985; Theodore et al., 1985). Using oxygen-15-labeled water, global cortical as well as thalamic blood flow increases were found (Prevett et al., 1995). In Lennox–Gastaut syndrome, studies showed variable patterns of global or multifocal hypometabolism related to structural lesions, as well as underlying etiology (Chugani et al., 1987; Theodore et al., 1987). Some children with infantile spasms and normal structural MRI have hypometabolism in parieto-temporo-occipital cortex, associated with occult FCD or a variety of other malformations; FDG-PET imaging may help guide the resection strategy (Chugani et al., 1990, 1993, 2014). Some studies suggest that hypometabolism in these children may resolve spontaneously if seizures are controlled by medical therapy; persistent hypometabolism is of uncertain prognostic value (Itomi et al., 2002; Metsahonkala et al., 2002).
Potential confounders in PET localization studies
False lateralization occurs rarely and may be associated with unrecognized seizures, causing relative hypermetabolism, or prior depth electrode implantation, causing hypometabolism (Sperling et al., 1995). Large cortical malformations may have increased metabolism (Poduri et al., 2007). Recent seizure activity may produce altered patterns of metabolism on FDG-PET, as well as receptor imaging studies, persisting for several days (Leiderman et al., 1994; Savic et al., 1997). Hippocampal 11C-flumazenil (FMZ) binding was reduced when patients had shorter intervals since their last seizure (Bouvard et al., 2005). Bilateral temporal hypometabolism may be more common on scans performed within 2 days of a seizure (Tepmongkol et al., 2013).
Neurotransmitter receptor studies and epilepsy pathophysiology
Several studies have investigated the role of P-glycoprotein transporters in the pathophysiology of epilepsy, and their relation to drug resistance. In a comparison of 14 pharmacoresistant patients, eight seizure-free patients, and 13 healthy controls, pharma-coresistant patients had higher P-glycoprotein activity than seizure-free patients in several temporal regions, both ipsilateral and contralateral to seizure foci (Feldmann et al., 2013). Higher P-glycoprotein activity was associated with higher seizure frequency. Seven patients with drug-resistant TLE (R)-11C had verapamil PET before and after temporal lobectomy (Bauer et al., 2014). Patients who became seizure-free off AEDs had higher preoperative ligand binding, temporal-lobe P-glycoprotein function before surgery, and reduced global postoperative binding of P-glycoprotein function postoperatively than those who did not become seizure-free off AEDs.
Some investigators have used α-11C-methyl-l-tryptophan (AMT) for differentiating epileptogenic from “silent” tubers in children with tuberous sclerosis. In 191 children, the number of tubers with increased binding correlated with duration of intractable epilepsy, with excellent agreement between ictal scalp EEG localization (Chugani et al., 2013). Fifty-eight percent of patients with nonlocalized EEG had localized AMT PET. A study of 126 tubers in 12 patients showed only two with clearly increased uptake; per-patient sensitivity in detecting tuber epileptogenicity was 17%; per-lesion sensitivity was 12%; specificity, however, was 100% (Rubi et al., 2013). Increased binding has been reported in patients with FCD, particularly type IIB (Chugani et al., 2011).
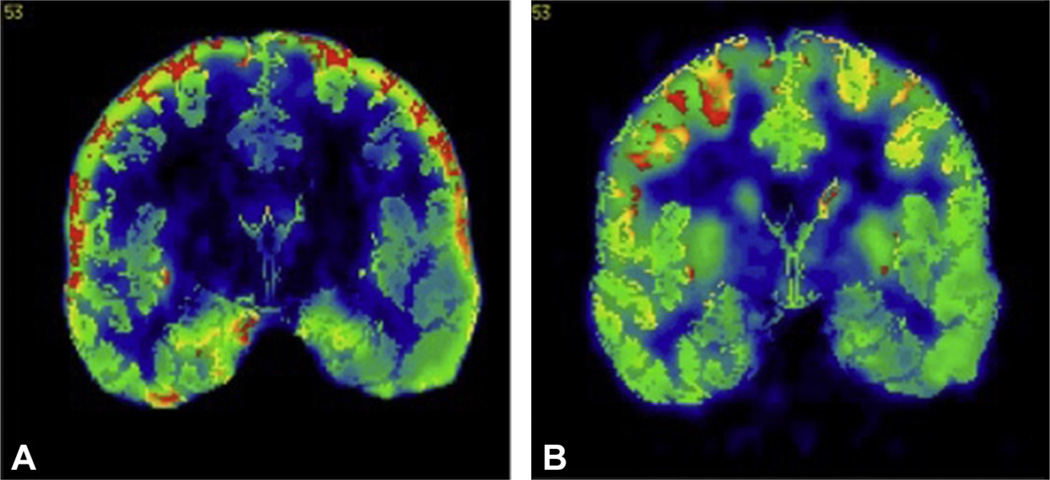
Studies using ligands for the serotonin (5HT)-1A receptor have found reduced binding in mesial temporal foci (Toczek et al., 2003; Merlet et al., 2004; Savic et al., 2004; Giovacchini et al., 2005). In combination with FDG-PET, 5HT-1A receptor imaging may help predict outcome after temporal lobectomy (Theodore et al., 2012a) (Fig. 51.23).
Fig. 51.23.
(A) 18F-FCWAY positron emission tomography (PET) scan showing reduced left temporal 5HT-1A receptor binding in a patient with a left temporal focus on ictal video-electroencephalogram monitoring. (B) 18F-fluorodeoxyglucose PET shows less clear focal hypometabolism in the same region.
FMZ PET has shown reduced binding ipsilateral to temporal-lobe foci in several studies, and occasionally may detect abnormal regions not found on FDG-PET, although few advantages in clinical utility have been shown (Savic et al., 1988; Henry et al., 1993; Burdette et al., 1995; Ryvlin et al., 1998). FMZ PET was more sensitive than FDG-PET for detection of neocortical seizure onset in children with extratemporal-lobe epilepsy (Muzik et al., 2000). Similar results have been obtained with 18F-flumazenil, which may be easier to use due to the longer ligand half-life (Vivash et al., 2013). Not all studies show consistent localizing value (Koepp et al., 2000). In patients with normal MRI, about 40% had reduced 11C-FMZ binding, a proportion similar to FDG-PET (Lamusuo et al., 2000). One group has found that increased periventricular FMZ binding may identify potentially epileptogenic heterotopias in patients with temporal-lobe foci and MTS, that may account in some cases for poor outcome after temporal lobectomy (Yankam-Njiwa et al., 2013). FMZ PET can also help elucidate the pathophysiology of epilepsy syndromes. In patients with succinic semialdehyde dehydrogenase deficiency, a disorder of gamma-aminobutyric acid (GABA) metabolism, reduced postsynaptic receptor binding was found, probably due to down-regulation related to increased synaptic GABA levels (Pearl et al., 2009).
Recent studies using PET ligands for the translocator protein 18 kDa, a marker of activated microglia and reactive astrocytes, have shown evidence for inflammation in epilepsy. Increased binding has been found in regions of perilesional edema in patients with cysticercosis and epilepsy (Fujita et al., 2013). Previous studies using 11C-PK-11195 had shown increased binding in a patient with Rasmussen’s encephalitis but not TLE (Banati et al., 1999). However, in a series scanned with a newer ligand, 11C-PBR28, brain uptake was significantly higher ipsilateral to the seizure focus in hippocampus and amygdala. This asymmetry was more pronounced in patients with HS than in those without (Hirvonen et al., 2012). A patient with FCD had increased binding colocalized with EEG and MR seizure focus localization (Butler et al., 2013). These data suggest a pathophysiologic role for inflammation in focal epilepsy syndromes.
A variety of other receptors, including mu, delta, and kappa opiate (Frost et al., 1988; Mayberg et al., 1991; Theodore et al., 1992b) H1-histamine (Iinuma et al., 1993), monoamine oxidase B (Kumlien et al., 2001), N-methyl-d-aspartatic acid (using 11C-ketamine) (Kumlien et al., 1999), muscarinic (Muller-Gartner et al., 1993) and nicotinic acetyl choline receptors (Brodtkorb et al., 2006), and dopamine (Bouilleret et al., 2005), have been studied in patients with epilepsy. These have been valuable for examining the pathophysiology of epilepsy, but have not made important contributions to clinical seizure evaluation. Impaired dopamine uptake was reported in the midbrain of patients with juvenile myoclonic epilepsy (Odano et al., 2012). A recent study showed increased availability of the neurokinin-1 receptor in TLE, mirroring studies in experimental models that suggest a role for substance P in epileptogenesis (Danfors et al., 2011).
Epilepsy comorbidities
Depression is one of the most common comorbidities of epilepsy, and contributes to reduced quality of life. Patients with epilepsy and depression are more likely to have ipsilateral or bifrontal hypometabolism (Bromfield et al., 1992; Victoroff et al., 1994; Salzberg et al., 2006). Paralleling results in patients with major depressive disorders, there is a strong correlation between depression in TLE and the extent of 5HT-1A binding reduction (Hasler et al., 2007; Theodore et al., 2007). PET studies using a ligand for the serotonin transporter as well as receptor binding showed relatively reduced transporter activity, in subjects with both TLE and depression, as compared to subjects with TLE alone, implying reduced reuptake and thus increased synaptic 5-HT availability, which may represent a compensatory mechanism for 5HT-1A receptor loss (Martinez et al., 2013). These data support the use of selective serotonin reuptake blockers in patients with epilepsy and depression.
Memory deficits are among the major comorbidities experienced by people with epilepsy. In patients with occipital-lobe epilepsy, poorer verbal memory and executive function were associated with left temporal lobe hypometabolism (Knopman et al., 2014). Left mesial temporal metabolism correlated with anterograde and retrograde memory in patients with transient epileptic amnesia (Mosbah et al., 2014). Reduced 5HT-1A receptor binding had an effect on verbal memory scores (after correction for partial volume effects) that was additive to the influence of hippocampal atrophy, and independent of depression scales (Theodore et al., 2012b).
Conclusion
FDG-PET should be performed in patients with focal epilepsy being considered for surgery, particularly when MRI is normal or shows nonspecific findings. PET is more likely to be helpful in patients with suspected temporal, particularly mesial temporal, rather than extratemporal foci. Receptor PET is primarily a research tool, although some ligands, such as 11C- or 18F-flumazenil, may be able to provide clinically useful data for a small number of patients.
The role of PET when a clear structural lesion is present needs further evaluation. Unfortunately, most studies have been relatively small, particularly when broken down by seizure focus location or lesion type. Prospective multicenter studies would have a much better chance of enrolling the numbers needed to determine the optimal use of PET at a time of increasing concern over the cost of medical care, and the realization that diagnostic resources often are overused. Although randomization may not be possible in the context of epilepsy surgery, clear guidelines have been developed that allow imaging studies to provide reasonably reliable evidence (Gaillard et al., 2011).
In order to detect seizure activity, which could lead to false relative hypo- or hypermetabolism, the best approach is to record EEG during the 30–40-minute FDG uptake period. If this is not possible, an observer with experience in epilepsy should watch the patient. EEG recording can be discontinued once the patient goes into the scanner. It is important to keep in mind that PET is not a diagnostic tool, and should not be used to support a diagnosis of a seizure disorder. Focal hypometabolism can be due to a variety of other conditions.
SINGLE-PHOTON EMISSION COMPUTED TOMOGRAPHY
SPECT has been proven as a useful tool in epileptogenic zone localization. The development of multimodal coregistration and also comparison of ictal SPECT images with a control group have ensured its clinical relevance. Ictal SPECT provides a unique window of opportunity to look at cerebral perfusion during seizure. Seizure activity dramatically increases brain metabolism and cerebral blood flow (CBF) in the epileptic focus during seizure initiation and propagation. Intravenous injection of radiotracer makes it possible to measure local differences in CBF.
Epileptogenic zone localization
In drug-resistant focal epilepsy localization of the epileptogenic zone is required for surgical planning prior to a focal cortical resection (Wiebe et al., 2001). The site of seizure onset may be difficult to determine with scalp-recorded EEG in patients with nonlesional focal seizures or when preoperative evaluation reveals conflicting findings between the EEG and MRI studies. SPECT may be an important neurodiagnostic study in patients being considered for epilepsy surgery.
Interictal perfusion changes
Increased neuronal activity leads to an increase in CBF. This effect has also been observed under ictal and interictal conditions. The area producing interictal discharges, often wider than the epileptogenic zone, is called the irritative zone. Therefore, interictal and ictal activities may be generated by distinct brain regions, where they presumably depend on different neuronal populations and possibly distinct signaling systems.
In MTLE, cerebral perfusion patterns suggest interictal hypofunction and ictal activation of the corticothalamo-hippocampal-insular network and ictal hypoperfusion of the anterior frontal cortex (Tae et al., 2005). Although it is possible to analyze interictal SPECT images, it usually only serves as a baseline study in further analysis, as these studies have a low sensitivity and high false-positive rate (Zubal et al., 1995).
Ictal perfusion changes
Ictal perfusion changes can be further divided into pregeneralization, i.e., before the widespread propagation associated with a tonic-clonic seizure, generalization, and postictal. In a study using optical imaging, preictal hemodynamic changes occurring seconds before epileptic seizures have also been described (Patel et al., 2013). Because of the relatively low temporal resolution of SPECT due to the combination of time-to-injection and time-to-uptake delays, ictal SPECT usually shows a characteristic ictal hyperperfusion pattern, often containing both the ictal onset zone and propagation with a multilobular hourglass appearance (Van Paesschen et al., 2007).
The tracer is administered intravenously, is rapidly taken up with an estimated peak brain uptake of 30 seconds, and is not redistributed, which enables data acquisition after the patient recovers from the seizure (Andersen, 1989; Kaminska et al., 2003). The interictal SPECT is usually performed for subtraction analysis, but can occasionally show decreased cerebral perfusion in the region of suspected epileptogenic focus.
Various seizure-related factors affect the localization values of ictal SPECT. The most significant one is an early ictal injection and possibly also injection before or without seizure generalization. The localized ictal SPECT had been reported to be more frequent in a group with localized ictal EEG patterns. Total seizure duration, etiology of epilepsy, its type, and especially propagation pattern can also influence the results, necessitating the availability of these factors for correct interpretation of ictal SPECT. A different perfusion between the two most commonly used radiotracers has been shown, possibly related to different mechanisms of brain retention –99mTc-ethyl cysteinate dimer is retained in the brain after an enzymatic conversion to ionized acid compounds and 99mTc-hexamethylpropyleneamine oxime (HMPAO) after conversion to a nondiffusible hydrophilic compound after cell uptake. During seizure generalization, focal CBF increases in variable regions of the cerebral cortex, such as cerebellum and deep cerebellar nuclei, and decreases in the frontoparietal association cortex.
A study on secondarily generalized tonic-clonic seizures found that, in the pregeneralization and generalization phases, ictal SPECT showed more regions of CBF increases than in focal seizures without secondary generalization (Varghese et al., 2009). This made identification of a single unambiguous region of seizure onset impossible 50% of the time with ictal SPECT in secondarily generalized seizures. However, when a single unambiguous region was present, the localization was correct 80% of the time, which highlights the importance of propagation pattern.
Studies with nonlocalizing initial ictal SPECT showed that second ictal SPECT was able to localize epileptic focus in 62% of patients. One of the reasons for this could be that it is caused by significantly shorter injection times of second ictal SPECT (Lee et al., 2011). The interpretation of ictal perfusion changes should be done in the context of all available diagnostic modalities – especially in extratemporal-lobe epilepsy. In practice, using different thresholds for SPECT analysis can also help to see propagation patterns (Van Paesschen et al., 2007; Newey et al., 2013).
Postictal perfusion changes
After seizure termination the CBF in the epileptogenic zone usually drops and increase in the cerebellum becomes more pronounced, which later shifts into lateral cerebellar hemispheres, with midline regions less involved. The amount of cerebellar hyperperfusion, however, was not shown to be related to total seizure duration, duration of clonic phase, or severity of the tonic contractions (Blumenfeld et al., 2009). These changes are widespread and nonspecific, but it has been shown that early postictal SPECT scans can be used in seizure localization or at least in lateralization of seizure (O’Brien et al., 1999; McNally et al., 2005). The opposite pattern of CBF decrease in the hemisphere ipsilateral to the side of onset has also been observed, although this study included only patients with partial seizures without secondary generalization (McNally et al., 2005).
Data processing
SISCOM
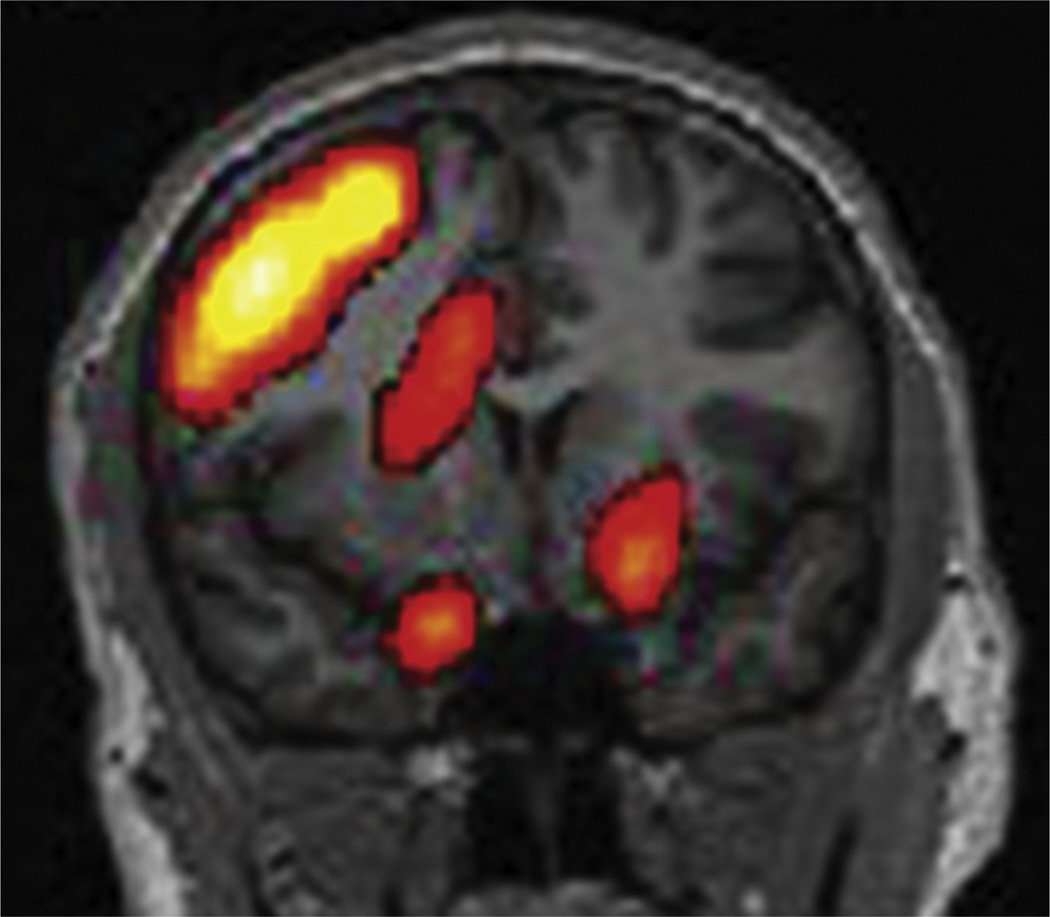
Subtraction ictal SPECT coregistered to MRI (SISCOM) was originally developed with Analyze at the Mayo Foundation and serves to compare the patient ictal scan with interictal scan to produce a subtraction image that is later coregistered to and visualized on the patient’s MRI (O’Brien et al., 1998a, b, 1999). Both ictal and interictal scans are intensity-normalized to adjust for differences in administered dose. Individual data are then coregistered together using a set method (usually surface-based or mutual information method). Coregistration brings imaging data into common space where voxel position in one image corresponds in another. Data subtraction is then made and the resulting images are then coregistered to patient’s MRI. The statistical threshold is then applied (usually 2 standard deviations (SD), although some studies show better performance with 1.5 SD) (Newey et al., 2013). Final perfusion maps typically demonstrate areas of regional hyperperfusion, reflecting increased neuronal activity in parts of the brain involved in seizure activity (O’Brien et al., 1998a, b).
This method improved localization of 39% using side-by-side visual inspection to 88% using SISCOM (O’Brien et al., 1998b). SISCOM has been described as particularly useful in identifying the seizure-onset zone in FCDs (Dupont et al., 2006). In patients with TLE and normal MRI,a favorable outcome was associated with SISCOM abnormality coregistered to the resection site (Bell et al., 2009) (Fig. 51.24). Also in nonlesional and extratemporal epilepsy, SISCOM is a highly valuable diagnostic tool to localize the seizure-onset zone and can be used to guide intracranial electrode placement and improve surgical outcome (Von Oertzen et al., 2011). SISCOM improves the sensitivity and specificity of SPECT in localizing the seizure focus for epilepsy surgery and it has been shown to be predictive of postsurgical improvement in seizure outcome; the extent of the SISCOM focus was significantly associated with an excellent outcome (O’Brien et al., 1998a, b, 2000).
Fig. 51.24.
Subtraction ictal SPECT co-registered to a magnetic resonance imaging head (SISCOM) shows a region of focal hyperperfusion over the right frontal head region in a patient with nonlesional extratemporal epilepsy of right frontal-lobe origin.
STATISCOM
Although SISCOM proved itself to be a valuable tool in epilepsy surgery candidates, its algorithm does not include the physiologic variability of CBF. Using a group of normal controls with two scans taken at different times and coregistered to template space, a map of this intraindividual variability is then created. STATISCOM stands for statistical ictal SPECT coregistered to MRI. The method is similar to SISCOM, with the additional step of data normalization (coregistration to template space, usually MNI) and comparison with a control group using statistical parametric mapping analysis (Lee et al., 2000; Kazemi et al., 2010). Normal group data are ideally taken from healthy volunteers in a given institution to eliminate covariates caused by different scanning protocols. Given possible difficulties in obtaining these controls, 14 pairs of HMPAO scans for these normal subjects (28 scans total) are also available for public use (Scheinost et al., 2010). Results are then coregistered back to patients’ MRI space for final visualization. With this approach, ictal SPECT identified a single unambiguous region of seizure onset in 71% of mesial temporal and 83% of neocortical epilepsy cases (McNally et al., 2005). STATISCOM was superior to SISCOM for seizure localization before TLE surgery. STATISCOM localization to the correct TLE subtype was also important for postsurgical seizure freedom (Kazemi et al., 2010) (Fig. 51.25). Modification of this analysis can also be used when a single ictal or interictal scan is compared with a control group, although results are better when using paired ictal–interictal images (Lee et al., 2000).
Fig. 51.25.
STATISCOM (statistical ictal SPECT coregistered to magnetic resonance imaging) shows a left medial temporal-lobe region of hyperperfusion in a patient with left temporal-lobe epilepsy.
Comparison with other diagnostic modalities
MRI
MRI is a basic and one of the most versatile methods in epilepsy imaging. The sensitivity of MRI in identifying epileptogenic foci in patients with medically refractory patients has been reported to be more than 80%. The sensitivity of MRI depends on the pathologic substrate, applied techniques, and last but not least, the experience of the interpreting physician.
Patients with MRI-negative epilepsy have a lower chance of having surgery than those with MRI-demonstrated lesions and, if surgery is performed, the odds of seizure freedom are two to three times lower than in the presence of a lesion on histopathology or MRI (Téllez-Zenteno et al., 2010). However, MRI-negative patients after successful surgery demonstrate that the process of multimodal presurgical evaluation may lead to good outcomes (Bien et al., 2009).
In recent years many previously MRI-negative cases have been shown to demonstrate subtle changes using high-field MRI, but no significant difference in outcomes was observed between groups with and without these changes (Garbelli et al., 2012). Apart from structural imaging additional postprocessing can be used for manual or automatic volumetry or voxel-based methods to identify FCDs (Jack et al., 1992; Kassubek et al., 2002).
Intracranial EEG
Intracranial EEG is the gold standard for ictal data in guiding resection, particularly in patients with MRI negative of bitemporal pathology. It provides excellent temporal resolution but limited spatial resolution and also elucidates the relationship to eloquent brain areas. Subdural grid monitoring for identification and epileptogenic focus is high yield, revealing a focus in 79% of monitoring sessions. Complications rarely result in permanent morbidity (1.5%). Surgical outcome has indicated that 74% of patients experienced a favorable reduction in seizure tendency (Van Gompel et al., 2008). It has also been reported that strictly unifocal, interictal epileptiform patterns on scalp EEG were a good predictor of successful outcome in subjects with intractable extratemporal epilepsy in a mixed group of MRI-positive and negative patients and also in a mixed group of patients with temporal and extratemporal epilepsy with normal or nonfocal MRI (Holmes et al., 2000; Jayakar et al., 2008). In bitemporal epilepsy, good outcome was correlated with highly lateralized (>75%) interictal scalp EEG discharges (Holmes et al., 2000).
SPECT-based decision making in neurologic surgery
Clinical implications in temporal-lobe epilepsy
In TLE, surgery is superior to prolonged medical therapy, offering significantly better quality of life (Wiebe et al., 2001). A widely used resective approach is anteromesial temporal lobectomy, which extends 3 cm posterior to the temporal pole laterally, and as far back as possible mesially, to include the amygdala, pes of the hippocampus, and most of the tail of the hippocampus. Another approach is a selective amygdalohippocampectomy that includes some of the parahippocampal gyrus but otherwise spares neocortical tissue. A recent meta-analysis showed that anteromesial temporal resection confers a higher chance of seizure freedom compared to selective amygdalohippocampectomy (Josephson et al., 2013).
MTS is the most common pathologic finding in patients with MTLE and this cohort is a distinctive group with excellent surgical outcome (Radhakrishnan et al., 1998). However, 20–30% of patients with TLE have no identifiable lesion on MRI, but obviously have dysfunction within the limbic network (Téllez-Zendeno et al., 2010). Even in patients with electrophysiologic-verified epileptogenic lesions, such as HS or other focal pathology, some do not benefit from surgery. Other patients who fail surgery may in fact have temporal plus epilepsy, with an epileptogenic network that extends into other cerebral lobes (Barba et al., 2007; Bertram, 2009). Ictal SPECT scans in MTLE show an increase in tracer uptake in the medial temporal region, cerebellum, thalamus, insula, and putamen. This suggests that MTLE is associated with state-specific perfusion and possibly functional organization and that there is a state-specific shift in metabolic networks in MTLE (Sequeira et al., 2013). In patients with MRI-negative TLE, good outcome, defined as free of disabling seizures, was associated with SISCOM abnormity localized to the resection site, absence of contralateral or extratemporal interictal epileptiform discharges, and subtle nonspecific MRI findings (Bell et al., 2009).
Clinical implications in extratemporal-lobe epilepsy
When MRI fails to detect a potentially epileptogenic lesion, the chances of an excellent surgical outcome are significantly lower (Noe et al., 2013). In extratemporal-lobe epilepsy only MRI was reported to predict surgical outcome, although various diagnostic methods can be useful in the diagnosis of extratemporal-lobe epilepsy (Mosewich et al., 2000; Lee et al., 2008). However in children with FCD, favorable outcome was associated with complete resection of the SPECT hyperperfusion and the value of colocalization of the cortical hyperperfusion zones with MRI-detected dysplastic lesions has been reported in adults (O’Brien et al., 2004; Krsek et al., 2013).
Conclusion
SPECT studies may play a pivotal role in the assessment of patients with drug-resistant focal epilepsy who are being considered for surgical treatment. In MRI-negative epilepsy patients usually require chronic intracranial EEG evaluation to define epileptogenic areas. SPECT may assist in determining the localization for the intracranial electrodes. Patients with lesional epilepsy with nonconvergent data or widespread noncircumscribed lesions may also benefit from functional neuroimaging studies in surgical planning. SISCOM can alter placement of electrodes or even decision making to recommend resective epilepsy surgery (Cascino et al., 2004; Ahnlide et al., 2007; Tan et al., 2008).
References
- Ahnlide J-A, Rosén I, Lindén-Mickelsson Tech P, et al. Does SISCOM contribute to favorable seizure outcome after epilepsy surgery? Epilepsia. 2007;48:579–588. doi: 10.1111/j.1528-1167.2007.00998.x. [DOI] [PubMed] [Google Scholar]
- Andermann F. Rasmussen’s syndrome. Stoneham, MA: Butterworth-Heinemann; 1991. Chronic encephalitis and epilepsy. [Google Scholar]
- Andersen AR. 99mTc-D, L-hexamethylene-propyleneamine oxime (99mTc-HMPAO): basic kinetic studies of a tracer of cerebral blood flow. Cerebrovasc Brain Metab Rev. 1989;1:288–318. [PubMed] [Google Scholar]
- Arruda F, Cendes F, Andermann F, et al. Mesial atrophy and outcome after amygdalohippocampectomy or temporal lobe removal. Ann Neurol. 1996;40:446–450. doi: 10.1002/ana.410400314. [DOI] [PubMed] [Google Scholar]
- Banati RB, Goerres GW, Myers R, et al. [11C](R)-PK11195 positron emission tomography imaging of activated microglia in vivo in Rasmussen’s encephalitis. Neurology. 1999;53:2199–2203. doi: 10.1212/wnl.53.9.2199. [DOI] [PubMed] [Google Scholar]
- Barba C, Di Giuda D, Policicchio D, et al. Correlation between provoked ictal SPECT and depth recordings in adult drug-resistant epilepsy patients. Epilepsia. 2007;48(2):278–285. doi: 10.1111/j.1528-1167.2007.00935.x. [DOI] [PubMed] [Google Scholar]
- Barkovich AJ, Truwit CL. Brain damage from perinatal asphyxia: correlation of MR findings with gestational age. AJNR. 1990;11:1087–1096. [PMC free article] [PubMed] [Google Scholar]
- Barkovich AJ, Rowley HA, Andermann F. MR in partial epilepsy: value of high-resolution volumetric techniques. AJNR. 1995;16:339–343. [PMC free article] [PubMed] [Google Scholar]
- Barkovich AJ, Guerrini R, Kuzniecky RI, et al. A developmental and genetic classification for malformations of cortical development: update 2012. Brain. 2012;135:1348–1369. doi: 10.1093/brain/aws019. [DOI] [PMC free article] [PubMed] [Google Scholar]
- Bastos AC, Comeau R, Andermann F, et al. Diagnosis of subtle focal dysplastic lesions: curvilinear multiplanar reformatting from three dimensional magnetic resonance imaging. Ann Neurol. 1999;46:88–94. doi: 10.1002/1531-8249(199907)46:1<88::aid-ana13>3.0.co;2-4. [DOI] [PubMed] [Google Scholar]
- Bauer M, Karch R, Zeitlinger M, et al. In vivo P-glycoprotein function before and after epilepsy surgery. Neurology. 2014;83:1326–1331. doi: 10.1212/WNL.0000000000000858. [DOI] [PMC free article] [PubMed] [Google Scholar]
- Bell ML, Rao S, So EL, et al. Epilepsy surgery outcomes in temporal lobe epilepsy with a normal MRI. Epilepsia. 2009;50:2053–2060. doi: 10.1111/j.1528-1167.2009.02079.x. [DOI] [PMC free article] [PubMed] [Google Scholar]
- Berg AT, Mathern GW, Bronen RA, et al. Frequency, prognosis and surgical treatment of structural abnormalities seen with magnetic resonance imaging in childhood epilepsy. Brain. 2009;132:2785–2797. doi: 10.1093/brain/awp187. [DOI] [PMC free article] [PubMed] [Google Scholar]
- Berg AT, Berkovic SF, Brodie MJ, et al. Revised terminology and concepts for organization of seizures and epilepsies: Report of the ILAE Commission on Classification and Terminology, 2005–2009. Epilepsia. 2010;51:676–685. doi: 10.1111/j.1528-1167.2010.02522.x. [DOI] [PubMed] [Google Scholar]
- Bernasconi A, Bernasconi N, Bernhardt BC, et al. Advances in MRI for ‘cryptogenic’ epilepsies. Nat Rev Neurol. 2011;7:99–108. doi: 10.1038/nrneurol.2010.199. [DOI] [PubMed] [Google Scholar]
- Bertram EH. Temporal lobe epilepsy: where do the seizures really begin? Epilepsy Behav. 2009;14(Suppl 1):32–37. doi: 10.1016/j.yebeh.2008.09.017. [DOI] [PMC free article] [PubMed] [Google Scholar]
- Bien CG, Szinay M, Wagner J, et al. Characteristics and surgical outcomes of patients with refractory magnetic resonance imaging-negative epilepsies. Arch Neurol. 2009;66:1491–1499. doi: 10.1001/archneurol.2009.283. [DOI] [PubMed] [Google Scholar]
- Blumcke I, Thom M, Aronica E, et al. The clinicopathologic spectrum of focal cortical dysplasias: a consensus classification proposed by an ad hoc Task Force of the ILAE Diagnostic Methods Commission. Epilepsia. 2011;52:158–174. doi: 10.1111/j.1528-1167.2010.02777.x. [DOI] [PMC free article] [PubMed] [Google Scholar]
- Blumcke I, Aronica E, Urbach H, et al. A neuropathology-based approach to epilepsy surgery in brain tumors and proposal for a new terminology use for long-term epilepsy-associated brain tumors. Acta Neuropathol. 2014;128(1):39–54. doi: 10.1007/s00401-014-1288-9. [DOI] [PMC free article] [PubMed] [Google Scholar]
- Blumenfeld H, Varghese GI, Purcaro MJ, et al. Cortical and subcortical networks in human secondarily generalized tonic-clonic seizures. Brain. 2009;132(Pt 4):999–1012. doi: 10.1093/brain/awp028. [DOI] [PMC free article] [PubMed] [Google Scholar]
- Bouilleret V, Semah F, Biraben A, et al. Involvement of the basal ganglia in refractory epilepsy: an 18 F-fluoro-L-DOPA PET study using 2 methods of analysis. J Nucl Med. 2005;46:540–547. [PubMed] [Google Scholar]
- Bouvard S, Costes N, Bonnefoi F, et al. Seizure-related short-term plasticity of benzodiazepine receptors in partial epilepsy: a [11C]flumazenil-PET study. Brain. 2005;128:1330–1343. doi: 10.1093/brain/awh470. [DOI] [PubMed] [Google Scholar]
- Brodtkorb E, Zuberi S, Gambardella A, et al. Alteration of the in vivo nicotinic receptor density in ADNFLE patients: a PET study. Brain. 2006;129:2047–2060. doi: 10.1093/brain/awl156. [DOI] [PubMed] [Google Scholar]
- Bromfield EB, Altshuler L, Leiderman DB, et al. Cerebral metabolism and depression in patients with complex partial seizures. Arch Neurol. 1992;49:617–623. doi: 10.1001/archneur.1992.00530300049010. [DOI] [PubMed] [Google Scholar]
- Bronen RA, Fulbright RK, Spencer DD, et al. Refractory epilepsy: comparison of MR imaging, CT, and histopathologic findings in 117 patients. Radiology. 1996;201(1):97–105. doi: 10.1148/radiology.201.1.8816528. [DOI] [PubMed] [Google Scholar]
- Burdette DE, Sakurai SY, Henry TR, et al. Temporal lobe central benzodiazepine binding in unilateral mesial temporal lobe epilepsy. Neurology. 1995;45:934–941. doi: 10.1212/wnl.45.5.934. [DOI] [PubMed] [Google Scholar]
- Butler T, Ichise M, Teich AF, et al. Imaging inflammation in a patient with epilepsy due to focal cortical dysplasia. J Neuroimaging. 2013;23:129–131. doi: 10.1111/j.1552-6569.2010.00572.x. [DOI] [PMC free article] [PubMed] [Google Scholar]
- Carne RP, O’Brien TJ, Kilpatrick CJ, et al. MRI-negative PET-positive temporal lobe epilepsy: a distinct surgically remediable syndrome. Brain. 2004;127:2276–2285. doi: 10.1093/brain/awh257. [DOI] [PubMed] [Google Scholar]
- Cascino GD. Advances in neuroimaging: surgical localization. Epilepsia. 2001;42:3–12. doi: 10.1046/j.1528-1157.2001.081421.x. [DOI] [PubMed] [Google Scholar]
- Cascino GD, Buchhalter JR, Mullan BP, et al. Ictal SPECT in nonlesional extratemporal epilepsy. Epilepsia. 2004;45(Suppl 4):32–34. doi: 10.1111/j.0013-9580.2004.04007.x. [DOI] [PubMed] [Google Scholar]
- Cendes F. Neuroimaging in investigation of patients with epilepsy. Continuum (Minneap Minn) 623–642;19(3 Epilepsy) doi: 10.1212/01.CON.0000431379.29065.d3. [DOI] [PMC free article] [PubMed] [Google Scholar]
- Cendes F, Knowlton RC, Novotny E, et al. Magnetic resonance spectroscopy in epilepsy: clinical issues. Epilepsia. 2002;43(Suppl. 1):32–39. [Google Scholar]
- Cendes F, Sakamoto AC, Spreafico R, et al. Epilepsies associated with hippocampal sclerosis. Acta Neuropathol. 2014;128:21–37. doi: 10.1007/s00401-014-1292-0. [DOI] [PubMed] [Google Scholar]
- Chugani HT, Mazziotta JC, Engel J, Jr, et al. The Lennox-Gastaut syndrome: metabolic subtypes determined by 2-deoxy-2[18 F]fluoro-D-glucose positron emission tomography. Ann Neurol. 1987;21:4–13. doi: 10.1002/ana.410210104. [DOI] [PubMed] [Google Scholar]
- Chugani HT, Shields WD, Shewmon DA, et al. Infantile spasms: I. PET identifies focal cortical dysgenesis in cryptogenic cases for surgical treatment. Ann Neurol. 1990;27:406–413. doi: 10.1002/ana.410270408. [DOI] [PubMed] [Google Scholar]
- Chugani HT, Shewmon DA, Shields WD, et al. Surgery for intractable infantile spasms: neuroimaging perspectives. Epilepsia. 1993;34:764–771. doi: 10.1111/j.1528-1157.1993.tb00459.x. [DOI] [PubMed] [Google Scholar]
- Chugani HT, Kumar A, Kupsky W, et al. Clinical and histopathologic correlates of 11C–alpha-methyl-L-tryptophan (AMT) PET abnormalities in children with intractable epilepsy. Epilepsia. 2011;52:1692–1698. doi: 10.1111/j.1528-1167.2011.03103.x. [DOI] [PMC free article] [PubMed] [Google Scholar]
- Chugani HT, Luat AF, Kumar A, et al. α-[11C]-Methyl-L-tryptophan-PET in 191 patients with tuberous sclerosis complex. Neurology. 2013;81:674–680. doi: 10.1212/WNL.0b013e3182a08f3f. [DOI] [PMC free article] [PubMed] [Google Scholar]
- Chugani HT, Asano E, Juha´sz C, et al. Subtotal hemispherectomy in children with intractable focal epilepsy. Epilepsia. 2014;55:1926–1933. doi: 10.1111/epi.12845. [DOI] [PubMed] [Google Scholar]
- Coan AC, Campos BM, Yasuda CL, et al. Frequent seizures are associated with a network of gray matter atrophy in temporal lobe epilepsy with or without hippocampal sclerosis. PLoS One. 2014;9(1):e85843. doi: 10.1371/journal.pone.0085843. [DOI] [PMC free article] [PubMed] [Google Scholar]
- Colombo N, Salamon N, Raybaud C, et al. Imaging of malformations of cortical development. Epileptic Disord. 2009;11:194–205. doi: 10.1684/epd.2009.0262. [DOI] [PubMed] [Google Scholar]
- Commission on Neuroimaging of the International League Against Epilepsy. Recommendations for neuroim-aging of patients with epilepsy. Epilepsia. 1997;38:1255–1256. doi: 10.1111/j.1528-1157.1997.tb01226.x. [DOI] [PubMed] [Google Scholar]
- Danfors T, Åhs F, Appel L, et al. Increased neurokinin-1 receptor availability in temporal lobe epilepsy: a positron emission tomography study using [(11) C]GR205171. Epilepsy Res. 2011;97:183–189. doi: 10.1016/j.eplepsyres.2011.08.006. [DOI] [PubMed] [Google Scholar]
- Ding YS, Chen BB, Glielmi C, et al. A pilot study in epilepsy patients using simultaneous PET/MR. Am J Nucl Med Mol Imaging. 2014;4:459–470. [PMC free article] [PubMed] [Google Scholar]
- Dupont P, Van Paesschen W, Palmini A, et al. Ictal perfusion patterns associated with single MRI-visible focal dysplastic lesions: implications for the noninvasive delineation of the epileptogenic zone. Epilepsia. 2006;47:1550–1557. doi: 10.1111/j.1528-1167.2006.00628.x. [DOI] [PubMed] [Google Scholar]
- Engel J, Jr, Kuhl DE, Phelps ME, et al. Interictal cerebral glucose metabolism in partial epilepsy and its relation to EEG changes. Ann Neurol. 1982;12:510–517. doi: 10.1002/ana.410120603. [DOI] [PubMed] [Google Scholar]
- Engel J, Jr, Lubens P, Kuhl DE, et al. Local cerebral metabolic rate for glucose during petit mal absences. Ann Neurol. 1985;17:121–128. doi: 10.1002/ana.410170204. [DOI] [PubMed] [Google Scholar]
- Engel J, Jr, Henry TR, Risinger MW, et al. Presurgical evaluation for partial epilepsy: relative contributions of chronic depth-electrode recordings versus FDG-PET and scalp-sphenoidal ictal EEG. Neurology. 1990;40:1670–1677. doi: 10.1212/wnl.40.11.1670. [DOI] [PubMed] [Google Scholar]
- Feldmann M, Asselin MC, Liu J, et al. P-glycoprotein expression and function in patients with temporal lobe epilepsy: a case-control study. Lancet Neurol. 2013;12:777–785. doi: 10.1016/S1474-4422(13)70109-1. [DOI] [PubMed] [Google Scholar]
- Foldvary N, Lee N, Hanson MW, et al. Correlation of hippocampal neuronal density and FDG-PET in mesial temporal lobe epilepsy. Epilepsia. 1999;40:26–29. doi: 10.1111/j.1528-1157.1999.tb01984.x. [DOI] [PubMed] [Google Scholar]
- Frost JJ, Mayberg HS, Fisher RS, et al. Mu-opiate receptors measured by positron emission tomography are increased in temporal lobe epilepsy. Ann Neurol. 1988;23:231–237. doi: 10.1002/ana.410230304. [DOI] [PubMed] [Google Scholar]
- Fujita M, Mahanty S, Zoghbi SS, et al. PET reveals inflammation around calcified Taenia solium granulomas with perilesional edema. PLoS One. 2013;8:e74052. doi: 10.1371/journal.pone.0074052. [DOI] [PMC free article] [PubMed] [Google Scholar]
- Gaillard WD, Fazilat S, White S, et al. Interictal metabolism and blood flow are uncoupled in temporal lobe cortex of patients with complex partial epilepsy. Neurology. 1995;45:1841–1847. doi: 10.1212/wnl.45.10.1841. [DOI] [PubMed] [Google Scholar]
- Gaillard WD, Kopylev L, Weinstein S, et al. Low incidence of abnormal (18)FDG-PET in children with newonset partial epilepsy: a prospective study. Neurology. 2002;58:717–722. doi: 10.1212/wnl.58.5.717. [DOI] [PubMed] [Google Scholar]
- Gaillard WD, Cross JH, Duncan JS, et al. Epilepsy imaging study guideline criteria: commentary on diagnostic testing study guidelines and practice parameters. Epilepsia. 2011;52(9):1750–1756. doi: 10.1111/j.1528-1167.2011.03155.x. [DOI] [PMC free article] [PubMed] [Google Scholar]
- Garbelli R, Milesi G, Medici V, et al. Blurring in patients with temporal lobe epilepsy: clinical, high-field imaging and ultrastructural study. Brain. 2012;135(Pt 8):2337–2349. doi: 10.1093/brain/aws149. [DOI] [PubMed] [Google Scholar]
- Giovacchini G, Toczek MT, Bonwetsch R, et al. 5-HT 1A receptors are reduced in temporal lobe epilepsy after partial-volume correction. J Nucl Med. 2005;46:1128–1135. [PMC free article] [PubMed] [Google Scholar]
- Gok B, Jallo G, Hayeri R, et al. The evaluation of FDG-PET imaging for epileptogenic focus localization in patients with MRI positive and MRI negative temporal lobe epilepsy. Neuroradiology. 2013;55:541–550. doi: 10.1007/s00234-012-1121-x. [DOI] [PubMed] [Google Scholar]
- Hasler G, Bonwetsch R, Giovacchini G, et al. 5-HT (1A) Receptor binding in temporal lobe epilepsy patients with and without major depression. Biol Psychiatry. 2007;62:1258–1264. doi: 10.1016/j.biopsych.2007.02.015. [DOI] [PMC free article] [PubMed] [Google Scholar]
- Henry TR, Frey KA, Sackellares JC, et al. In vivo cerebral metabolism and central benzodiazepine-receptor binding in temporal lobe epilepsy. Neurology. 1993;43:1998–2006. doi: 10.1212/wnl.43.10.1998. [DOI] [PubMed] [Google Scholar]
- Henry TR, Babb TL, Engel J, Jr, et al. Hippocampal neuronal loss and regional hypometabolism in temporal lobe epilepsy. Ann Neurol. 1994;36:925–927. doi: 10.1002/ana.410360620. [DOI] [PubMed] [Google Scholar]
- Hirvonen J, Kreisl WC, Fujita M, et al. In vivo expression of an inflammatory marker in temporal lobe epilepsy. J Nucl Med. 2012;53:234–240. doi: 10.2967/jnumed.111.091694. [DOI] [PMC free article] [PubMed] [Google Scholar]
- Hogan RE, Carne RP, Kilpatrick CJ, et al. Hippocampal deformation mapping in MRI negative PET positive temporal lobe epilepsy. J Neurol Neurosurg Psychiatry. 2008;79:636–640. doi: 10.1136/jnnp.2007.123406. [DOI] [PubMed] [Google Scholar]
- Holmes MD, Kutsy RL, Ojemann GA, et al. Interictal, unifocal spikes in refractory extratemporal epilepsy predict ictal origin and postsurgical outcome. Clin Neurophysiol Off J Int Fed Clin Neurophysiol. 2000;111:1802–1808. doi: 10.1016/s1388-2457(00)00389-8. [DOI] [PubMed] [Google Scholar]
- Hong SJ, Kim H, Schrader D, et al. Automated detection of cortical dysplasia type II in MRI-negative epilepsy. Neurology. 2014;83(1):48–55. doi: 10.1212/WNL.0000000000000543. [DOI] [PMC free article] [PubMed] [Google Scholar]
- Iinuma K, Yokoyama H, Otsuki T, et al. Histamine H1 receptors in complex partial seizures. Lancet. 1993;341:238. doi: 10.1016/0140-6736(93)90099-3. [DOI] [PubMed] [Google Scholar]
- Itomi K, Okumura A, Negoro T, et al. Prognostic value of positron emission tomography in cryptogenic West syndrome. Dev Med Child Neurol. 2002;44:107–111. doi: 10.1017/s001216220100175x. [DOI] [PubMed] [Google Scholar]
- Jack CRJ, Sharbrough FW, Cascino GD, et al. Magnetic resonance image-based hippocampal volumetry: correlation with outcome after temporal lobectomy. Ann Neurol. 1992;31:138–146. doi: 10.1002/ana.410310204. [DOI] [PubMed] [Google Scholar]
- Jayakar P, Dunoyer C, Dean P, et al. Epilepsy surgery in patients with normal or nonfocal MRI scans: integrative strategies offer long-term seizure relief. Epilepsia. 2008;49(5):758–764. doi: 10.1111/j.1528-1167.2007.01428.x. [DOI] [PubMed] [Google Scholar]
- Joo EY, Lee EK, Tae WS, et al. Unitemporal vs bitemporal hypometabolism in mesial temporal lobe epilepsy. Arch Neurol. 2004;61:1074–1078. doi: 10.1001/archneur.61.7.1074. [DOI] [PubMed] [Google Scholar]
- Josephson CB, Dykeman J, Fiest KM, et al. Systematic review and meta-analysis of standard vs selective temporal lobe epilepsy surgery. Neurology. 2013;80(18):1669–1676. doi: 10.1212/WNL.0b013e3182904f82. [DOI] [PubMed] [Google Scholar]
- Kaminska A, Chiron C, Ville D, et al. Ictal SPECT in children with epilepsy: comparison with intracranial EEG and relation to postsurgical outcome. Brain. 2003;126:248–260. doi: 10.1093/brain/awg013. [DOI] [PubMed] [Google Scholar]
- Kassubek J, Huppertz H-J, Spreer J, et al. Detection and localization of focal cortical dysplasia by voxel-based 3-D MRI analysis. Epilepsia. 2002;43:596–602. doi: 10.1046/j.1528-1157.2002.41401.x. [DOI] [PubMed] [Google Scholar]
- Kazemi NJ, Worrell GA, Stead SM, et al. Ictal SPECT statistical parametric mapping in temporal lobe epilepsy surgery. Neurology. 2010;74:70–76. doi: 10.1212/WNL.0b013e3181c7da20. [DOI] [PMC free article] [PubMed] [Google Scholar]
- Kim YK, Lee DS, Lee SK, et al. (18)F-FDG PET in localization of frontal lobe epilepsy: comparison of visual and SPM analysis. J Nucl Med. 2002;43:1167–1174. [PubMed] [Google Scholar]
- Kim YK, Lee DS, Lee SK, et al. Differential features of metabolic abnormalities between medial and lateral temporal lobe epilepsy: quantitative analysis of (18)F-FDG PET using SPM. J Nucl Med. 2003;44:1006–1012. [PubMed] [Google Scholar]
- Kim MA, Heo K, Choo MK, et al. Relationship between bilateral temporal hypometabolism and EEG findings for mesial temporal lobe epilepsy: analysis of 18 F-FDG PET using SPM. Seizure. 2006;15:56–63. doi: 10.1016/j.seizure.2005.11.007. [DOI] [PubMed] [Google Scholar]
- Knake S, Triantafyllou C, Wald LL, et al. 3 T phased array MRI improves the presurgical evaluation in focal epilepsies: a prospective study. Neurology. 2005;65:1026–1031. doi: 10.1212/01.wnl.0000179355.04481.3c. [DOI] [PubMed] [Google Scholar]
- Knopman AA, Wong CH, Stevenson RJ, et al. The cognitive profile of occipital lobe epilepsy and the selective association of left temporal lobe hypometabolism with verbal memory impairment. Epilepsia. 2014;55:e80–e84. doi: 10.1111/epi.12623. [DOI] [PubMed] [Google Scholar]
- Koepp MJ, Hammers A, Labbe C, et al. 11C-flumazenil PET in patients with refractory temporal lobe epilepsy and normal MRI. Neurology. 2000;54:332–339. doi: 10.1212/wnl.54.2.332. [DOI] [PubMed] [Google Scholar]
- Koh S, Jayakar P, Dunoyer C, et al. Epilepsy surgery in children with tuberous sclerosis complex: presurgical evaluation and outcome. Epilepsia. 2000;41(9):1206–1213. doi: 10.1111/j.1528-1157.2000.tb00327.x. [DOI] [PubMed] [Google Scholar]
- Koutroumanidis M, Hennessy MJ, Seed PT, et al. Significance of interictal bilateral temporal hypometabolism in temporal lobe epilepsy. Neurology. 2000;54:1811–1821. doi: 10.1212/wnl.54.9.1811. [DOI] [PubMed] [Google Scholar]
- Krsek P, Kudr M, Jahodova A, et al. Localizing value of ictal SPECT is comparable to MRI and EEG in children with focal cortical dysplasia. Epilepsia. 2013;54(2):351–358. doi: 10.1111/epi.12059. [DOI] [PubMed] [Google Scholar]
- Kumlien E, Hartvig P, Valind S, et al. NMDA-receptor activity visualized with (S)-[N-methyl-11C]ketamine and positron emission tomography in patients with medial temporal lobe epilepsy. Epilepsia. 1999;40:30–37. doi: 10.1111/j.1528-1157.1999.tb01985.x. [DOI] [PubMed] [Google Scholar]
- Kumlien E, Nilsson A, Hagberg G, et al. PET with 11C–deuterium-deprenyl and 18 F-FDG in focal epilepsy. Acta Neurol Scand. 2001;103:360–366. doi: 10.1034/j.1600-0404.2001.103006360.x. [DOI] [PubMed] [Google Scholar]
- Kuzniecky RI, Bilir E, Gilliam F, et al. Multimodality MRI in mesial temporal sclerosis: relative sensitivity and specificity. Neurology. 1997;49(3):774–778. doi: 10.1212/wnl.49.3.774. [DOI] [PubMed] [Google Scholar]
- Labate A, Gambardella A, Aguglia U, et al. Temporal lobe abnormalities on brain MRI in healthy volunteers: a prospective case-control study. Neurology. 2010;74:553–557. doi: 10.1212/WNL.0b013e3181cff747. [DOI] [PubMed] [Google Scholar]
- Lamusuo S, Pitkanen A, Jutila L, et al. [11 C] Flumazenil binding in the medial temporal lobe in patients with temporal lobe epilepsy: correlation with hippocampal MR volumetry, T2 relaxometry, and neuropathology. Neurology. 2000;54:2252–2260. doi: 10.1212/wnl.54.12.2252. [DOI] [PubMed] [Google Scholar]
- Lee JD, Kim H-J, Lee BI, et al. Evaluation of ictal brain SPET using statistical parametric mapping in temporal lobe epilepsy. Eur J Nucl Med Mol Imaging. 2000;27:1658–1665. doi: 10.1007/s002590000364. [DOI] [PubMed] [Google Scholar]
- Lee JJ, Lee SK, Lee S-Y, et al. Frontal lobe epilepsy: clinical characteristics, surgical outcomes and diagnostic modalities. Seizure. 2008;17(6):514–523. doi: 10.1016/j.seizure.2008.01.007. [DOI] [PubMed] [Google Scholar]
- Lee JY, Joo EY, Park HS, et al. Repeated ictal SPECT in partial epilepsy patients: SISCOM analysis. Epilepsia. 2011;52:2249–2256. doi: 10.1111/j.1528-1167.2011.03257.x. [DOI] [PubMed] [Google Scholar]
- Leiderman DB, Albert P, Balish M, et al. The dynamics of metabolic change following seizures as measured by positron emission tomography with fludeoxyglucose F 18. Arch Neurol. 1994;51:932–936. doi: 10.1001/archneur.1994.00540210106019. [DOI] [PubMed] [Google Scholar]
- Lippé S, Poupon C, Cachia A, et al. White matter abnormalities revealed by DTI correlate with interictal grey matter FDG-PET metabolism in focal childhood epilepsies. Epileptic Disord. 2012;14:404–413. doi: 10.1684/epd.2012.0547. [DOI] [PubMed] [Google Scholar]
- LoPinto-Khoury C, Sperling MR, Skidmore C, et al. Surgical outcome in PET-positive, MRI-negative patients with temporal lobe epilepsy. Epilepsia. 2012;53:342–348. doi: 10.1111/j.1528-1167.2011.03359.x. [DOI] [PubMed] [Google Scholar]
- Lv RJ, Sun ZR, Cui T, et al. Temporal lobe epilepsy with amygdala enlargement: a subtype of temporal lobe epilepsy. BMC Neurol. 2014;14:194. doi: 10.1186/s12883-014-0194-z. [DOI] [PMC free article] [PubMed] [Google Scholar]
- Martinez A, Finegersh A, Cannon DM, et al. The 5-HT1A receptor and 5-HT transporter in temporal lobe epilepsy. Neurology. 2013;80:1465–1471. doi: 10.1212/WNL.0b013e31828cf809. [DOI] [PMC free article] [PubMed] [Google Scholar]
- Mayberg HS, Sadzot B, Meltzer CC, et al. Quantification of mu and non-mu opiate receptors in temporal lobe epilepsy using positron emission tomography. Ann Neurol. 1991;30:3–11. doi: 10.1002/ana.410300103. [DOI] [PubMed] [Google Scholar]
- McNally KA, Paige AL, Varghese G, et al. Localizing value of ictal-interictal SPECT analyzed by SPM (ISAS) Epilepsia. 2005;46:1450–1464. doi: 10.1111/j.1528-1167.2005.06705.x. [DOI] [PubMed] [Google Scholar]
- Merlet I, Ostrowsky K, Costes N, et al. 5-HT1A receptor binding and intracerebral activity in temporal lobe epilepsy: an [18 F]MPPF-PET study. Brain. 2004;127:900–913. doi: 10.1093/brain/awh109. [DOI] [PubMed] [Google Scholar]
- Metsahonkala L, Gaily E, Rantala H, et al. Focal and global cortical hypometabolism in patients with newly diagnosed infantile spasms. Neurology. 2002;58:1646–1651. doi: 10.1212/wnl.58.11.1646. [DOI] [PubMed] [Google Scholar]
- Mittal S, Mittal M, Montes JL, et al. Hypothalamic hamartomas. Part 1. Clinical, neuroimaging, and neurophysiological characteristics. Neurosurg Focus. 2013;34(6):E6. doi: 10.3171/2013.3.FOCUS1355. [DOI] [PubMed] [Google Scholar]
- Mishra AM, Ellens DJ, Schridde U, et al. Where fMRI and electrophysiology agree to disagree: corticothalamic and striatal activity patterns in the WAG/Rij rat. J Neurosci. 2011;31:15053–15064. doi: 10.1523/JNEUROSCI.0101-11.2011. [DOI] [PMC free article] [PubMed] [Google Scholar]
- Montenegro MA, Cendes F, Lopes-Cendes I, et al. The clinical spectrum of malformations of cortical development. Arq Neuropsiquiatr. 2007;65(2A):196–201. doi: 10.1590/s0004-282x2007000200002. [DOI] [PubMed] [Google Scholar]
- Mosbah A, Tramoni E, Guedj E, et al. Clinical, neuropsychological, and metabolic characteristics of transient epileptic amnesia syndrome. Epilepsia. 2014;55:699–706. doi: 10.1111/epi.12565. [DOI] [PubMed] [Google Scholar]
- Mosewich R, So E, O’Brien T. Factors predictive of the outcome of frontal lobe epilepsy surgery. Epilepsia. 2000;41(7):843–849. doi: 10.1111/j.1528-1157.2000.tb00251.x. [DOI] [PubMed] [Google Scholar]
- Muller-Gartner HW, Mayberg HS, Fisher RS, et al. Decreased hippocampal muscarinic cholinergic receptor binding measured by 123I-iododexetimide and single-photon emission computed tomography in epilepsy. Ann Neurol. 1993;34:235–238. doi: 10.1002/ana.410340221. [DOI] [PubMed] [Google Scholar]
- Muzik O, da Silva EA, Juhasz C, et al. Intracranial EEG versus flumazenil and glucose PET in children with extratemporal lobe epilepsy. Neurology. 2000;54:171–179. doi: 10.1212/wnl.54.1.171. [DOI] [PubMed] [Google Scholar]
- Newey CR, Wong C, Wang ZI, et al. Optimizing SPECT SISCOM analysis to localize seizure-onset zone by using varying z scores. Epilepsia. 2013;54:793–800. doi: 10.1111/epi.12139. [DOI] [PubMed] [Google Scholar]
- Noe K, Sulc V, Wong-Kisiel L, et al. Long-term outcomes after nonlesional extratemporal lobe epilepsy surgery. JAMA Neurol. 2013;70:1003–1008. doi: 10.1001/jamaneurol.2013.209. [DOI] [PMC free article] [PubMed] [Google Scholar]
- O’Brien T, O’Connor M, Mullan B, et al. Subtraction ictal SPET co-registered to MRI in partial epilepsy: description and technical validation of the method with phantom and patient studies. Nucl Med Comm. 1998a;19:31–45. doi: 10.1097/00006231-199801000-00006. [DOI] [PubMed] [Google Scholar]
- O’Brien TJ, So EL, Mullan BP, et al. Subtraction ictal SPECT co-registered to MRI improves clinical usefulness of SPECT in localizing the surgical seizure focus. Neurology. 1998b;50:445–454. doi: 10.1212/wnl.50.2.445. [DOI] [PubMed] [Google Scholar]
- O’Brien TJ, So EL, Mullan BP, et al. Subtraction SPECT co-registered to MRI improves postictal SPECT localization of seizure foci. Neurology. 1999;52:137–146. doi: 10.1212/wnl.52.1.137. [DOI] [PubMed] [Google Scholar]
- O’Brien TJ, So EL, Mullan BP, et al. Subtraction periictal SPECT is predictive of extratemporal epilepsy surgery outcome. Neurology. 2000;55:1668–1677. doi: 10.1212/wnl.55.11.1668. [DOI] [PubMed] [Google Scholar]
- O’Brien TJ, Newton MR, Cook MJ, et al. Hippocampal atrophy is not a major determinant of regional hypometabolism in temporal lobe epilepsy. Epilepsia. 1997;38:74–80. doi: 10.1111/j.1528-1157.1997.tb01080.x. [DOI] [PubMed] [Google Scholar]
- O’Brien TJ, Hicks RJ, Ware R, et al. The utility of a 3-dimensional, large-field-of-view, sodium iodide crystal-based PET scanner in the presurgical evaluation of partial epilepsy. J Nucl Med. 2001;42:1158–1165. [PubMed] [Google Scholar]
- O’Brien TTJ, So EL, Cascino GD, et al. Subtraction SPECT coregistered to MRI in focal malformations of cortical development: localization of the epileptogenic zone in epilepsy surgery candidates. Epilepsia. 2004;45(4):367–376. doi: 10.1111/j.0013-9580.2004.54703.x. [DOI] [PubMed] [Google Scholar]
- Odano I, Varrone A, Savic I, et al. Quantitative PET analyses of regional [11C]PE2I binding to the dopamine transporter-application to juvenile myoclonic epilepsy. Neuroimage. 2012;59:3582–3593. doi: 10.1016/j.neuroimage.2011.10.067. [DOI] [PubMed] [Google Scholar]
- Osborn AG, Salzman KL, Barkovich AJ, editors. Diagnostic Imaging: Brain. 2nd. Philadelphia: Amirsys/Lippincott Williams and Wilkins; 2010. [Google Scholar]
- Patel KS, Zhao M, Ma H, et al. Imaging preictal hemodynamic changes in neocortical epilepsy. Neurosurg Focus. 2013;34(4):E10. doi: 10.3171/2013.1.FOCUS12408. [DOI] [PMC free article] [PubMed] [Google Scholar]
- Pearl PL, Gibson KM, Quezado Z, et al. Decreased GABA-A binding on FMZ-PET in succinic semialdehyde dehydrogenase deficiency. Neurology. 2009;73:423–429. doi: 10.1212/WNL.0b013e3181b163a5. [DOI] [PMC free article] [PubMed] [Google Scholar]
- Perissinotti A, Setoain X, Aparicio J, et al. Clinical role of subtraction ictal SPECT coregistered to MR imaging and (18)F-FDG PET in pediatric epilepsy. J Nucl Med. 2014;55(7):1099–1105. doi: 10.2967/jnumed.113.136432. [DOI] [PubMed] [Google Scholar]
- Pisano T, Barkovich AJ, Leventer RJ, et al. Peritrigonal and temporo-occipital heterotopia with corpus callosum and cerebellar dysgenesis. Neurology. 2012;79:1244–1251. doi: 10.1212/WNL.0b013e31826aac88. [DOI] [PMC free article] [PubMed] [Google Scholar]
- Poduri A, Golja A, Takeoka M, et al. Focal cortical malformations can show asymmetrically higher uptake on interictal fluorine-18 fluorodeoxyglucose positron emission tomography (PET) J Child Neurol. 2007;22:232–237. doi: 10.1177/0883073807300305. [DOI] [PubMed] [Google Scholar]
- Prevett MC, Duncan JS, Jones T, et al. Demonstration of thalamic activation during typical absence seizures using H2(15)O and PET. Neurology. 1995;45:1396–1402. doi: 10.1212/wnl.45.7.1396. [DOI] [PubMed] [Google Scholar]
- Radhakrishnan K, So EL, Silbert PL, et al. Predictors of outcome of anterior temporal lobectomy for intractable epilepsy. Neurology. 1998;51:465–471. doi: 10.1212/wnl.51.2.465. [DOI] [PubMed] [Google Scholar]
- Rathore C, Dickson JC, Teotónio R, et al. The utility of 18 F-fluorodeoxyglucose PET (FDG PET) in epilepsy surgery. Epilepsy Res. 2014;108:1306–1314. doi: 10.1016/j.eplepsyres.2014.06.012. [DOI] [PubMed] [Google Scholar]
- Rubi S, Costes N, Heckemann RA. Positron emission tomography with α-[11C]methyl-L-tryptophan in tuberous sclerosis complex-related epilepsy. Epilepsia. 2013;54:2143–2150. doi: 10.1111/epi.12412. [DOI] [PubMed] [Google Scholar]
- Ryvlin P, Bouvard S, Le Bars D, et al. Clinical utility of flumazenil-PET versus [18 F]fluorodeoxyglucose-PET and MRI in refractory partial epilepsy. A prospective study in 100 patients. Brain. 1998;121:2067–2081. doi: 10.1093/brain/121.11.2067. [DOI] [PubMed] [Google Scholar]
- Saavalainen T, Jutila L, Mervaala E, et al. Temporal anteroinferior encephalocele: an underrecognized etiology of temporal lobe epilepsy? Neurology. 2015;85(17):1467–1474. doi: 10.1212/WNL.0000000000002062. [DOI] [PubMed] [Google Scholar]
- Salamon N, Kung J, Shaw SJ, et al. FDG-PET/MRI coregistration improves detection of cortical dysplasia in patients with epilepsy. Neurology. 2008;71(20):1594–1601. doi: 10.1212/01.wnl.0000334752.41807.2f. [DOI] [PMC free article] [PubMed] [Google Scholar]
- Salzberg M, Taher T, Davie M, et al. Depression in temporal lobe epilepsy surgery patients: an FDG-PET study. Epilepsia. 2006;47:2125–2130. doi: 10.1111/j.1528-1167.2006.00860.x. [DOI] [PubMed] [Google Scholar]
- Savic I, Persson A, Roland P, et al. In-vivo demonstration of reduced benzodiazepine receptor binding in human epileptic foci. Lancet. 1988;2:863–866. doi: 10.1016/s0140-6736(88)92468-3. [DOI] [PubMed] [Google Scholar]
- Savic I, Altshuler L, Baxter L, et al. Pattern of interictal hypometabolism in PET scans with fludeoxyglucose F 18 reflects prior seizure types in patients with mesial temporal lobe seizures. Arch Neurol. 1997;54:129–136. doi: 10.1001/archneur.1997.00550140011006. [DOI] [PubMed] [Google Scholar]
- Savic I, Lindstrom P, Gulyas B, et al. Limbic reductions of 5-HT1A receptor binding in human temporal lobe epilepsy. Neurology. 2004;62:1343–1351. doi: 10.1212/01.wnl.0000123696.98166.af. [DOI] [PubMed] [Google Scholar]
- Scheinost D, Teisseyre TZ, Distasio M, et al. New open-source ictal SPECT analysis method implemented in BioImage Suite. Epilepsia. 2010;51(4):703–707. doi: 10.1111/j.1528-1167.2009.02425.x. [DOI] [PMC free article] [PubMed] [Google Scholar]
- Sequeira KM, Tabesh A, Sainju RK, et al. Perfusion network shift during seizures in medial temporal lobe epilepsy. PLoS One. 2013;8(1):e53204. doi: 10.1371/journal.pone.0053204. [DOI] [PMC free article] [PubMed] [Google Scholar]
- Sperling MR, Alavi A, Reivich M, et al. False lateralization of temporal lobe epilepsy with FDG positron emission tomography. Epilepsia. 1995;36:722–727. doi: 10.1111/j.1528-1157.1995.tb01052.x. [DOI] [PubMed] [Google Scholar]
- Swartz BE, Brown C, Mandelkern MA, et al. The use of 2-deoxy-2-[18 F]fluoro-D-glucose (FDG-PET) positron emission tomography in the routine diagnosis of epilepsy. Mol Imaging Biol. 2002;4:245–252. doi: 10.1016/s1095-0397(01)00057-7. [DOI] [PubMed] [Google Scholar]
- Tae WS, Joo EY, Kim JH, et al. Cerebral perfusion changes in mesial temporal lobe epilepsy: SPM analysis of ictal and interictal SPECT. Neuroimage. 2005;24:101–110. doi: 10.1016/j.neuroimage.2004.08.005. [DOI] [PubMed] [Google Scholar]
- Tan KM, Britton JW, Buchhalter JR, et al. Influence of subtraction ictal SPECT on surgical management in focal epilepsy of indeterminate localization: a prospective study. Epilepsy Res. 2008;82(2–3):190–193. doi: 10.1016/j.eplepsyres.2008.08.007. [DOI] [PubMed] [Google Scholar]
- Taylor DC, Falconer MA, Bruton CJ, et al. Focal dysplasia of the cerebral cortex in epilepsy. J Neurol Neurosurg Psychiatry. 1971;34:369–387. doi: 10.1136/jnnp.34.4.369. [DOI] [PMC free article] [PubMed] [Google Scholar]
- Teixeira RA, Li LM, Santos SL, et al. Early development destructive brain lesions and their relationship to epilepsy and hippocampal damage. Brain Dev. 2003;25(8):560–570. doi: 10.1016/s0387-7604(03)00065-2. [DOI] [PubMed] [Google Scholar]
- Téllez-Zenteno JF, Hernández Ronquillo L, Moien-Afshari F, et al. Surgical outcomes in lesional and nonlesional epilepsy: a systematic review and meta-analysis. Epilepsy Res. 2010;89:310–318. doi: 10.1016/j.eplepsyres.2010.02.007. [DOI] [PubMed] [Google Scholar]
- Tenney JR, Rozhkov L, Horn P, et al. Cerebral glucose hypometabolism is associated with mitochondrial dysfunction in patients with intractable epilepsy and cortical dysplasia. Epilepsia. 2014;55:1415–1422. doi: 10.1111/epi.12731. [DOI] [PubMed] [Google Scholar]
- Tepmongkol S, Srikijvilaikul T, Vasavid P. Factors affecting bilateral temporal lobe hypometabolism on 18 F-FDG PET brain scan in unilateral medial temporal lobe epilepsy. Epilepsy Behav. 2013;29:386–389. doi: 10.1016/j.yebeh.2013.08.017. [DOI] [PubMed] [Google Scholar]
- Theodore WH, Newmark ME, Sato S, et al. [18 F]fluor-odeoxyglucose positron emission tomography in refractory complex partial seizures. Ann Neurol. 1983;14:429–437. doi: 10.1002/ana.410140406. [DOI] [PubMed] [Google Scholar]
- Theodore WH, Brooks R, Margolin R, et al. Positron emission tomography in generalized seizures. Neurology. 1985;35:684–690. doi: 10.1212/wnl.35.5.684. [DOI] [PubMed] [Google Scholar]
- Theodore WH, Rose D, Patronas N, et al. Cerebral glucose metabolism in the Lennox-Gastaut syndrome. Ann Neurol. 1987;21:14–21. doi: 10.1002/ana.410210105. [DOI] [PubMed] [Google Scholar]
- Theodore WH, Sato S, Kufta C, et al. Temporal lobectomy for uncontrolled seizures: the role of positron emission tomography. Ann Neurol. 1992a;32:789–794. doi: 10.1002/ana.410320613. [DOI] [PubMed] [Google Scholar]
- Theodore WH, Carson RE, Andreasen P, et al. PET imaging of opiate receptor binding in human epilepsy using [18 F]cyclofoxy. Epilepsy Res. 1992b;13:129–139. doi: 10.1016/0920-1211(92)90068-5. [DOI] [PubMed] [Google Scholar]
- Theodore WH, Gaillard WD, De Carli C, et al. Hippocampal volume and glucose metabolism in temporal lobe epileptic foci. Epilepsia. 2001;42:130–132. doi: 10.1046/j.1528-1157.2001.080874.x. [DOI] [PubMed] [Google Scholar]
- Theodore WH, Hasler G, Giovacchini G, et al. Reduced hippocampal 5HT1A PET receptor binding and depression in temporal lobe epilepsy. Epilepsia. 2007;48:1526–1530. doi: 10.1111/j.1528-1167.2007.01089.x. [DOI] [PubMed] [Google Scholar]
- Theodore WH, Martinez AR, Khan OI, et al. PET imaging of serotonin 1A receptors and cerebral glucose metabolism for temporal lobectomy. J Nucl Med. 2012a;53:1375–1382. doi: 10.2967/jnumed.112.103093. [DOI] [PMC free article] [PubMed] [Google Scholar]
- Theodore WH, Wiggs EA, Martinez AR, et al. Serotonin 1A receptors, depression, and memory in temporal lobe epilepsy. Epilepsia. 2012b;53:129–133. doi: 10.1111/j.1528-1167.2011.03309.x. [DOI] [PMC free article] [PubMed] [Google Scholar]
- Thom M, Blu¨mcke I, Aronica E. Long-term epilepsy-associated tumors. Brain Pathol. 2012;22(3):350–379. doi: 10.1111/j.1750-3639.2012.00582.x. [DOI] [PMC free article] [PubMed] [Google Scholar]
- Toczek MT, Carson RE, Lang L, et al. PET imaging of 5-HT1A receptor binding in patients with temporal lobe epilepsy. Neurology. 2003;60:749–756. doi: 10.1212/01.wnl.0000049930.93113.20. [DOI] [PubMed] [Google Scholar]
- Van Gompel JJ, Worrell GA, Bell ML, et al. Intracranial electroencephalography with subdural grid electrodes: techniques, complications, and outcomes. Neurosurgery. 2008;63(3):498–505. doi: 10.1227/01.NEU.0000324996.37228.F8. [DOI] [PubMed] [Google Scholar]
- Van Paesschen W, Dupont P, Sunaert S, et al. The use of SPECT and PET in routine clinical practice in epilepsy. Curr Opin Neurol. 2007;20:194–202. doi: 10.1097/WCO.0b013e328042baf6. [DOI] [PubMed] [Google Scholar]
- van’t Klooster MA, Huiskamp G, Zijlmans M, et al. Can we increase the yield of FDG-PET in the preoperative work-up for epilepsy surgery? Epilepsy Res. 2014;108:1095–1105. doi: 10.1016/j.eplepsyres.2014.04.011. [DOI] [PubMed] [Google Scholar]
- Varghese GI, Purcaro MJ, Motelow JE, et al. Clinical use of ictal SPECT in secondarily generalized tonic-clonic seizures. Brain. 2009;132(Pt 8):2102–2113. doi: 10.1093/brain/awp027. [DOI] [PMC free article] [PubMed] [Google Scholar]
- Victoroff JI, Benson F, Grafton ST, et al. Depression in complex partial seizures. Electroencephalography and cerebral metabolic correlates. Arch Neurol. 1994;51:155–163. doi: 10.1001/archneur.1994.00540140061016. [DOI] [PubMed] [Google Scholar]
- Vinton AB, Carne R, Hicks RJ, et al. The extent of resection of FDG-PET hypometabolism relates to outcome of temporal lobectomy. Brain. 2007;130:548–560. doi: 10.1093/brain/awl232. [DOI] [PubMed] [Google Scholar]
- Vivash L, Gregoire MC, Lau EW, et al. 18 F-flumazenil: a γ-aminobutyric acid A-specific PET for the localization of drug-resistant temporal lobe epilepsy. Radiotracer J Nucl Med. 2013;54:1270–1277. doi: 10.2967/jnumed.112.107359. [DOI] [PubMed] [Google Scholar]
- Von Oertzen J, Urbach H, Jungbluth S, et al. Standard magnetic resonance imaging is inadequate for patients with refractory focal epilepsy. J Neurol Neurosurg Psychiatry. 2002;73(6):643–647. doi: 10.1136/jnnp.73.6.643. [DOI] [PMC free article] [PubMed] [Google Scholar]
- Von Oertzen TJ, Mormann F, Urbach H, et al. Prospective use of subtraction ictal SPECT coregistered to MRI (SISCOM) in presurgical evaluation of epilepsy. Epilepsia. 2011;52:2239–2248. doi: 10.1111/j.1528-1167.2011.03219.x. [DOI] [PubMed] [Google Scholar]
- Wang DD, Blu¨mcke I, Coras R, et al. Sturge-Weber syndrome is associated with cortical dysplasia ILAE type IIIc and excessive hypertrophic pyramidal neurons in brain resections for intractable epilepsy. Brain Pathol. 2015;25(3):248–255. doi: 10.1111/bpa.12172. [DOI] [PMC free article] [PubMed] [Google Scholar]
- Weitemeyer L, Kellinghaus C, Weckesser M, et al. The prognostic value of [F]FDG-PET in nonrefractory partial epilepsy. Epilepsia. 2005;46:1654–1660. doi: 10.1111/j.1528-1167.2005.00258.x. [DOI] [PubMed] [Google Scholar]
- Wiebe S, Blume WWT, Girvin JP, et al. A randomized, controlled trial of surgery for temporal-lobe epilepsy. N Engl J Med. 2001;345(5):311–318. doi: 10.1056/NEJM200108023450501. [DOI] [PubMed] [Google Scholar]
- Willmann O, Wennberg R, May T, et al. The contribution of 18 F-FDG PET in preoperative epilepsy surgery evaluation for patients with temporal lobe epilepsy: a meta-analysis. Seizure. 2007;16:509–520. doi: 10.1016/j.seizure.2007.04.001. [DOI] [PubMed] [Google Scholar]
- Winston GP, Yogarajah M, Symms MR, et al. Diffusion tensor imaging tractography to visualize the relationship of the optic radiation to epileptogenic lesions prior to neurosurgery. Epilepsia. 2011;52:1430–1438. doi: 10.1111/j.1528-1167.2011.03088.x. [DOI] [PMC free article] [PubMed] [Google Scholar]
- Wong CH, Bleasel A, Wen L, et al. The topography and significance of extratemporal hypometabolism in refractory mesial temporal lobe epilepsy examined by FDG-PET. Epilepsia. 2010;51:1365–1373. doi: 10.1111/j.1528-1167.2010.02552.x. [DOI] [PubMed] [Google Scholar]
- Wong CH, Bleasel A, Wen L, et al. Relationship between preoperative hypometabolism and surgical outcome in neocortical epilepsy surgery. Epilepsia. 2012;53:1333–1340. doi: 10.1111/j.1528-1167.2012.03547.x. [DOI] [PubMed] [Google Scholar]
- Yang PF, Pei JS, Zhang HJ, et al. Long-term epilepsy surgery outcomes in patients with PET-positive, MRI-negative temporal lobe epilepsy. Epilepsy Behav. 2014;41:91–97. doi: 10.1016/j.yebeh.2014.09.054. [DOI] [PubMed] [Google Scholar]
- Yankam Njiwa J, Bouvard S, Catenoix H, et al. Periventricular [(11)C]flumazenil binding for predicting postoperative outcome in individual patients with temporal lobe epilepsy and hippocampal sclerosis. Neuroimage Clin. 2013;3:242–248. doi: 10.1016/j.nicl.2013.07.008. [DOI] [PMC free article] [PubMed] [Google Scholar]
- Yasuda CL, Cendes F. Neuroimaging for the prediction of response to medical and surgical treatment in epilepsy. Expert Opin Med Diagn. 2012;6:295–308. doi: 10.1517/17530059.2012.683408. [DOI] [PubMed] [Google Scholar]
- Zijlmans M, de Kort GA, Witkamp TD, et al. 3 T versus 1.5 T phased-array MRI in the presurgical work-up of patients with partial epilepsy of uncertain focus. J Magn Reson Imaging. 2009;30:256–262. doi: 10.1002/jmri.21811. [DOI] [PubMed] [Google Scholar]
- Zubal IG, Spencer SS, Imam K, et al. Difference images calculated from ictal and interictal technetium-99 m-HMPAO SPECT scans of epilepsy. J Nucl Med. 1995;36:684–689. [PubMed] [Google Scholar]


