Abstract
Mitochondrial products such as ATP, reactive oxygen species, and aspartate are key regulators of cellular metabolism and growth. Abnormal mitochondrial function compromises integrated growth-related processes such as development and tissue repair1,2, as well as homeostatic mechanisms that counteract ageing and neurodegeneration3, cardiovascular disease4,5, and cancer6,7. Physiologic mechanisms that control mitochondrial activity in such settings remain incompletely understood. Here we show that the atypical Fat1 cadherin acts as a molecular ‘brake’ on mitochondrial respiration that regulates vascular smooth muscle cell (SMC) proliferation after arterial injury. Fragments of Fat1 accumulate in SMC mitochondria, and the Fat1 intracellular domain interacts with multiple mitochondrial proteins, including critical factors associated with the inner mitochondrial membrane. SMCs lacking Fat1 (Fat1KO) grow faster, consume more oxygen for ATP production, and contain more aspartate. Notably, expression in Fat1KO cells of a modified Fat1 intracellular domain that localizes exclusively to mitochondria largely normalizes oxygen consumption, and the growth advantage of these cells can be suppressed by inhibition of mitochondrial respiration, which suggest that a Fat1-mediated growth control mechanism is intrinsic to mitochondria. Consistent with this idea, Fat1 species associate with multiple respiratory complexes, and Fat1 deletion both increases the activity of complexes I and II and promotes the formation of complex-I-containing supercomplexes. In vivo, Fat1 is expressed in injured human and mouse arteries, and inactivation of SMC Fat1 in mice potentiates the response to vascular damage, with markedly increased medial hyperplasia and neointimal growth, and evidence of higher SMC mitochondrial respiration. These studies suggest that Fat1 controls mitochondrial activity to restrain cell growth during the reparative, proliferative state induced by vascular injury. Given recent reports linking Fat1 to cancer, abnormal kidney and muscle development, and neuropsychiatric disease8–13, this Fat1 function may have importance in other settings of altered cell growth and metabolism.
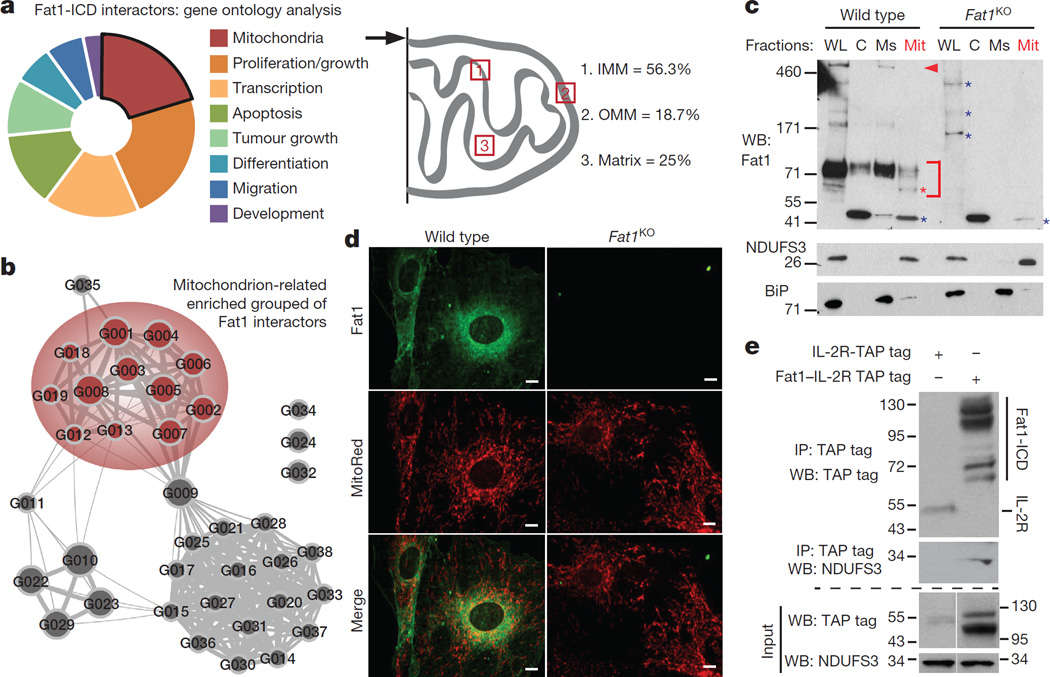
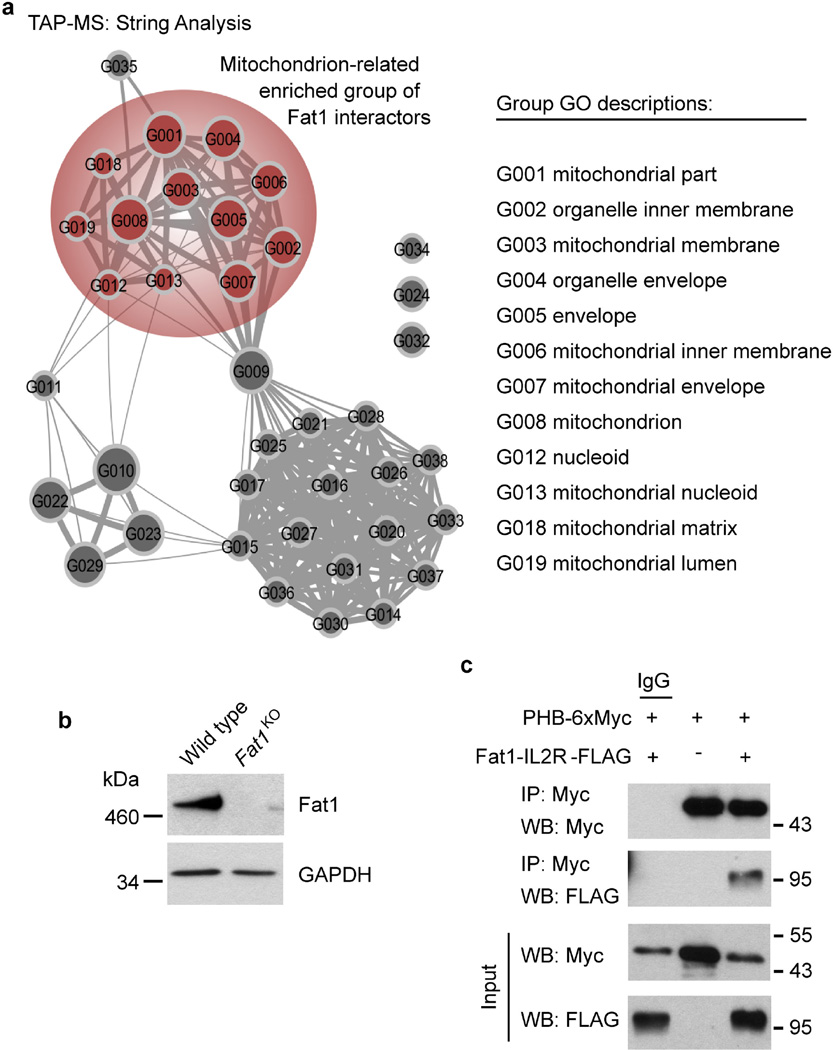
Proliferation of SMCs is essential for repair of injured arteries, but in excess can cause vascular obstruction leading to tissue ischaemia and/or infarction14. SMC expression of the atypical cadherin Fat1 is induced by both growth factor exposure and vascular injury; however, knockdown of Fat1 enhances SMC proliferation, and the Fat1 intracellular domain (Fat1 ICD), expressed as a chimaeric protein fused to the interleukin 2 receptor α-chain (denoted hereafter as Fat1–IL-2R), is sufficient to inhibit growth15. In addition, recent reports link FAT1 silencing and/or mutation to a spectrum of cancers8,9. To understand how Fat1 controls proliferation, we used tandem affinity purification (TAP) followed by peptide mass fingerprinting using matrix-assisted laser desorption/ionization time-of-flight mass spectrometry (TAP–MS) to identify proteins that interact with the Fat1 ICD. We noted that a surprisingly large fraction of candidate interactors associated with mitochondria, including several proteins that localize to the inner mitochondrial membrane (Fig. 1a, Extended Data Table 1); these observations were replicated in an unbiased independent bioinformatic analysis of the TAP–MS dataset (Fig. 1b, Extended Data Fig. 1a).
Figure 1. Fat1 fragments localize to SMC mitochondria and interact with inner mitochondrial membrane proteins.
a, Analysis of 30 top-ranked TAP–MS-validated Fat1 ICD interactors. IMM and OMM, inner and outer mitochondrial membrane, respectively (see Extended Data Table 1). b, Mitochondrial cluster in bioinformatic analysis of TAP–MS data (see Extended Data Fig. 1a). c, Fractionation of mouse aortic SMCs, followed by SDS–PAGE and immunoblotting. C, cytoplasmic; Mit, mitochondrial; Ms, microsomal; WL, whole-cell lysate. Arrowhead, full-length Fat1; bracket, Fat1 ICD species; red asterisk, mitochondrial-specific Fat1 ICD fragments; blue asterisk, non-specific signal. d, Mouse SMC confocal imaging. Scale bar, 10 µm. e, Co-immunoprecipitation of Fat1 ICD and NDUFS3 in 293T cells. For gel source data, see Supplementary Fig. 1.
We used a conditionally targeted mouse Fat1 allele (Fat1loxP)11 and Cre-mediated recombination to inactivate Fat1 expression in SMCs (Extended Data Fig. 1b). Cellular fractionation showed Fat1 fragments in the mitochondrial sample: immunoblotting using a Fat1 C-terminus-directed antiserum15 identified multiple specific signals between ~60–100 kDa, including an ~60 kDa band seen only in whole-cell and mitochondrial fractions (Fig. 1c). Confocal imaging of these cells showed Fat1 and mitochondrial co-localization (Fig. 1d). Identification of multiple inner mitochondrial membrane proteins in our screen (Fig. 1a, Extended Data Fig. 1a, Extended Data Table 1) suggests that Fat1 may associate with respiratory complexes; indeed, traditional co-immunoprecipitation studies confirmed interaction of the Fat1 ICD with NDUFS3, a complex-I-specific subunit (Fig. 1e), and with prohibitin, an important regulator of complex I stability and function16 (Extended Data Fig. 1c).
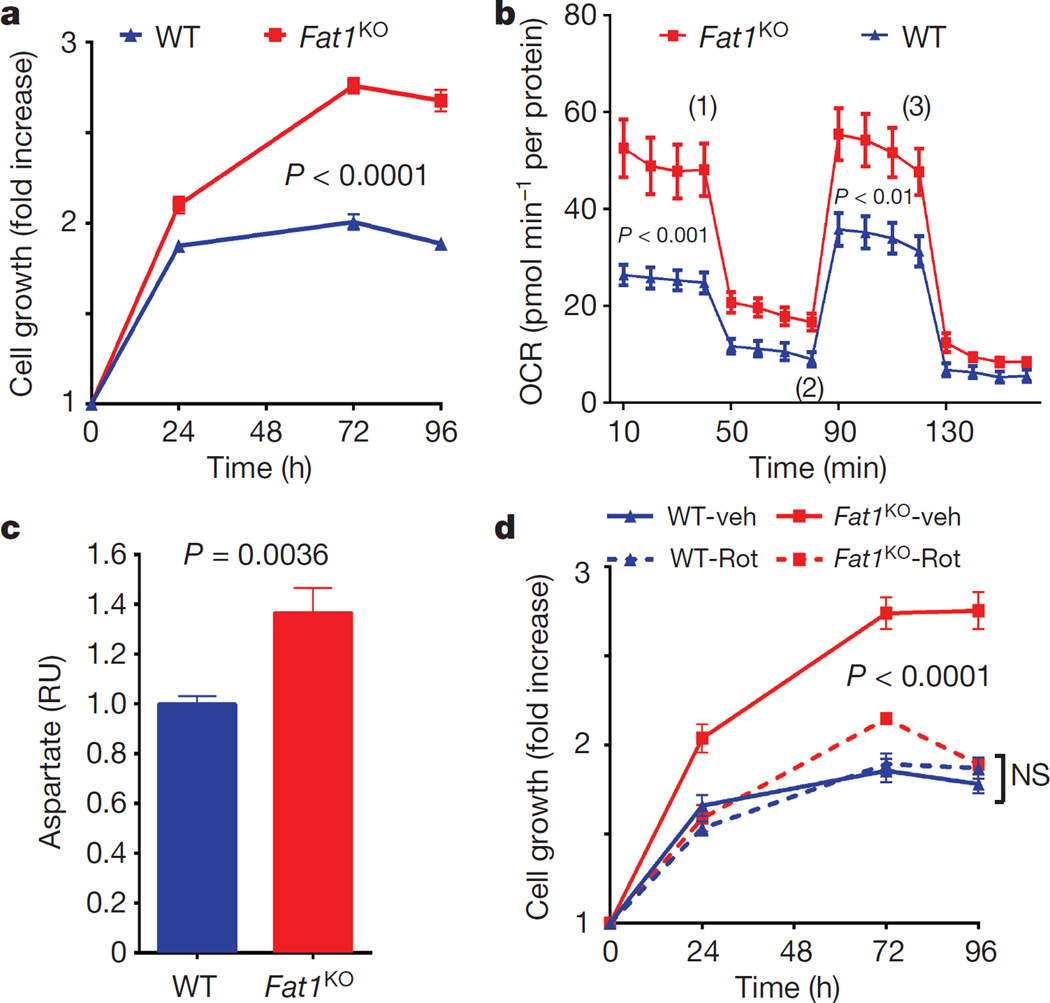
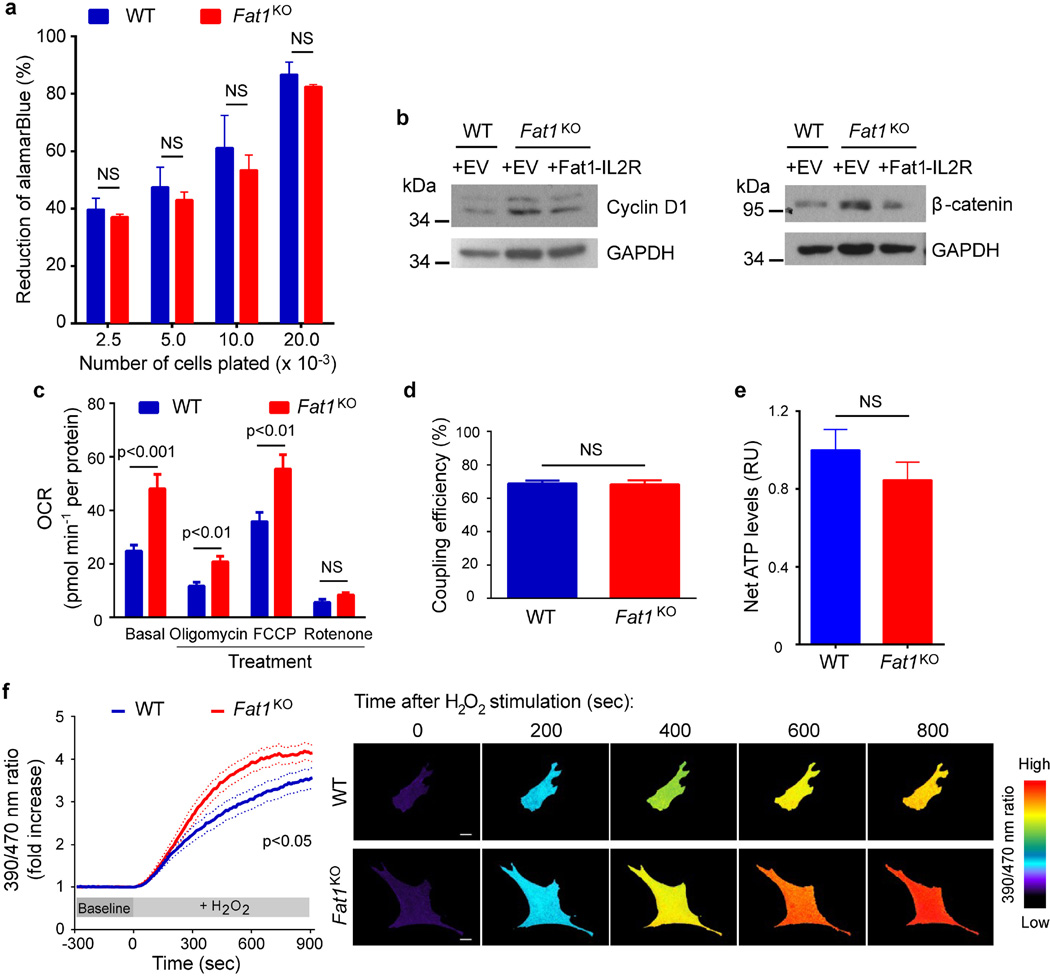
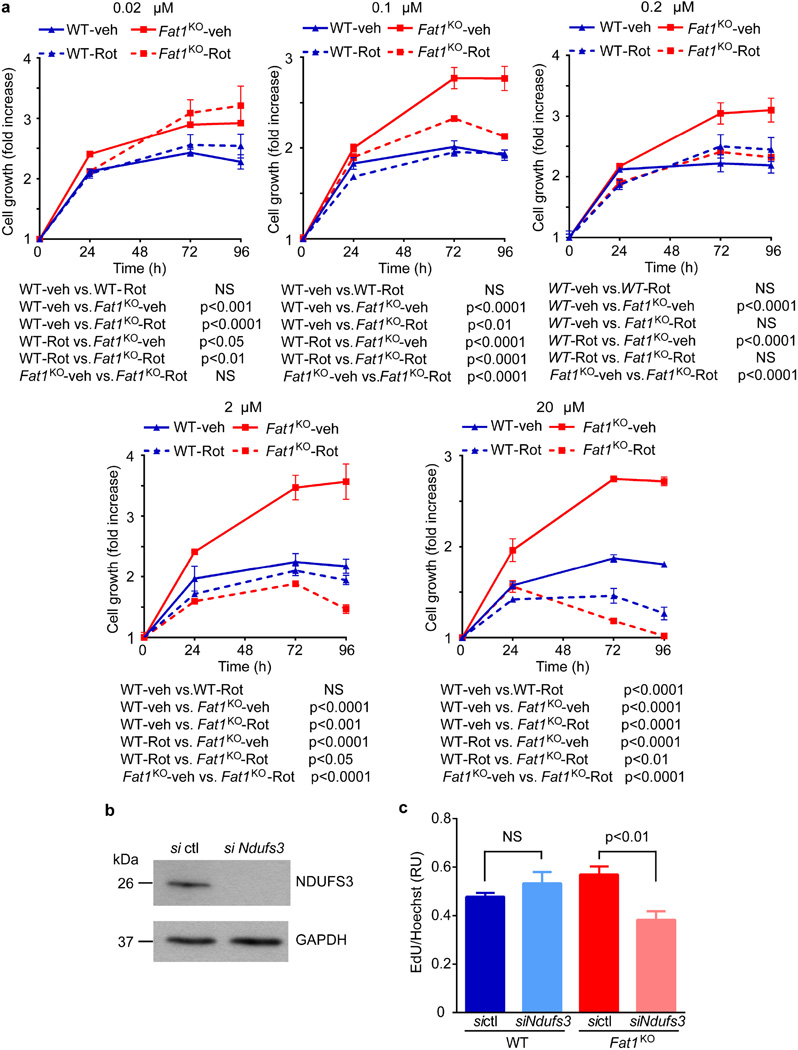
We then assessed growth and mitochondrial function. Resazurin (AlamarBlue) growth/viability assays were validated across a range of input cell numbers, and performed similarly for both wild-type and Fat1KO cells (Extended Data Fig. 2a). Evidence of higher proliferation in SMCs lacking Fat1 (Fig. 2a, Extended Data Fig. 2b) was normalized by restoring Fat1 expression with Fat1–IL-2R (Extended Data Fig. 2b). In assays of mitochondrial respiration using extracellular flux (Seahorse) analysis, Fat1KO SMCs exhibited higher baseline and maximal oxygen consumption rates (OCRs) compared to wild type (Fig. 2b, Extended Data Fig. 2c), with equal coupling efficiency (Extended Data Fig. 2d). Coupling efficiency reflects how effectively respiratory activity is translated into ATP production17, so higher ATP-linked oxygen consumption in Fat1KO SMCs indicates that these cells generate more ATP. Net ATP levels in wild-type and Fat1KO SMCs were similar (Extended Data Fig. 2e), which in turn suggests that consumption of ATP in Fat1KO SMCs is also increased. Reactive oxygen species, which also result from mitochondrial respiration, were present at similar levels under standard conditions, but were higher in Fat1KO cells after exposure to H2O2 (Extended Data Fig. 2f), suggesting a partially depleted capacity to buffer or inactivate reactive oxygen species when Fat1 is absent. Aspartate, a metabolite essential for macromolecular synthesis and cell proliferation, and a third key product of respiration18,19, was present at higher levels in Fat1KO SMCs (Fig. 2c). Mitochondrial respiration is essential for cell growth18,19, including that of SMCs20, so we tested its role in the increased growth of Fat1KO cells. Limiting respiration by either pharmacologic or genetic interference targeting complex I did not compromise wild-type cell growth, but suppressed the growth advantage of Fat1KO cells (Fig. 2d, Extended Data Fig. 3a–c). These studies suggest that physiologic Fat1 expression modulates SMC growth by restraining mitochondrial respiration, and that further limits on respiration in wild-type cells have no repercussion. By contrast, when Fat1 is absent, the corresponding loss of this restraint increases SMC growth. Overall, these in vitro studies identify Fat1 as an important suppressor of SMC growth, and show that potentiation of growth in the absence of Fat1 depends on increased respiration.
Figure 2. Fat1 suppresses SMC growth by restraining mitochondrial respiration.
a, Growth of mouse aortic SMCs. n = 6. b, OCR of SMCs at baseline and in response to oligomycin (1), carbonyl cyanide-p-trifluoromethoxyphenylhydrazone (FCCP, an uncoupling agent that disrupts ATP synthesis) (2), and rotenone (3). n = 10. c, SMC aspartate content. RU, relative units. n = 7, analysed by two-tailed t-test. d, SMC growth in response to 1 µM rotenone (rot) or vehicle (veh). n = 3. Data assessed by two-way ANOVA (a, b, d). All data shown as mean ± s.e.m.
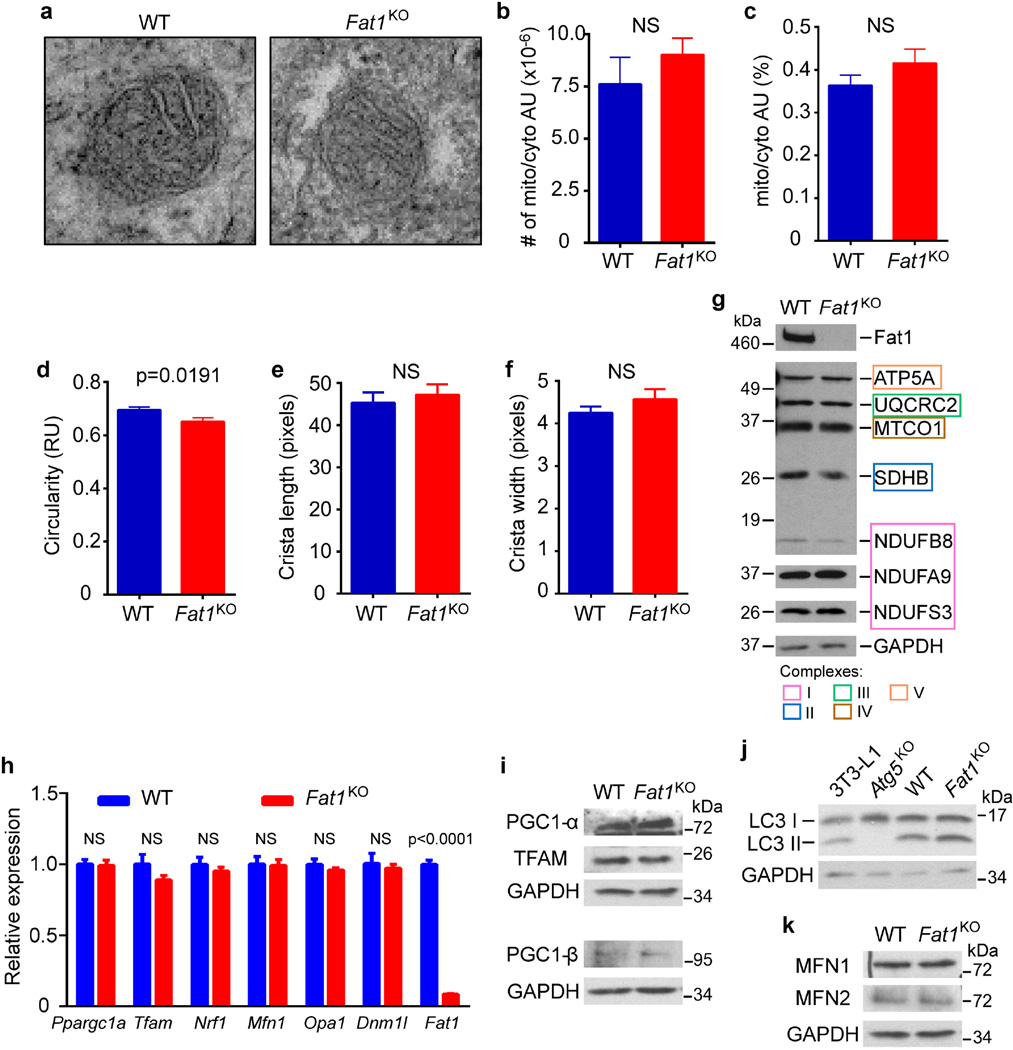
Respiration can be affected by changes in mitochondrial structure, mass, and/or dynamics, but mitochondria from wild-type and Fat1KO SMCs did not exhibit major ultrastructural differences by electron microscopy (Extended Data Fig. 4a–f). Likewise, we found no evidence for changes in (1) mitochondrial mass, on the basis of the levels of several respiratory chain subunits (Extended Data Fig. 4g), (2) mitochondrial biogenesis and autophagy, on the basis of expression of regulators of these respective processes21 (Extended Data Fig. 4h–j), or (3) mitochondrial dynamics, as reflected in fusion or fission gene expression (Extended Data Fig. 4h, k). Failing to identify differences in mitochondrial structure, mass, or turnover that could explain the increased respiration in Fat1KO SMCs, we surmised that loss of Fat1 might directly affect respiratory chain activity.
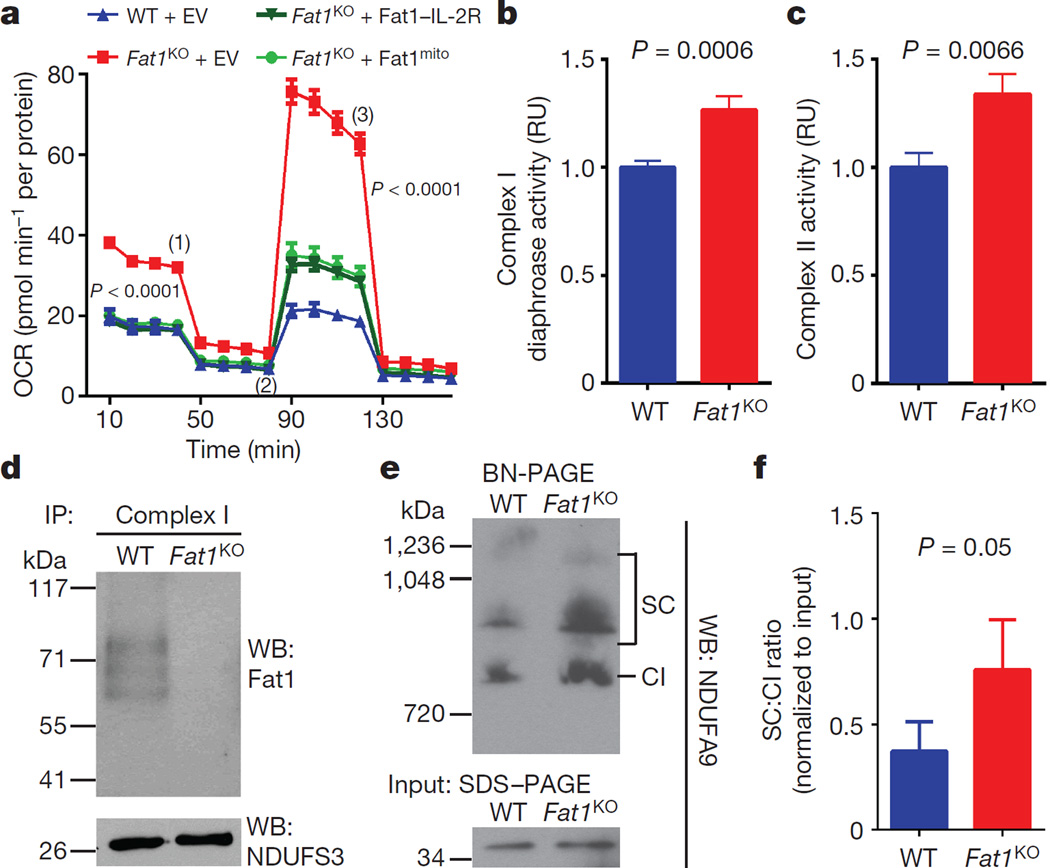
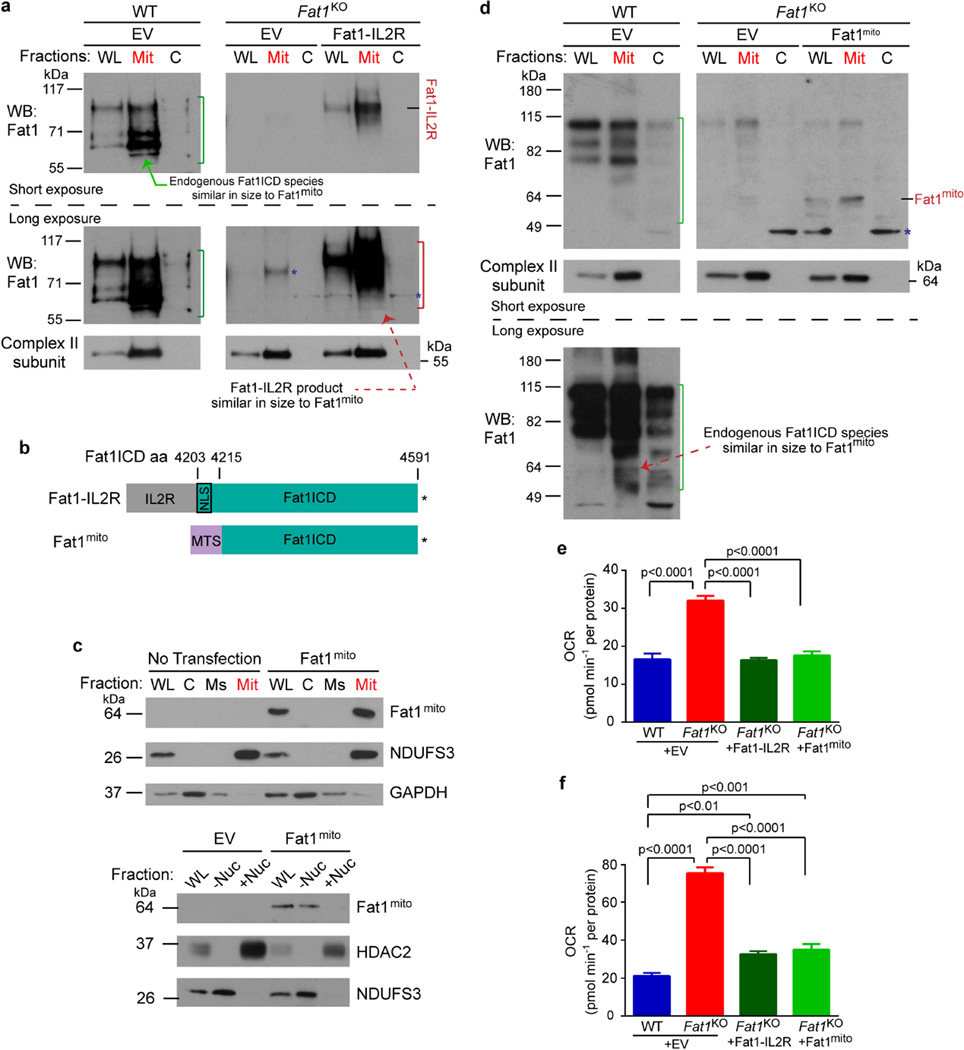
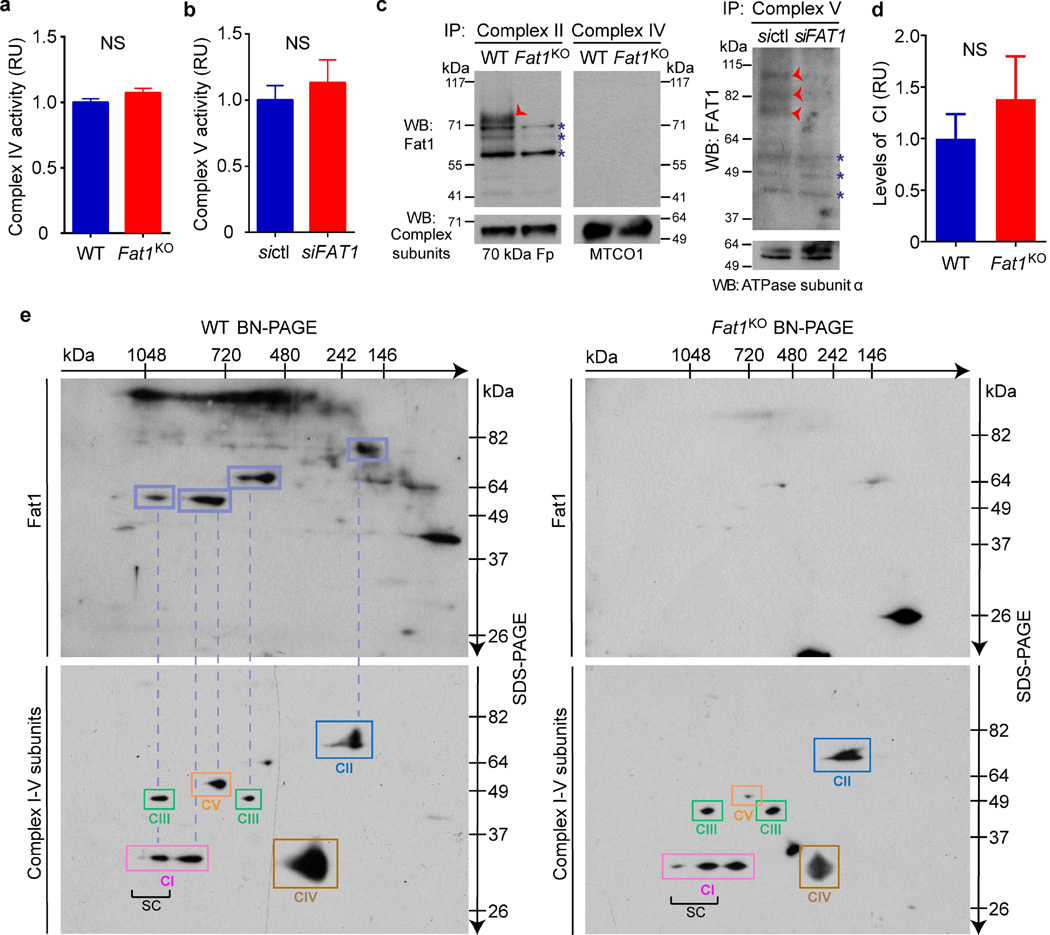
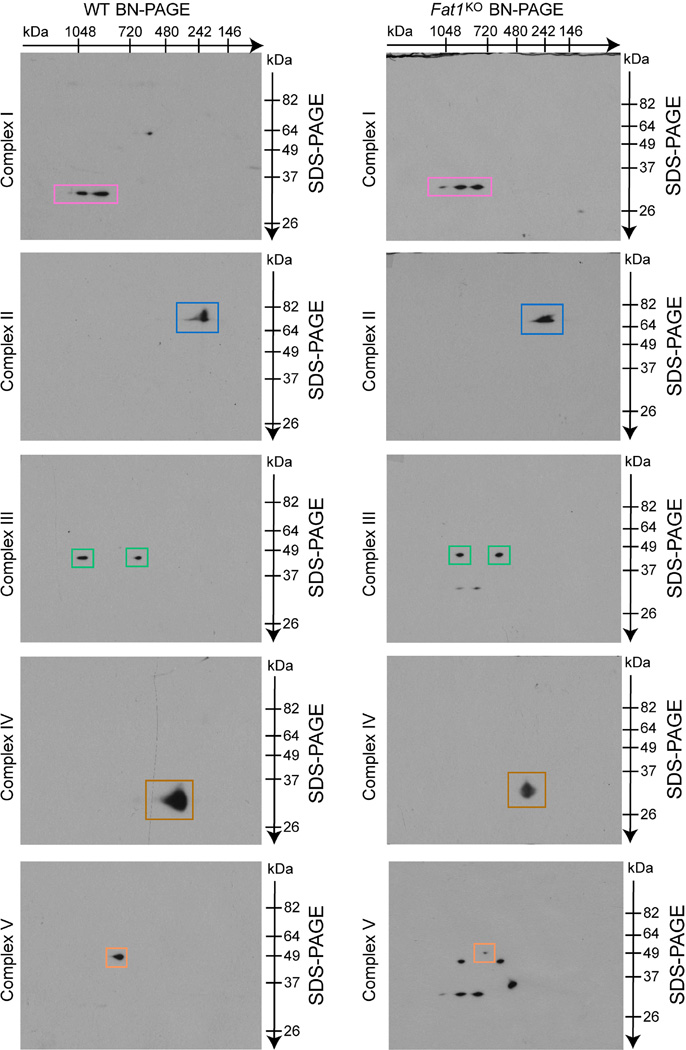
To assess this possibility, we tested if the Fat1 ICD was sufficient to control respiration. Expression of Fat1–IL-2R—which inhibits SMC growth15—limited respiration in Fat1KO SMCs (Fig. 3a), and yielded fragments in the mitochondrial fraction similar in size to endogenous mitochondrial Fat1 species (Extended Data Fig. 5a), but this fusion protein may also localize to other subcellular compartments. We generated and validated a mitochondria-targeted Fat1 ICD (Fat1mito, Extended Data Fig. 5b–d); Fat1mito repressed both baseline and maximal OCRs in Fat1KO cells (Fig. 3a, Extended Data Fig. 5e, f), demonstrating that the Fat1 ICD can suppress respiration through a mechanism intrinsic to mitochondria. Although expression of the Fat1–IL-2R fusion protein appeared stronger than that of Fat1mito (Extended Data Fig. 5a, d), the extent of OCR repression achieved was similar, perhaps indicating that only a subset of the Fat1–IL-2R-derived fragments are active in this capacity. To localize this effect within the respiratory chain, we assessed the activities of isolated respiratory complexes. Complexes I and II, but not IV or V, were more active in the absence of Fat1 (Fig. 3b, c, Extended Data Fig. 6a, b). Moreover, Fat1 ICD species of ~60–100 kDa were observed in association with immuno-captured complex I, II and V, but not complex IV (Fig. 3d, Extended Data Fig. 6c). To see if Fat1 affects respiratory complex integrity, we looked at intact mitochondrial complexes by blue native (BN)–PAGE analysis and found that in Fat1KO SMCs, complex I incorporation into supercomplexes is increased, without a significant change in the levels of native complex I (Fig. 3e, f, Extended Data Fig. 6d). It has been proposed that supercomplex conformation facilitates electron transfer without increasing production of reactive oxygen species22,23; however, the factors regulating supercomplex assembly are largely unknown. Orthogonal resolution of BN gels under denaturing conditions indicated a shift of complex I subunits towards supercomplex conformations in Fat1-deficient SMCs and no major differences in native complex II (Extended Data Figs 6e, 7). We observed ~60–100-kDa Fat1 species co-migrating with complex I, II, III, and V, but not complex IV. Notably, a subset of these species also co-migrated with a supercomplex containing at least complexes I and III (Extended Data Fig. 6e). These findings suggest that Fat1 limits SMC mitochondrial respiration by repressing complex I and II activities, and by opposing the incorporation of complex I into supercomplex structures.
Figure 3. The Fat1 ICD limits complex I and II activities, and complex-I-containing supercomplex formation in SMCs.
a, OCR after introducing Fat1–IL-2R or mitochondria-targeted Fat1 ICD (Fat1mito) into Fat1KO SMCs. (1), oligomycin; (2), FCCP; (3), rotenone; EV, empty vector. n = 15, analysed by one-way ANOVA. b, NADH oxidation by immunocaptured complex I from SMC lysates, expressed as fold-increase from wild type. Wild type n = 13, Fat1KO n = 11. c, Ubiquinol production by immunocaptured complex II. n = 16. d, SDS–PAGE and immunoblotting of proteins eluted from immunocaptured complex I. e, Native complex I (CI) and supercomplexes (SC) containing complex I in mouse SMC mitochondria by blue native (BN)–PAGE analysis. f, Quantification of SC to CI ratio from BN–PAGE analyses. n = 5. RU, relative units. Data analysed by two-tailed t-test (b, c, f). All data shown as mean ± s.e.m. For gel source data, see Supplementary Fig. 1.
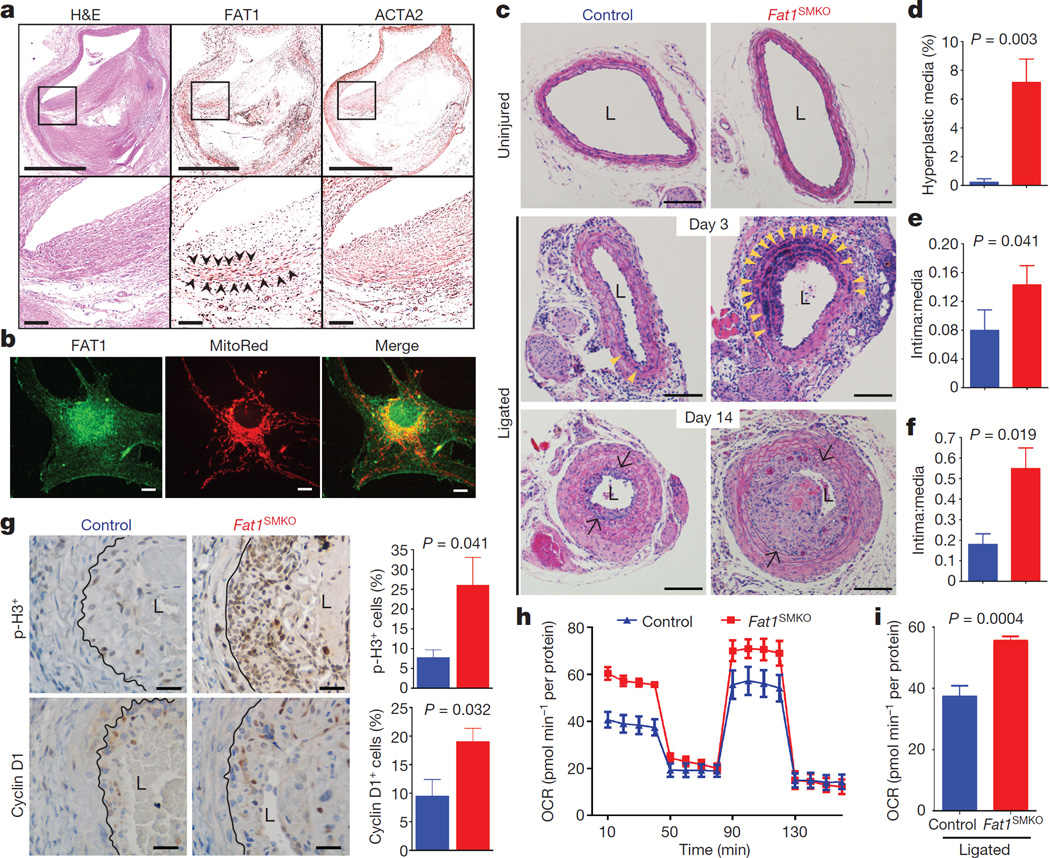
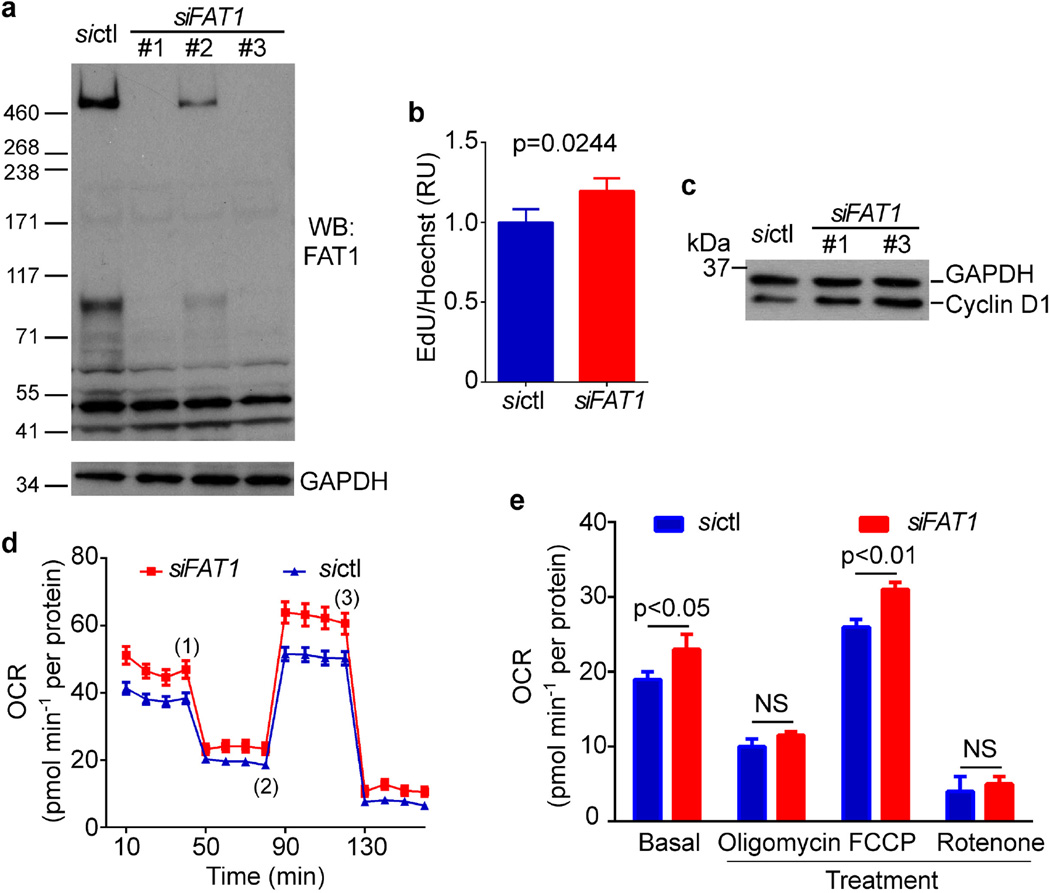
To assess Fat1 relevance to clinical vascular disease, we examined segments of diseased post-mortem human arteries adjacent to sites of prior stent placement. FAT1 expression coincided in many areas with ACTA2, a marker of SMCs (Fig. 4a). As it did in mouse SMCs, FAT1 in cultured human aortic SMCs (HASMCs) co-localized with mitochondria (Fig. 4b). Moreover, knockdown of FAT1 in HASMCs increased both cell proliferation (Extended Data Fig. 8a–c) and basal and maximal mitochondrial respiration (Extended Data Fig. 8d, e). Thus the effects of Fat1 on SMC mitochondrial activity and growth are conserved across species.
Figure 4. Fat1 restrains SMC growth and mitochondrial respiration after vascular injury.
a, Haematoxylin and eosin (H&E) stain and FAT1 and ACTA2 immunohistochemistry in restenotic human coronary arteries. Black squares are magnified in lower panels. Arrowheads, regions of co-expression. Scale bars, 1 mm (upper panels) and 100 µm (lower panels). b, Human SMC confocal imaging. Scale bar, 10 µm. c, H&E-stained mouse carotid arteries. Arrowheads, medial hyperplasia. Arrows, internal elastic lamina. L, lumen. Scale bar, 100 µm. d, Hyperplasia as percentage of total medial area. e, f, Intima:media ratio 3 and 14 days postinjury, respectively. n = 5 for control, n = 8 for Fat1SMKO (d–f). g, Phosphohistone H3 (p-H3) and cyclin D1 14 days after injury. Graphs, percentage of positive (brown) versus total neointimal cells. n = 6 for p-H3, n = 5 for cyclin D1. Black lines mark the internal elastic lamina. Scale bar, 25 µm. h, OCR of SMCs from ligated arteries, 3 days after injury. i, Basal respiration from h. n = 7, analysed by two-tailed t-test. Data analysed by two-tailed Mann–Whitney test (d–g). All data shown as mean ± s.e.m.
To test SMC Fat1 function in vivo, we crossed Fat1loxP and Tagln-cre mice24 to generate Fat1loxP/loxPTagln-cre (denoted hereafter as Fat1SMKO, for Fat1 smooth muscle cell knockout) animals (Extended Data Figs 1b, 9a, b). Baseline arterial structure appeared normal, with minimal Fat1 expression (Fig. 4c, Extended Data Fig. 9a). After vascular injury25, Fat1 appeared in the media and neointima of wild-type arteries, co-localizing with Acta2 and showing a perinuclear distribution consistent with findings in isolated cells (Figs 1d, 4b, Extended Data Fig. 9a, b). Injured arteries from Fat1SMKO mice showed markedly higher medial SMC hyperplasia and neointimal growth (Fig. 4c–f), increased phospho-histone H3 and cyclin D1 (Fig. 4g), and increased staining for nitrotyrosine, a marker of increased superoxide stress (Extended Data Fig. 9c). Moreover, SMCs from injured Fat1SMKO vessels exhibited higher OCRs than those from injured control vessels (Fig. 4h, i, Extended Data Fig. 9d). Thus, deletion of Fat 1 in SMCs in vivo permits an exaggerated vascular injury response characterized by SMC hyperproliferation and enhanced mitochondrial respiration, which supports the idea that Fat1 induction after vascular injury serves as a physiological regulator of SMC growth, in part by controlling mitochondrial function.
As a large, type-I transmembrane protein, full-length Fat1 appears an unlikely direct regulator of mitochondrial function. Previous studies describe cell-type-dependent cleavage of Fat1 that yields multiple smaller species, including Fat1-ICD-bearing derivatives of ~85 and ~65 kDa26. Although the precise structure of the physiologic mitochondrial Fat1 species that we have identified remains to be determined, in silico analysis of potential Fat1 C-terminal peptides that start at amino acids 4195, 4203, or 4478 yield, on the basis of MitoProtII27 analysis, respective probabilities of 0.5881, 0.1140, and 0.1548 for export to mitochondria. Moreover, a mitochondrial function for Drosophila Fat, an atypical cadherin most closely related to mammalian Fat4 (ref. 28), has recently been reported; a 68 kDa Drosophila Fat cytoplasmic fragment interacts with and stabilizes complex I28. This last finding contrasts notably with the increased respiratory activity that we find with Fat1 inactivation, and probably partly reflects the structural divergence between these cadherins29. Nevertheless, the finding that both Drosophila Fat and mammalian Fat1 participate in mitochondrial regulation is intriguing and perhaps suggests an ancient shared linkage between primordial cell surface proteins and control of mitochondrial function. Whether Fat4 is active in mitochondria, and how these distinct members of the Fat family might cooperate to regulate mitochondrial function, remain to be determined.
Although the factors or conditions that trigger Fat1 processing and translocation of C-terminal fragments to mitochondria have yet to be defined, our results suggest a relatively direct mechanism for sensing the extracellular milieu and relaying signals to mitochondria to control respiratory chain activity and thereby affect other key metabolic functions. This mechanism could potentially be targeted in hyperproliferative conditions in the cardiovascular system, as shown here, or in other scenarios. To this point, the loss or mutation of Fat1 (refs 8, 9) and the gain of Fat1 expression10,30 have both been linked to different cancers. In addition, mutations in the FAT1 gene have recently been implicated in abnormal renal development11 and skeletal muscle formation12, and FAT1 sequence variants have been associated with bipolar disorder, schizophrenia, and autism spectrum disorders13. The potential contribution of mitochondrial dysregulation in these divergent scenarios is an area for further study.
Online Content Methods, along with any additional Extended Data display items and Source Data, are available in the online version of the paper; references unique to these sections appear only in the online paper.
Methods
Protein interaction studies
Tandem affinity purification and mass spectrometry (TAP–MS) was performed using an IL-2R–Fat1-ICD fusion protein15 (Fat1–IL-2R) cloned into the pCTAP vector (240104, Agilent) to place tandem streptavidin and calmodulin binding peptides (SBP, CBP) at the C terminus of the chimaeric protein. A negative control construct included the IL-2R sequence, but not the Fat1 ICD. These constructs were transfected into 293T cells (ATCC), from which total protein lysates were sequentially purified with SBP and CBP beads (InterPlay TAP kit, Agilent). After gentle washing, purified protein complexes were eluted from CBP beads and concentrated (UFC500396, Amicon Ultra), resolved by SDS–PAGE, stained with Coomassie, and submitted for MS/MS analysis (Protein Core Facility, Columbia University) to identify Fat1 ICD associated proteins. MS/MS-validated proteins were scored on the basis of their abundance in the Fat1–IL-2R sample in comparison to the IL-2R control using the ProteoIQ software.
Bioinformatic analysis of the TAP–MS results addressed the 175 potential Fat1 ICD protein interactors with a MASCOT ratio (Fat1 ICD over control) greater than 2. To identify novel interactors, we used information on known protein–protein interactions available in the STRING database31. We downloaded all proteins that interacted with the 175 candidate interactors at the lowest confidence level in the database (STRING scores greater than 0.15), and calculated the Page Rank for each node (protein) in the STRING network at different confidence levels (low, 0.15; medium, 0.40; high, 0.70; highest, 0.90) using the Perl module Graph::Centrality::Pagerank, available in the CPAN repository (http://www.cpan.org/). Nodes with high PageRank fractions refer to highly connected proteins more likely to be pulled down by chance. From the intersection of proteins with ‘high’ and ‘highest’ STRING confidence scores, we isolated 108 novel Fat1 ICD interactors (Page Rank cutoff of < 0.005) and performed enrichment analysis with the DAVID Bioinformatics Resource32. Results were plotted using the EnrichmentMap plugin33 in Cytoscape 3.1 (ref. 34).
Interaction of the Fat1 ICD and endogenous NDUFS3 was assessed using the IL-2R and Fat1–IL-2R plasmids in TAP-based co-immunoprecipitation and immunoblotting. To evaluate Fat1-prohibitin (PHB) interaction, PHB cDNA amplified by RT–PCR from mouse spleen RNA was cloned into pCS2-6XMyc vector to generate a C-terminally tagged PHB–Myc. DelN Fat1-ICD CMV13-Flag35 and/or PHB pCS2-6XMyc plasmids were transfected into 293T cells. Protein lysates (300 µg) were pre-cleared with Protein G PLUS agarose beads (sc-2002, Santa Cruz) and mouse IgG1 isotype control (M075-3M2, MBL). PHB–Myc was captured with c-Myc beads (sc-40 AC, Santa Cruz), and co-immunoprecipitated proteins were eluted by boiling and assessed for c-Myc and Flag using immunoblotting.
Cell culture and imaging
Wild-type and Fat1KO mouse aortic SMCs were isolated from aortas of 5-week-old control and Fat1SMKO mice11,24 by collagenase–elastase digestion36. SMCs were maintained in Dulbecco’s modified eagle medium (DMEM) containing 20% fetal bovine serum (FBS), 1% l-glutamine, 100 U ml−1 penicillin, and 100 µg ml−1 streptomycin, and were passaged every three to four days. Cells between passages two and five were used for experiments; these early passage cells were not tested for mycoplasma. To evaluate population growth using the AlamarBlue assay (BUF012A, BIO-RAD), 5,000 cells were plated per well of a 96-well plate and followed for up to 96 h. Absorbances at 570 nm and 600 nm were measured on a Synergy 2 microplate reader (BioTek). Reduction of AlamarBlue correlates with the number of viable cells, and was calculated according to the manufacturer’s specifications and expressed as fold-change with respect to baseline. Where indicated, treatment with 0.02–20 µM rotenone or DMSO (vehicle) was administered at 0 and 24 h. Human aortic smooth muscle cells (HASMCs, Clonetics) were maintained in Medium 199 supplemented as indicated for DMEM, and passaged every four to five days.
To assess proliferation, mouse SMCs were incubated with EdU for six hours before being fixed, permeabilized, and stained for EdU and total DNA (Hoechst stain), as advised by the manufacturer (C10337, ThermoFisher Scientific). Fluorescent signals (excitation:emission (Ex:Em) = 495:519 nm for EdU, 350:461 nm for Hoechst) were measured on a Synergy 2 microplate reader (BioTek), and EdU incorporation was expressed as the ratio of EdU to Hoechst signals. In some studies, wild-type and Fat1KO cells were transfected with 25 nM of control or Ndufs3 small interfering RNA (siRNA) (sense sequence 5′-GCAGAACCGUUUUGAGAUUTT-3′; s86598, Ambion) on 60 mm culture dishes using TransIT-X2 (MIR6000, Mirus). The following day, cells were transferred onto 96-well plates at 2,000 cells per well, and grown for an additional three days before EdU incorporation was measured. HASMCs were transfected with 12 nM of control or FAT1 siRNA (sense sequence 5′-CAGCGAAUGUAACAGUACAtt-3′; s5035, Ambion) on 60 mm culture dishes using TransIT-X2 (MIR6000, Mirus). Two days after transfection, cells were transferred onto 96-well plates at 3,000 cells per well and grown for an additional two days before EdU assay.
Co-localization studies were performed as follows: SMCs were seeded onto glass coverslides, stained with 60 nM Mitotracker Red (M-7512, Life Technologies) for 40 min at 37 °C, fixed with 4% paraformaldehyde (PFA) in phosphate buffer saline (PBS) for 15 min at 37 °C, blocked overnight (0.2% milk, 2% normal goat serum, 0.1 M glycine, 2% BSA, and 0.15% Triton-X-100 in PBS), and stained for Fat1 using specific antisera15 and Alexa Fluor 488 goat anti-rabbit IgG secondary antisera in 0.2% BSA in PBS. SMCs lacking Fat1 and omission of the primary antibody served as controls for signal specificity. Fluorescent signals were visualized using a 4-D spinning-disk confocal microscope (Perkin-Elmer) with a 40× (1.3 NA) objective attached to a digital camera (Orca ER; Hamamatsu). Images were analysed with the Image-J (v1.48v) software.
Electron micrography of wild-type and Fat1KO SMCs was performed in the Albert Einstein College of Medicine Analytical Imaging Facility using standard fixation and imaging procedures. Micrographs were analysed using the Image-J (v1.48v) software.
Mitochondrial studies
Cellular fractions highly enriched for mitochondria were isolated using the Qproteome Mitochondria Isolation Kit (37612, Qiagen). Cells were lysed and further disrupted by passing the lysate through a 26-gauge, blunt-end needle, and mitochondria were isolated using differential centrifugation, followed by density gradient separation. Compartmental markers such as BiP and GAPDH (Fig. 1c, Extended Data Fig. 5c) indicated efficient though not absolute fractionation of mitochondrial components.
Mitochondrial oxygen consumption rate (OCR) was measured using a XF96 Extracellular Flux Analyzer (Seahorse Biosciences) following manufacturer’s instructions. Mouse SMCs were plated on a Seahorse 96-well assay plate at 5,000 cells per well, and tested in minimal assay media containing 5 mM glucose, 4 mM pyruvate, and 2 mM l-glutamine. The following drugs were injected to achieve the indicated final concentration: oligomycin (2 µg ml−1), FCCP (3 µM), and rotenone (2 µM). Total protein was isolated from each well and quantified for normalization after the assay. When indicated, Fat1KO SMCs were electroporated (Neon System, Life Technologies) with plasmids encoding Fat1–IL-2R, Fat1mito, or empty pcDNA3.1 vector, immediately seeded at 6,000 cells per well onto Seahorse plates, and allowed to recover for three days before measuring OCR. To evaluate respiration in HASMCs, cells were transfected with 12 nM of control or FAT1 siRNA (s5035, Ambion) on six-well culture plates using TransIT-X2 (MIR6000, Mirus). Three days after transfection, HASMCs were re-plated onto Seahorse plates at 3,000 cells per well, and OCR was measured as described. To evaluate respiration in SMCs after vascular injury, ligated arteries and their uninjured counterparts were collected from control and Fat1SMKO mice three days after arterial ligation using the collagenase–elastase method36, seeded on a Seahorse 96-well plate at 15,000 cells per well, and allowed to recover for ~80 h before OCR was measured. OCRs from validated mouse aortic SMC cultures were used to normalize and account for technical variability between experiments.
To target the Fat1 ICD to mitochondria, we assembled the Fat1mito construct, which includes the first 58 amino acids (with the mitochondrial targeting sequence) of the mouse thioredoxin-2 protein (GenBank accession NM_019913) and amino acids 4,215–4,591 of mouse Fat1, and cloned it into the pcDNA3.1 expression vector. Mitochondria-specific localization of this fusion protein was confirmed by cellular fractionation (Qiagen) of SMCs and 293T cells, followed by SDS–PAGE and immunoblotting with Fat1 antisera15.
ATP was measured using a bioluminetric assay (30020-1 Biotium, Inc.) in wild-type and Fat1KO SMCs. Micromolar concentrations of ATP were calculated using a standard curve and normalized to percentage of AlamarBlue reduction as a surrogate for cell number to estimate net ATP levels per cell. Data were expressed as fold change respect to wild type.
Reactive oxygen species (ROS) levels were assessed by transfection of wild-type and Fat1KO cells with a thiol redox-sensitive ratiometric sensor, reduction-oxidation-sensitive GFP (roGFP, Addgene plasmid 49435)37 using TransIT-X2 (MIR6000, Mirus). After two days, cells were imaged on CELLview glass bottom dishes (5662-7860Q, USA Scientific) containing buffer with divalent cations (125 mM NaCl, 5 mM KCl, 1 mM KH2PO4, 5 mM glucose, 10 mM NaHCO3, 1 mM MgCl2, 1 mM CaCl2, and 20 mM HEPES) at 37 °C38. Live cell images were acquired using IX81ZDC wide-field microscope (Olympus) and a single CoolsnapHQ2 (Photometrics) cooled CCD-camera on the bottom 100% throughput port of the microscope. For ratiometric determination of cellular ROS content, cells were sequentially imaged with a 40× magnification objective lens (Olympus; UIS2 40X DIC N/A 1.3) using excitation light from a 100 W Hg arc lamp and bandpass filter FF390/40 (Semrock) (targeting the 400 nm excitation peak of the oxidized form of roGFP) and bandpass filter ET470/40 (Chroma Technology) (targeting the 484 nm excitation peak of the reduced form of roGFP). Fluorescence emissions were detected through a bandpass filter ET525/50 (Chroma Technology). Neutral density filters of 10% to 25% transmission (ND 1.0–0.6) were routinely used to reduce the intensity of the excitation light to prolong cell viability. The camera exposure times for 390 nm and 470 nm excitations and the respective emission detections at 525 nm were maintained at a 2:1 ratio to maximize the light collection within the dynamic range of the detector. Typically, this was on the order of 200–600 ms, depending on the expression levels of the roGFP probe in a cell. Cells were imaged at 10-s intervals for 5 min, and for an additional 15 min after stimulation with 50 µM H2O2. Images were processed as previously described39. In brief, images were corrected for camera noise and for uneven illumination within the field of view, followed by background subtraction and a histogram-threshold-based masking. At each time point, processed images for each excitation wavelength were divided to obtain the ratiometric (390:470 nm) value, which was then expressed as fold increase above the average baseline (before H2O2 stimulation) ratio.
Aspartate levels were measured using a colourimetric assay (ab102512 Abcam) in total cell lysates from wild-type and Fat1KO SMCs. Data was corrected by subtracting the background as suggested by the manufacturer. Nanomoles of aspartate per sample were calculated using a standard curve and normalized to mg of protein per sample as a surrogate for cell number, and data were expressed as fold change respect to wild type.
Respiratory complex activities and Fat1-complex association were assessed as follows. Mitochondrial complex I activity was evaluated in wild-type and Fat1KO SMCs using the complex I activity microplate assay kit (ab109721, Abcam) in accordance with the manufacturer’s instructions. The rate of oxidation of NADH to NAD+ was measured after immunocapturing complex I from 200 µg of total protein lysate. Enzymatic (diaphorase) activity was calculated as the change in absorbance (1,000 × (optical density at 450 nm)) per minute (abbreviated as mOD/min). Complex II activity was evaluated using the corresponding assay (ab109908, Abcam), measuring ubiquinol production after immunocapturing complex II from 100 µg of total protein lysate, with enzymatic activity measured as a decrease in absorbance at 600 nm per minute (mOD/min). Complex IV activity was tested using the corresponding assay (ab109911, Abcam), with the rate of cytochrome C oxidation measured after immunocapturing complex IV from 70 µg of total protein lysate, and enzymatic activity measured as a decrease in absorbance at 550 nm per minute (mOD per min). Complex V activity was measured in human aortic SMCs treated with control or FAT1 siRNA using the ATP synthase enzyme activity microplate assay kit (ab109714, Abcam). Hydrolysis of ATP to ADP and phosphate was measured after immunocapturing complex V from 90 µg of total protein lysate. Enzymatic activity was measured as a decrease in absorbance at 340 nm per minute (mOD per min). Negative controls were run in every assay, a Synergy 2 microplate reader (BioTek) was used to measure absorbance, and data were expressed as fold-change respect to wild-type cells. After the enzymatic assays, plates were washed with PBS, and proteins were eluted from immunocaptured respiratory complexes by adding 10 µl per well of RIPA buffer with protease inhibitors plus 6× Laemmli protein loading buffer, and incubating the plate at 85 °C for 10 min. Recovered proteins were studied by immunoblotting for Fat1 fragments and respiratory complex subunits.
Respiratory complex conformations were evaluated by blue native (BN)/SDS–PAGE. First dimension BN–PAGE was performed by solubilizing wild-type and Fat1KO mitochondria isolates with 1% Digitonin and complex resolution using NativePAGE 3–12% Bis–Tris gel electrophoresis (Life Technologies). Second dimension analysis involved reducing and alkylating separated proteins, loading the gel strip onto a 10% Tris-Glycine gel, and performing SDS–PAGE, following by immunoblotting for specific complex components and Fat1. Native Complex I and supercomplex levels were analysed with the Image-J (v1.48v) software.
Animal models
Tagln-cre and Fat1loxP/loxP mice have been described previously11,24. We crossed Tagln-cre (129SV background) and Fat1loxP/loxP (129SV/C57BL6 mixed background) mice to generate Fat1loxP/loxP (control) and Fat1loxP/loxP Tagln-cre (Fat1SMKO) mice, using a breeding strategy to produce both genotypes within the same litter. Eight to ten week old male mice were studied. All animals were housed in pathogen-free conditions. Procedures followed rules and regulations of the AAALAC, and were approved by the Institutional Animal Care and Use Committee (IACUC) of Albert Einstein College of Medicine. Vascular injury in mice was performed using the carotid artery ligation model, as described previously25. Mice were anaesthetized with ketamine/xylazine. The left common carotid artery was ligated with 6-0 suture just proximal to the carotid bifurcation, and the unmanipulated right carotid artery served as a control. Carotid arteries were collected at different time points up to 14 days after ligation. For collection, mice were euthanized with ketamine/xylazine and exsanguination, and the central vasculature was flushed with PBS and perfused with 4% PFA in PBS for 7 min. Arteries were removed, post-fixed with 4% PFA in PBS overnight, processed before being embedded in paraffin, and cross-sectioned (5 µm thickness) for subsequent studies. Morphometric analysis of arteries was performed using the ImageJ software as follows: the area of the lumen, the area inside the internal elastic lamina, and the area inside the external elastic lamina were measured in pixels, and the areas of the intima and media were calculated. The size of the neointima was expressed as the intima:media ratio. Areas of medial hyperplasia were measured in pixels and expressed as percentage of the total medial area. For immunohistochemical evaluation, arterial sections were deparaffinized and rehydrated. Endogenous peroxidase activity was neutralized before tissues were boiled in antigen retrieval solution (H-3300, Vector Labs). Sections were then blocked (2% BSA, 10% normal goat serum, and avidin blocking solution (Vector Labs) in PBS), incubated with primary antibody (in 2% BSA, 10% normal goat serum, and biotin blocking solution (Vector Labs) in PBS), incubated with biotinylated secondary antibody (Vector Labs) at a concentration of 1:500, incubated with ABC reagent (PK-6100, Vector Labs), incubated with DAB/substrate/chromagen system (K3467, Dako), and finally, counterstained with haematoxylin (H-3404, Vector Labs). Omission of primary antibodies served as controls for signal specificity, and the samples were imaged using a COOLSCOPE digital microscope (Nikon). For immunofluorescence studies, arterial sections were deparaffinized, rehydrated, and boiled in antigen retrieval solution (H-3300, Vector Labs). Sections were then incubated in blocking solution (0.3% Triton-X-100, 2% BSA, and 10% normal goat serum in PBS) overnight. Primary antibodies were applied in blocking solution, and fluorochrome-conjugated secondary antibodies were applied in 0.3% Triton-X-100, 2% BSA in PBS. Omission of primary antibodies served as controls for signal specificity. The sections were mounted with Fluoro-Gel II (with DAPI) mounting medium (17985-50, Electron Microscope Sciences) and visualized with an Axio Observer.Z1 (Zeiss) fluorescence microscope.
Human coronary artery studies
Staining of human coronary artery samples was performed using formalin-fixed paraffin-embedded human coronary artery atherosclerotic plaque sections obtained from the CVPath Institute Sudden Cardiac Death Registry. To evaluate restenotic samples, we chose artery segments adjacent to the site of a bare-metal stent implanted within the preceding 30 days. H&E stain and immunohistochemistry for FAT1 and ACTA2 were performed. The immunohistochemical staining was developed by NovaRED kit (Vector Laboratories, Burlingame, CA). The images were captured by Axio Scan. Z1 (Zeiss, Germany) using a 20× objective, and figures were prepared on the HALO image analysis platform (Indica Labs, Corrales, NM).
Antibodies
We used antibodies against Fat1 (ref. 15) (1:10,000 for western blot (WB), 1:2,000 for immunofluorescence (IF), 1:2,000 for immunohistochemistry (IHC)), BiP (1:5,000 for WB, 610979, BD Biosciences), Flag (1:15,000 for WB, F3165, Sigma), cyclin D1 (1:1,000 for WB, 1:200 for IHC, 2978S, Cell Signaling), total OXPHOS cocktail (1:1,000 for WB, ab110413, Abcam), LC3 I/II (1:1,000 for WB, 2775S, Cell Signaling), complex I NDUFA9 (1:1,000 for WB, ab14713, Abcam), complex II 70 kDa Fp subunit (1:10,000 for WB, 459200, Invitrogen), complex III subunit core 1 (1:2,000 for WB, 459140, Invitrogen), complex IV MTCO1 (1:2,000 for WB, ab14705, Abcam), complex V ATP synthase subunit α (1:1,000 for WB, 459240, Life Technologies), ACTA2 (1:200 for IHC, M0851 Clone 184, DAKO), phospho-histone H3 (1:150 for IHC, 9701, Cell Signaling), transgelin (1:250 for IF, ab14106, Abcam), calponin 1 (1:200 for IF, ab46794, Abcam), pecam1 (1:200 for IF, ab28364, Abcam), anti-mouse IgG HRP (1:10,000, 115-036-072, Jackson ImmunoResearch Labs), Alexa Fluor 488 conjugated anti-rabbit (1:250, 111-545-047, Jackson ImmunoResearch), Alexa Fluor 546 conjugated anti-mouse (1:250, A-11003, Molecular Probes). The following antibodies were from Santa Cruz: complex I NDUFS3 (1:600 for WB, sc374282), c-Myc (1:20,000 for WB, sc789), β-catenin (1:800 for WB, sc7963), PGC1-α (1:150 for WB, sc13067), PGC1-β (1:100 for WB, sc373771), Tfam (1:150 for WB, sc23588), Mfn1 (1:600 for WB, sc50330), Mfn2 (1:600 for WB, sc50331), Acta2 (1:200 for IF, sc32351), nitrotyrosine (1:250 for IF, sc32757), GAPDH (1:8,000 for WB, sc25778), anti-rabbit IgG HRP (1:10,000, sc2030), and anti-goat IgG HRP (1:10,000, sc2056).
PCR
RNA was isolated from wild-type and Fat1KO SMCs with Trizol (Life Technologies), and cDNA was generated using Superscript III (Life Technologies). Quantitative reverse-transcription PCR (qRT–PCR) was performed using the SYBR Green system (Roche) on a Lightcycler 480 instrument (Roche). The relative abundance of each transcript was calculated using the ΔΔCt method, with the Rpl13a housekeeping gene as reference. We used the following PCR primers.
Mouse genotyping
Fat1loxP allele forward 5′-GTCTGTGTTTGGCCTGAAGACGTA-3′, Fat1loxP allele reverse 5′-TTGATGTTGGTGTTGGGAAGTGCT-3′; cre transgene forward IMR1084 (Jackson Labs), cre transgene reverse IMR1085 (Jackson Labs); Fat1Δ allele forward 5′-GTCTGTGTTT GGCCTGAAGACGTA-3′, Fat1Δ allele reverse 5′-TAGACAAACCATCACAGGCTGCCT-3′. qRT–PCR. Ppargc1a forward 5′-GAAAGGGCC AAACAGAGAGA-3′, Ppargc1a reverse 5′-GTAAATCACACGGCGCTCTT-3′; Tfam forward 5′-CAAAGGATGATTCGGCTCAG-3′, Tfam reverse 5′-AAGCTGAATATATGCCTGCTTTTC-3′; Nrf1 forward 5′-TGGAGT CCAAGATGCTAATGG-3′, Nrf1 reverse 5′-GCGAGGCTGGTTACCACA-3′; Opa1 forward 5′-ACCAGGAGAAGTAGACTGTGTCAA-3′,Opa1 reverse 5′-TCTTCAAATAAACGCAGAGGTG-3′; Dnm1l forward 5′-GCTAGTCCACGTTTCACCAGA-3′, Dnm1l reverse 5′-TCCATGTGGCAGGGTCAT-3′; Mfn1 forward 5′-GTGAGCTTCACCAGTGCAAA-3′, Mfn1 reverse 5′-CACAGTCGAGCAAAAGTAGTGG-3′; Rpl13a forward 5′-GCTTACCTGGGGCGTCTG-3′, Rpl13a reverse 5′-ACATTCTTTTCTGCCTGTTTCC-3′.
Statistical analysis
In general, at least three independent experiments were performed for each dataset, with a minimum n number of three biological replicates. No statistical methods were used to predetermine sample size for in vitro experiments. Comparisons between two groups were analysed by two-tailed t-test, and comparison between three or more groups were assessed by analysis of variance (ANOVA) followed by post-hoc test where appropriate. Significance was accepted for P < 0.05. All statistical analyses were performed and P values were obtained using the GraphPad Prism software 6.0. In the animal studies, the sample size was estimated40 for a power of 80% and type I error of 0.05 to detect a 1.5- or 1-fold change in the size of neointima measured as the intima:media ratio 3 or 14 days after ligation, respectively. No animals were excluded. The breeding strategy was set up to generate both genotypes of interest within the same litter and mice were allocated into two groups according to their genotypes and not by randomization. The investigator who performed carotid artery ligation remained blinded to group allocation during experiments and outcome assessments.
Extended Data
Extended Data Figure 1. Fat1 ICD associates with inner mitochondrial membrane proteins.
a, Description of subgroups within the mitochondrial cluster identified by STRING, PageRank, and DAVID enrichment analysis of TAP–MS results. GO, gene ontology. b, Western blotting for Fat1 expression in mouse aortic SMCs. c, Co-immunoprecipitation of Fat1 ICD and prohibitin (PHB) in 293T cells. IP, immunoprecipitation; performed with IgG (control) or Myc antibody, as indicated. WB, western blot. For gel source data, see Supplementary Fig. 1.
Extended Data Figure 2. Loss of Fat1 increases expression of pro-proliferative gene products and ATP turnover, but does not affect basal ROS levels in SMCs.
a, AlamarBlue assay in mouse aortic SMCs plated at specified, matched cell densities, showing correlation of AlamarBlue reduction across a range of input cell numbers (n = 3). b, Expression of cyclin D1 and β-catenin in mouse aortic SMCs with indicated treatments. EV, empty vector. c, Quantification of OCR in mouse aortic SMCs from Fig. 2b (n = 10). d, Coupling efficiency calculated as percentage of reduction in OCR after oligomycin treatment (n = 10). e, Net ATP levels in mouse aortic SMCs. RU, relative units (n = 5). f, ROS levels in mouse aortic SMCs, measured with a redox-sensitive ratiometric sensor, roGFP. Left, Ratiometric (390/470 nm) value, representing the oxidative state of the sensor and intracellular ROS levels, and expressed as fold increase above the average baseline (before H2O2 stimulation) ratio (n = 15). Right: Images of cells showing representative ROS levels detected by the ratiometric sensor at baseline (t = 0) and at different time points after H2O2 stimulation. Data analysed by two-way ANOVA (a, c, f); and two-tailed t-test (d, e). NS, not significant. All data shown as mean ± s.e.m. For gel source data, see Supplementary Fig. 1.
Extended Data Figure 3. Fat1 suppresses vascular SMC growth by inhibiting the electron transport chain.
a, Population growth of mouse aortic SMCs in the presence of various concentrations of rotenone, a complex I inhibitor. Addition of rotenone at concentrations from 0.1–2 µM did not compromise wild-type cell growth; by contrast, Fat1KO cell growth was suppressed to wild-type levels (n = 3); significance assessed by two-way ANOVA. b, Western blotting for NDUFS3 expression in mouse aortic SMCs treated with control siRNA (sictl) or Ndufs3 siRNA (siNdufs3). c, Proliferation of mouse aortic SMCs after siNdufs3 treatment, expressed as the ratio of EdU to Hoechst signal. RU, relative units. n = 3 for Fat1KO siNdufs3, n = 5 for other groups; significance assessed by one-way ANOVA. NS, not significant. All data shown as mean ± s.e.m. For gel source data, see Supplementary Fig. 1.
Extended Data Figure 4. Loss of Fat1 does not affect overall mitochondrial structure, mass, or dynamics in vascular SMCs.
a, Electron microscopy imaging (original magnification, 5,000×) of mitochondria in mouse aortic SMCs. b–f, Quantification of electron micrographs for the number of mitochondria per cytoplasmic area (b, n = 11); mitochondrial area per cytoplasmic area (c, n = 111 for wild type, n = 119 for Fat1KO); mitochondrial circularity (d, n = 111 for wild type, n = 119 for Fat1KO); mitochondrial crista length (e, n = 34 for wild type, n = 45 for Fat1KO); and crista width (f, n = 34 for wild type, n = 45 for Fat1KO). AU, area units; RU, relative units. g, Expression of representative oxidative phosphorylation proteins from each mitochondrial respiratory complex in total cell lysates of mouse aortic SMCs. h, qRT–PCR analysis of mitochondrial biogenesis and fusion/fission markers, normalized to Rpl13a expression. n = 3. i, Protein expression of biogenesis markers. j, LC3 levels in 3T3-L1 cells and Atg5 knockout cells (positive and negative controls for autophagy, respectively), as well as in wild-type and Fat1KO SMCs. Conversion of LC3 I to LC3 II is indicative of autophagic activity. k, Expression of Mitofusins 1 and 2, regulators of mitochondrial fusion. NS, not significant. All data shown as mean ± s.e.m., significance assessed by two-tailed t-tests. For gel source data, see Supplementary Fig. 1.
Extended Data Figure 5. Mitochondria-targeted Fat1 ICD is sufficient to repress oxygen consumption in vascular SMCs.
a, Electroporation of Fat1–IL-2R in mouse aortic SMCs, followed by subcellular fraction and SDS–PAGE analysis of Fat1 ICD fragments. Green bracket, endogenous Fat1 ICD species; red bracket, Fat1 ICD products from Fat1–IL-2R; blue asterisk, non-specific signal. b, Schematic of mitochondria-targeted Fat1 ICD, Fat1mito. Asterisk, stop codon. c, Top, Detection of Fat1mito in the mitochondrial fraction of Fat1mito -transfected 293T cells. Bottom, Exclusion of Fat1mito from the nuclear fraction of Fat1mito -transfected 293T cells. d, Electroporation of Fat1mito in mouse aortic SMCs, followed by subcellular fraction and SDS–PAGE analysis of Fat1 ICD fragments. Green bracket, endogenous Fat1 ICD species; blue asterisk, non-specific signal. e, f, Quantification of baseline (e) and maximal OCR (f) after introducing Fat1–IL-2R or Fat1mito into Fat1KO cells from Fig. 3a. Data shown as mean ± s.e.m., n = 15, significance assessed by one-way ANOVA. C, cytoplasmic; EV, empty vector; Mit, mitochondrial; Ms, microsomal; −Nuc, non-nuclear fraction; +Nuc, nuclear fraction; WL, whole-cell lysate. For gel source data, see Supplementary Fig. 1.
Extended Data Figure 6. Fat1 ICD associates with mitochondrial respiratory complexes in SMCs, and limits the incorporation of complex I into supercomplexes.
a, Rate of cytochrome C oxidation by immunocaptured complex IV from mouse aortic SMCs lysates, expressed as fold-change from wild type (n = 18). b, Rate of hydrolysis of ATP to ADP and phosphate by immunocaptured complex V from human aortic SMCs treated with control siRNA (sictl) or FAT1 siRNA (siFAT1), expressed as fold change from sictl. n = 4. c, SDS–PAGE analysis of proteins eluted from immunocaptured respiratory complexes after completion of enzymatic assays, followed by immunoblotting for Fat1 and complex II, IV, and V subunits. Red arrowhead, specific Fat1 signal; blue asterisk, non-specific signal. d, Quantification of native complex I (CI) levels from BN–PAGE analyses, including the example presented in Fig. 3e. n = 5. e, Two-dimensional BN/SDS–PAGE analysis of mouse aortic SMC mitochondrial lysates, immunoblotted for Fat1 and complexes I–V. Dashed lines indicate co-migration of Fat1 ICD species with respiratory complexes. Bottom panels are merged images of the individual western blots for complexes I–V (presented in Extended Data Fig. 7). SC, supercomplex. NS, not significant. Data shown as mean ± s.e.m. and analysed by two-tailed t-test (a, b, d). For gel source data, see Supplementary Fig. 1.
Extended Data Figure 7. Two-dimensional BN/SDS–PAGE analysis of SMC mitochondrial lysates, immunoblotted for complexes I–V.
Individual western blots for complexes I–V used to generate the merged images in Extended Data Fig. 6e, bottom panels.
Extended Data Figure 8. FAT1 suppresses proliferation and mitochondrial respiration in human SMCs.
a, Western blotting for FAT1 expression in human aortic SMCs (HASMCs) treated with control siRNA (sictl) or FAT1 siRNAs (siFAT1) 1–3. For subsequent experiments, siFAT1 3 was used unless otherwise indicated. b, Proliferation of HASMCs after siFAT1 treatment, expressed as the ratio of EdU to Hoechst signal, normalized to sictl. n = 3, significance assessed by two-tailed t-test. c, Expression of cyclin D1 in sictl- or siFAT1-treated HASMCs. d, Oxygen consumption rate (OCR) of sictl- or siFAT1-treated HASMCs at baseline and in response to 2 µg ml−1 oligomycin (1), 3 µM FCCP (2), and 2 µM rotenone (3). e, Quantification of OCR from (d). n = 3, significance assessed by two-way ANOVA. All data shown as mean ± s.e.m. For gel source data, see Supplementary Fig. 1.
Extended Data Figure 9. Fat1 expression is induced in SMCs after vascular injury.
a, Immunohistochemistry for Fat1 in control and Fat1SMKO carotid arteries before and after arterial injury, three (d3) or fourteen days (d14) after carotid ligation. L, lumen. The internal elastic lamina has been highlighted with a black line. Scale bar, 25 µm. b, Expression of Fat1 and Acta2 (also known as SMA) by immunofluorescence in control and Fat1SMKO carotid arteries, fourteen days after injury. White squares indicate the regions shown in higher magnification. Yellow line marks the internal and external elastic laminae. Scale bar, 20 µm. c, Nitrotyrosine (NT) staining of control and Fat1SMKO carotid arteries, seven days after injury. White line marks the internal elastic lamina. Scale bar, 50 µm. d, Cells isolated from carotid arteries three days after ligation injury expressing SMC (Acta2, calponin 1, transgelin) or endothelial cell (Pecam1) markers by immunofluorescence.
Extended Data Table 1.
Fat1 interactors identified by TAP–MS that localize to the inner mitochondrial membrane
| Gene | Protein | Function | Published Interactors | Ref.† |
|---|---|---|---|---|
| NDUFS3 | NADH:ubiquinone oxidoreductase core subunit S3 |
Core subunit of CI that belongs to the minimal assembly required for catalysis. |
A number of CI, II, III, and V components |
41,42 |
| PHB | Prohibitin | Associates with and stabilizes respiratory complexes, particularly CI. Important for mitochondrial morphology and function, and growth control. |
PHB2*, AFG3L2*, TIMM50*, ATAD3A*, UQCRC2*, STOML2*, and many respiratory complex subunits |
43,44 45 |
| PHB2 | Prohibitin 2 | See above | See above |
43,44 45 |
| UQCRC2 | Ubiquinol-cytochrome c reductase core protein II |
Core subunit of CIII, required for its assembly. | NUDFS3* (and other CI subunits), ATP5O* (and other CV subunits), ATP5A1*, PHB*, AFG3L2*, ATAD3A*, HSPD1* |
44,46 |
| ATP5F1 | ATP synthase, H+ transporting, mitochondrial F0 complex subunit B1 |
Component of CV. ATP synthesis. | ATP5O*, ATP5A1*, SLC25A3*, STOML2*, HSPD1*, AFG3L2* and many CI, CII, CIII, and CV subunits |
44,46 47 |
| ATP5O | ATP synthase, H+ transporting, mitochondrial F1 complex, O subunit |
See above. | ATP5F1*, ATP5A1*, UQCRC2*, and other respiratory subunits |
44,46 |
| ATP5A1 | ATP synthase, H+ transporting, mitochondrial F1 complex, α subunit 1, cardiac muscle |
See above. | ATP5F1*, ATP5O*, UQCRC2*, AFG3L2*, STOML2*, and other respiratory subunits |
44,46 |
| AFG3L2 | AFG3 like matrix AAA peptidase subunit 2 |
AAA protease involved in IMM proteolysis. Forms a supercomplex with PHB at the IMM. PHB inhibits AFG3L2. |
PHB*, ATP5F1*, ATP5A1*, UQCRC2*, SLC25A3*, TIMMDC1* and many CI subunits |
44,46 48 |
| ATAD3A | ATPase family, AAA domain containing 3A |
Located at contact sites between OMM and IMM. Required for mitochondrial network organization, metabolism, and protein synthesis. Required for nucleoid stability and cell growth. Involved in complex I assembly. |
PHB*, UQCRC2*, SLC25A3*, HSPD1*, and other CI and CV subunits. |
44,46 49,50 51,52 |
| STOML2 | Stomatin like 2 | Formation of cardiolipin-enriched microdomains. Recruits PHB to these microdomains to promote PHB function: assembly and stability of respiratory complexes. Promotes supercomplex formation, oxphos, CI and CII activities, and ATP production. Enhances T-cell proliferation. |
PHB*, ATP5A1*, ATP5F1*, SLC25A3*, and other CIII and CV subunits |
44,46 53,54 |
| TIMMDC1 | Translocase of inner mitochondrial membrane domain containing 1 |
CI assembly: associates with core subunits of CI and components of the CI assembly machinery. Loss of function interrupts CI assembly, supercomplex formation, and mitochondrial respiration. |
AFG3L2*, core subunits of CI, CI assembly factors, CIII and CIV subunits |
48 |
| TIMM50 | Translocase of inner mitochondrial membrane 50 |
Component of the TIM23 complex; mediates the translocation of transit peptide-containing proteins across the IMM. |
PHB*, and some CII subunits | 46,55 |
| ABCE1 | ATP binding cassette subfamily E member 1 |
Inhibitor of RNA suppression. Regulation of mRNA turnover. Interacts with various CI subunits and CI assembly factors. |
48,56 | |
| HSPA9 | Heat shock protein family A (Hsp 70) member 9 |
Associates with cristae organizing system complex (MICOS), and modulates mito morphology. In yeast: binds to IMM to regulate mitochondrial import; optimizes translocation acting as an m-AAA protease to degrade/refold misfolded proteins. Implicated in cell proliferation, aging, cell fate determination, differentiation, tumor development. |
DNAJA1*, DNAJA2*, DNAJA3*, HSPD1*, CI and CII subunits |
44,46 57,58 59,60 |
| NIPSNAP1 | Nipsnap homolog 1 (C. elegans) |
Molecular function unknown. | Fat1*, HSPD1* | 61 |
| SLC25A1 | Solute carrier family 25 member 1 |
Citrate/malate exchange. Important for the bioenergetics of hepatic cells; provides a carbon source for fatty acid and sterol biosynthesis, and NAD+ for the glycolytic pathway. |
62 | |
| SLC25A3 | Solute carrier family 25 member 3 |
Transport of phosphate groups (along with H+) from the cytosol to the mitochondrial matrix. Regulation of the mitochondrial permeability transition pore. |
ATP5F1*, ATAD3A*, AFG3L2*, STOML2*, and many CI, II, III, and V subunits |
44,46 |
| SLC25A10 | Solute carrier family 25 member 10 |
Translocation of malonate, malate and succinate in exchange for phosphate, sulfate, sulfite or thiosulfate across IMM. |
CI subunits | 46 |
| SLC25A11 | Solute carrier family 25 member 11 |
Transport of 2-oxoglutarate across the IMM in exchange for malate or other dicarboxylic acids; important for malate- aspartate shuttle, oxoglutarate/isocitrate shuttle, gluconeogenesis from lactate, and nitrogen metabolism. |
63 | |
| SLC25A13 | Solute carrier family 25 member 13 |
Calcium-dependent exchange of cytoplasmic glutamate with mitochondrial aspartate across the IMM. |
64 | |
| SLC25A22 | Solute carrier family 25 member 22 |
Transport of glutamate (with H+) across the IMM. | CII subunits | 46,65 |
| SLC25A33 | Solute carrier family 25 member 33 |
Induced by IGF1/mTOR pathway. Controls mtDNA replication and transcription. Promotes mitochondrial respiration and cell growth, and protects from ROS-mediated differentiation during mitochondrial dysfunction. |
HSPD1* | 44,66 |
Acknowledgments
We thank R.N. Kitsis for helpful discussions; A. Jenny for critical reading of the manuscript; X.L. Du for technical help with the Seahorse experiments and for scientific advice; G. Perumal at the Einstein Analytical Imaging Facility for help with electron microscopy imaging; and M.A. Gawinowicz at the Columbia Proteomics laboratory for performing the mass spectrometry analysis. This work was supported by funds from the Diabetes Training and Research Center of Albert Einstein College of Medicine (NIH P60DK20541); funds from the Medical Scientist Training Program (NIH T32-GM007288), Cellular, Molecular Biology, and, Genetics Training Grant (NIH T32-GM007491), and an American Medical Association Seed Grant (all to L.L.C.); from the American Heart Association to D.F.R-B. (pre-doctoral award 11PRE5450002) and to N.E.S.S. (Grant-in-Aid 13GRNT16950064); and from the NIH to L.H. (CA205262) and to N.E.S.S. (HL088104 and HL104518).
Footnotes
Supplementary Information is available in the online version of the paper.
Author Contributions L.L.C., D.F.R.-B., P.C., C.M.D., and R.H. generated reagents, performed experiments, and analysed data. B.P.O. performed confocal imaging and analysis of the co-localization studies. V.M. and L.H. imaged and analysed the redox-sensitive ratiometric sensor roGFP. L.G. performed immunohistochemistry on human coronary arteries. M.A.P. and A.F. performed the bioinformatic analysis. L.L.C., D.F.R.-B., and N.E.S.S. designed the study and wrote the paper. L.L.C. and D.F.R.-B. contributed equally to the study. All authors read and approved the final manuscript.
The authors declare no competing financial interests.
References
- 1.Shyh-Chang N, et al. Lin28 enhances tissue repair by reprogramming cellular metabolism. Cell. 2013;155:778–792. doi: 10.1016/j.cell.2013.09.059. [DOI] [PMC free article] [PubMed] [Google Scholar]
- 2.Ahmad T, et al. Miro1 regulates intercellular mitochondrial transport & enhances mesenchymal stem cell rescue efficacy. EMBO J. 2014;33:994–1010. doi: 10.1002/embj.201386030. [DOI] [PMC free article] [PubMed] [Google Scholar]
- 3.Bereiter-Hahn J. Mitochondrial dynamics in aging and disease. Prog. Mol. Biol. Transl. Sci. 2014;127:93–131. doi: 10.1016/B978-0-12-394625-6.00004-0. [DOI] [PubMed] [Google Scholar]
- 4.Yu EP, Bennett MR. Mitochondrial DNA damage and atherosclerosis. Trends Endocrinol. Metab. 2014;25:481–487. doi: 10.1016/j.tem.2014.06.008. [DOI] [PubMed] [Google Scholar]
- 5.Ikeda Y, et al. New insights into the role of mitochondrial dynamics and autophagy during oxidative stress and aging in the heart. Oxid. Med. Cell. Longev. 2014;2014:210934. doi: 10.1155/2014/210934. [DOI] [PMC free article] [PubMed] [Google Scholar]
- 6.Pavlides S, et al. The reverse Warburg effect: aerobic glycolysis in cancer associated fibroblasts and the tumor stroma. Cell Cycle. 2009;8:3984–4001. doi: 10.4161/cc.8.23.10238. [DOI] [PubMed] [Google Scholar]
- 7.Martinez-Outschoorn U, Sotgia F, Lisanti MP. Tumor microenvironment and metabolic synergy in breast cancers: critical importance of mitochondrial fuels and function. Semin. Oncol. 2014;41:195–216. doi: 10.1053/j.seminoncol.2014.03.002. [DOI] [PubMed] [Google Scholar]
- 8.Morris LG, et al. Recurrent somatic mutation of FAT1 in multiple human cancers leads to aberrant Wnt activation. Nat. Genet. 2013;45:253–261. doi: 10.1038/ng.2538. [DOI] [PMC free article] [PubMed] [Google Scholar]
- 9.Nakaya K, et al. Identification of homozygous deletions of tumor suppressor gene FAT in oral cancer using CGH-array. Oncogene. 2007;26:5300–5308. doi: 10.1038/sj.onc.1210330. [DOI] [PubMed] [Google Scholar]
- 10.de Bock CE, et al. The Fat1 cadherin is overexpressed and an independent prognostic factor for survival in paired diagnosis-relapse samples of precursor B-cell acute lymphoblastic leukemia. Leukemia. 2012;26:918–926. doi: 10.1038/leu.2011.319. [DOI] [PubMed] [Google Scholar]
- 11.Gee HY, et al. FAT1 mutations cause a glomerulotubular nephropathy. Nat. Commun. 2016;7:10822. doi: 10.1038/ncomms10822. [DOI] [PMC free article] [PubMed] [Google Scholar]
- 12.Puppo F, et al. Identification of variants in the 4q35 gene FAT1 in patients with a facioscapulohumeral dystrophy-like phenotype. Hum. Mutat. 2015;36:443–453. doi: 10.1002/humu.22760. [DOI] [PubMed] [Google Scholar]
- 13.Cukier HN, et al. Exome sequencing of extended families with autism reveals genes shared across neurodevelopmental and neuropsychiatric disorders. Mol. Autism. 2014;5:1. doi: 10.1186/2040-2392-5-1. [DOI] [PMC free article] [PubMed] [Google Scholar]
- 14.Owens GK, Kumar MS, Wamhoff BR. Molecular regulation of vascular smooth muscle cell differentiation in development and disease. Physiol. Rev. 2004;84:767–801. doi: 10.1152/physrev.00041.2003. [DOI] [PubMed] [Google Scholar]
- 15.Hou R, Liu L, Anees S, Hiroyasu S, Sibinga NE. The Fat1 cadherin integrates vascular smooth muscle cell growth and migration signals. J. Cell Biol. 2006;173:417–429. doi: 10.1083/jcb.200508121. [DOI] [PMC free article] [PubMed] [Google Scholar]
- 16.Miwa S, et al. Low abundance of the matrix arm of complex I in mitochondria predicts longevity in mice. Nat. Commun. 2014;5:3837. doi: 10.1038/ncomms4837. [DOI] [PMC free article] [PubMed] [Google Scholar]
- 17.Brand MD, Nicholls DG. Assessing mitochondrial dysfunction in cells. Biochem. J. 2011;435:297–312. doi: 10.1042/BJ20110162. [DOI] [PMC free article] [PubMed] [Google Scholar]
- 18.Birsoy K, et al. An essential role of the mitochondrial electron transport chain in cell proliferation is to enable aspartate synthesis. Cell. 2015;162:540–551. doi: 10.1016/j.cell.2015.07.016. [DOI] [PMC free article] [PubMed] [Google Scholar]
- 19.Sullivan LB, et al. Supporting aspartate biosynthesis is an essential function of respiration in proliferating cells. Cell. 2015;162:552–563. doi: 10.1016/j.cell.2015.07.017. [DOI] [PMC free article] [PubMed] [Google Scholar]
- 20.Perez J, Hill BG, Benavides GA, Dranka BP, Darley-Usmar VM. Role of cellular bioenergetics in smooth muscle cell proliferation induced by platelet-derived growth factor. Biochem. J. 2010;428:255–267. doi: 10.1042/BJ20100090. [DOI] [PMC free article] [PubMed] [Google Scholar]
- 21.Palikaras K, Tavernarakis N. Mitochondrial homeostasis: the interplay between mitophagy and mitochondrial biogenesis. Exp. Gerontol. 2014;56:182–188. doi: 10.1016/j.exger.2014.01.021. [DOI] [PubMed] [Google Scholar]
- 22.Acin-Perez R, Enriquez JA. The function of the respiratory supercomplexes: the plasticity model. Biochim. Biophys. Acta. 2014;1837:444–450. doi: 10.1016/j.bbabio.2013.12.009. [DOI] [PubMed] [Google Scholar]
- 23.Genova ML, Lenaz G. Functional role of mitochondrial respiratory supercomplexes. Biochim. Biophys. Acta. 2014;1837:427–443. doi: 10.1016/j.bbabio.2013.11.002. [DOI] [PubMed] [Google Scholar]
- 24.Lepore JJ, et al. High-efficiency somatic mutagenesis in smooth muscle cells and cardiac myocytes in SM22α-Cre transgenic mice. Genesis. 2005;41:179–184. doi: 10.1002/gene.20112. [DOI] [PubMed] [Google Scholar]
- 25.Kumar A, Lindner V. Remodeling with neointima formation in the mouse carotid artery after cessation of blood flow. Arterioscler. Thromb. Vasc. Biol. 1997;17:2238–2244. doi: 10.1161/01.atv.17.10.2238. [DOI] [PubMed] [Google Scholar]
- 26.Sadeqzadeh E, et al. Dual processing of FAT1 cadherin protein by human melanoma cells generates distinct protein products. J. Biol. Chem. 2011;286:28181–28191. doi: 10.1074/jbc.M111.234419. [DOI] [PMC free article] [PubMed] [Google Scholar]
- 27.Claros MG, Vincens P. Computational method to predict mitochondrially imported proteins and their targeting sequences. Eur. J. Biochem. 1996;241:779–786. doi: 10.1111/j.1432-1033.1996.00779.x. [DOI] [PubMed] [Google Scholar]
- 28.Sing A, et al. The atypical cadherin fat directly regulates mitochondrial function and metabolic state. Cell. 2014;158:1293–1308. doi: 10.1016/j.cell.2014.07.036. [DOI] [PubMed] [Google Scholar]
- 29.Castillejo-López C, Arias WM, Baumgartner S. The fat-like gene of Drosophila is the true orthologue of vertebrate fat cadherins and is involved in the formation of tubular organs. J. Biol. Chem. 2004;279:24034–24043. doi: 10.1074/jbc.M313878200. [DOI] [PubMed] [Google Scholar]
- 30.Dikshit B, et al. FAT1 acts as an upstream regulator of oncogenic and inflammatory pathways, via PDCD4, in glioma cells. Oncogene. 2013;32:3798–3808. doi: 10.1038/onc.2012.393. [DOI] [PubMed] [Google Scholar]
References
- 31.Jensen LJ, et al. STRING 8—a global view on proteins and their functional interactions in 630 organisms. Nucleic Acids Res. 2009;37:D412–D416. doi: 10.1093/nar/gkn760. [DOI] [PMC free article] [PubMed] [Google Scholar]
- 32.Huang W, Sherman BT, Lempicki RA. Systematic and integrative analysis of large gene lists using DAVID bioinformatics resources. Nat. Protocols. 2009;4:44–57. doi: 10.1038/nprot.2008.211. [DOI] [PubMed] [Google Scholar]
- 33.Merico D, Isserlin R, Stueker O, Emili A, Bader GD. Enrichment map: a network-based method for gene-set enrichment visualization and interpretation. PLoS One. 2010;5:e13984. doi: 10.1371/journal.pone.0013984. [DOI] [PMC free article] [PubMed] [Google Scholar]
- 34.Saito R, et al. A travel guide to Cytoscape plugins. Nat. Methods. 2012;9:1069–1076. doi: 10.1038/nmeth.2212. [DOI] [PMC free article] [PubMed] [Google Scholar]
- 35.Hou R, Sibinga NE. Atrophin proteins interact with the Fat1 cadherin and regulate migration and orientation in vascular smooth muscle cells. J. Biol. Chem. 2009;284:6955–6965. doi: 10.1074/jbc.M809333200. [DOI] [PMC free article] [PubMed] [Google Scholar]
- 36.Riascos-Bernal DF, et al. β-catenin C-terminal signals suppress p53 and are essential for artery formation. Nat. Commun. 2016;7:12389. doi: 10.1038/ncomms12389. [DOI] [PMC free article] [PubMed] [Google Scholar]
- 37.Waypa GB, et al. Hypoxia triggers subcellular compartmental redox signaling in vascular smooth muscle cells. Circ. Res. 2010;106:526–535. doi: 10.1161/CIRCRESAHA.109.206334. [DOI] [PMC free article] [PubMed] [Google Scholar]
- 38.Cox D, et al. Requirements for both Rac1 and Cdc42 in membrane ruffling and phagocytosis in leukocytes. J. Exp. Med. 1997;186:1487–1494. doi: 10.1084/jem.186.9.1487. [DOI] [PMC free article] [PubMed] [Google Scholar]
- 39.Spiering D, Bravo-Cordero JJ, Moshfegh Y, Miskolci V, Hodgson L. Quantitative ratiometric imaging of FRET-biosensors in living cells. Methods Cell Biol. 2013;114:593–609. doi: 10.1016/B978-0-12-407761-4.00025-7. [DOI] [PMC free article] [PubMed] [Google Scholar]
- 40.Charan J, Kantharia ND. How to calculate sample size in animal studies? J. Pharmacol. Pharmacother. 2013;4:303–306. doi: 10.4103/0976-500X.119726. [DOI] [PMC free article] [PubMed] [Google Scholar]
- 41.Procaccio V, et al. Human NDUFS3 gene coding for the 30-kDa subunit of mitochondrial complex I: genomic organization and expression. Mamm. Genome. 2000;11:808–810. doi: 10.1007/s003350010160. [DOI] [PubMed] [Google Scholar]
- 42.Dieteren CE, et al. Subunits of mitochondrial complex I exist as part of matrixand membrane-associated subcomplexes in living cells. J. Biol. Chem. 2008;283:34753–34761. doi: 10.1074/jbc.M807323200. [DOI] [PMC free article] [PubMed] [Google Scholar]
- 43.Nijtmans LG, et al. Prohibitins act as a membrane-bound chaperone for the stabilization of mitochondrial proteins. EMBO J. 2000;19:2444–2451. doi: 10.1093/emboj/19.11.2444. [DOI] [PMC free article] [PubMed] [Google Scholar]
- 44.Wan C, et al. Panorama of ancient metazoan macromolecular complexes. Nature. 2015;525:339–344. doi: 10.1038/nature14877. [DOI] [PMC free article] [PubMed] [Google Scholar]
- 45.Steglich G, Neupert W, Langer T. Prohibitins regulate membrane protein degradation by the m-AAA protease in mitochondria. Mol. Cell. Biol. 1999;19:3435–3442. doi: 10.1128/mcb.19.5.3435. [DOI] [PMC free article] [PubMed] [Google Scholar]
- 46.Havugimana PC, et al. A census of human soluble protein complexes. Cell. 2012;150:1068–1081. doi: 10.1016/j.cell.2012.08.011. [DOI] [PMC free article] [PubMed] [Google Scholar]
- 47.Huttlin EL, et al. The BioPlex network: a systematic exploration of the human interactome. Cell. 2015;162:425–440. doi: 10.1016/j.cell.2015.06.043. [DOI] [PMC free article] [PubMed] [Google Scholar]
- 48.Guarani V, et al. TIMMDC1/C3orf1 functions as a membrane-embedded mitochondrial complex I assembly factor through association with the MCIA complex. Mol. Cell. Biol. 2014;34:847–861. doi: 10.1128/MCB.01551-13. [DOI] [PMC free article] [PubMed] [Google Scholar]
- 49.Gilquin B, et al. The AAA+ ATPase ATAD3A controls mitochondrial dynamics at the interface of the inner and outer membranes. Mol. Cell. Biol. 2010;30:1984–1996. doi: 10.1128/MCB.00007-10. [DOI] [PMC free article] [PubMed] [Google Scholar]
- 50.He J, et al. The AAA+ protein ATAD3 has displacement loop binding properties and is involved in mitochondrial nucleoid organization. J. Cell Biol. 2007;176:141–146. doi: 10.1083/jcb.200609158. [DOI] [PMC free article] [PubMed] [Google Scholar]
- 51.He J, et al. Mitochondrial nucleoid interacting proteins support mitochondrial protein synthesis. Nucleic Acids Res. 2012;40:6109–6121. doi: 10.1093/nar/gks266. [DOI] [PMC free article] [PubMed] [Google Scholar]
- 52.Merle N, et al. ATAD3B is a human embryonic stem cell specific mitochondrial protein, re-expressed in cancer cells, that functions as dominant negative for the ubiquitous ATAD3A. Mitochondrion. 2012;12:441–448. doi: 10.1016/j.mito.2012.05.005. [DOI] [PubMed] [Google Scholar]
- 53.Christie DA, et al. Stomatin-like protein 2 binds cardiolipin and regulates mitochondrial biogenesis and function. Mol. Cell. Biol. 2011;31:3845–3856. doi: 10.1128/MCB.05393-11. [DOI] [PMC free article] [PubMed] [Google Scholar]
- 54.Mitsopoulos P, et al. Stomatin-like protein 2 is required for in vivo mitochondrial respiratory chain supercomplex formation and optimal cell function. Mol. Cell. Biol. 2015;35:1838–1847. doi: 10.1128/MCB.00047-15. [DOI] [PMC free article] [PubMed] [Google Scholar]
- 55.Ewing RM, et al. Large-scale mapping of human protein–protein interactions by mass spectrometry. Mol. Syst. Biol. 2007;3:89. doi: 10.1038/msb4100134. [DOI] [PMC free article] [PubMed] [Google Scholar]
- 56.Karblane K, et al. ABCE1 is a highly conserved RNA silencing suppressor. PLoS One. 2015;10:e0116702. doi: 10.1371/journal.pone.0116702. [DOI] [PMC free article] [PubMed] [Google Scholar]
- 57.Matsuzaki H, Fujimoto T, Tanaka M, Shirasawa S. Tespa1 is a novel component of mitochondria-associated endoplasmic reticulum membranes and affects mitochondrial calcium flux. Biochem. Biophys. Res. Commun. 2013;433:322–326. doi: 10.1016/j.bbrc.2013.02.099. [DOI] [PubMed] [Google Scholar]
- 58.Krimmer T, Rassow J, Kunau WH, Voos W, Pfanner N. Mitochondrial protein import motor: the ATPase domain of matrix Hsp70 is crucial for binding to Tim44, while the peptide binding domain and the carboxy-terminal segment play a stimulatory role. Mol. Cell. Biol. 2000;20:5879–5887. doi: 10.1128/mcb.20.16.5879-5887.2000. [DOI] [PMC free article] [PubMed] [Google Scholar]
- 59.Liu Q, Krzewska J, Liberek K, Craig EA. Mitochondrial Hsp70 Ssc1: role in protein folding. J. Biol. Chem. 2001;276:6112–6118. doi: 10.1074/jbc.M009519200. [DOI] [PubMed] [Google Scholar]
- 60.Kaul SC, Taira K, Pereira-Smith OM, Wadhwa R. Mortalin: present and prospective. Exp. Gerontol. 2002;37:1157–1164. doi: 10.1016/s0531-5565(02)00135-3. [DOI] [PubMed] [Google Scholar]
- 61.Hein MY, et al. A human interactome in three quantitative dimensions organized by stoichiometries and abundances. Cell. 2015;163:712–723. doi: 10.1016/j.cell.2015.09.053. [DOI] [PubMed] [Google Scholar]
- 62.Gnoni GV, Priore P, Geelen MJ, Siculella L. The mitochondrial citrate carrier: metabolic role and regulation of its activity and expression. IUBMB Life. 2009;61:987–994. doi: 10.1002/iub.249. [DOI] [PubMed] [Google Scholar]
- 63.Chen Z, Lash LH. Evidence for mitochondrial uptake of glutathione by dicarboxylate and 2-oxoglutarate carriers. J. Pharmacol. Exp. Ther. 1998;285:608–618. [PubMed] [Google Scholar]
- 64.Palmieri L, et al. Citrin and aralar1 are Ca2+-stimulated aspartate/glutamate transporters in mitochondria. EMBO J. 2001;20:5060–5069. doi: 10.1093/emboj/20.18.5060. [DOI] [PMC free article] [PubMed] [Google Scholar]
- 65.Fiermonte G, et al. Identification of the mitochondrial glutamate transporter. Bacterial expression, reconstitution, functional characterization, and tissue distribution of two human isoforms. J. Biol. Chem. 2002;277:19289–19294. doi: 10.1074/jbc.M201572200. [DOI] [PubMed] [Google Scholar]
- 66.Favre C, Zhdanov A, Leahy M, Papkovsky D, O’Connor R. Mitochondrial pyrimidine nucleotide carrier (PNC1) regulates mitochondrial biogenesis and the invasive phenotype of cancer cells. Oncogene. 2010;29:3964–3976. doi: 10.1038/onc.2010.146. [DOI] [PubMed] [Google Scholar]


