Abstract
Objective:
Diffusivity of pituitary adenoma has not been investigated fully. The purpose of this study was to evaluate the feasibility of turbo field echo with diffusion-sensitized driven-equilibrium (DSDE-TFE) preparation for pituitary adenoma in the sella turcica and unaffected anterior lobe of the pituitary gland.
Methods:
This retrospective study included 23 adult patients with pituitary adenomas. Among them, 6 each were prolactin-producing adenomas and growth hormone-producing adenomas (GH) and the remaining 11 were non-functioning adenomas (NON). The apparent diffusion coefficients (ADCs) were measured in the pituitary adenoma and in the unaffected pituitary gland using coronal reformatted plane.
Results:
All pituitary adenomas were clearly visualized on DSDE-TFE and ADC maps without obvious geometrical distortion. There were no statistically significant differences in ADC of the all pituitary adenoma (1.50 ± 0.61 × 10⁻³ mm2 s−1) and the unaffected anterior lobe of the pituitary gland (1.49 ± 0.37 × 10⁻³ mm2 s−1, p = 0.99). The ADC in prolactin-producing adenomas (2.04 ± 0.76 × 10⁻³ mm2 s−1) was significantly higher than that in GH (1.26 ± 0.47 × 10⁻³ mm2 s−1; p < 0.05) and NON (1.33 ± 0.42 × 10⁻³ mm2 s−1; p = 0.04). There was no statistically significant difference between GH and NON (p = 0.97). The intraclass correlation coefficient for ADC was 0.985 in adenomas and 0.635 in unaffected glands.
Conclusion:
With its insensitivity to field inhomogeneity and high spatial resolution, DSDE-TFE proved a feasible method for evaluating the diffusivity in the pituitary gland and adenoma.
Advances in knowledge:
DSDE-TFE could enable us to assess ADC of pituitary adenoma in the sella turcica with high resolution and few susceptibility artefacts.
INTRODUCTION
Diffusion-weighted (DW) imaging is widely used to diagnose cerebrovascular diseases, intracranial tumours and inflammations.1–10 However, it is hard to evaluate skull base structures with echo planar (EP) imaging, which is the most common imaging technique for DW imaging. Previous studies have revealed the efficacy of DW imaging for skull base tumours such as pituitary adenoma; however, they are mostly limited to large enough macroadenomas to calculate the apparent diffusion coefficient (ADC) using EP sequences.3–7 Therefore, other researchers applied non EP-DW imaging such as single-shot fast spin-echo,8 line-scan9 and periodically rotated overlapping parallel lines with enhanced-reconstruction DW imaging10 for sellar and parasellar lesions to overcome image degradation. Previous reports have shown equivocal data on the relationship between ADC and tumour consistency of macroadenomas. However, no report so far has evaluated both pituitary adenoma and the displaced anterior lobe of the pituitary gland at the same time.
Compared with EP-DW imaging, newly developed three-dimensional (3D) turbo field echo with diffusion sensitized driven equilibrium (DSDE-TFE) preparation has been able to obtain DW images with higher spatial resolution and less susceptibility artefacts.11–13 DSDE-TFE itself has been originally reported as one of the nerve sheath imaging techniques to minimize image distortion with reducing B0 and B1 inhomogeneity and eddy current effects.11,14 Therefore, the purpose of this study was to evaluate the feasibility of this technique for pituitary adenoma in the sella turcica and the unaffected anterior lobe of the pituitary gland.
METHODS AND MATERIALS
This retrospective study was approved by the review boards in Kyushu University Hospital, and written informed consent was waived.
Patients
23 patients (12 males and 11 females, aged from 19 to 82 years; median 63 years) with pituitary adenomas were included. 6 were prolactin-producing tumours (PRL), 6 were growth hormone-producing tumours (GH) and the other 11 were non-functioning tumours (NON). 14 were diagnosed histopathologically and the other 9 were diagnosed clinically based on clinical symptoms, elevated hormone level (PRL and GH) and MRI findings.
Imaging technique
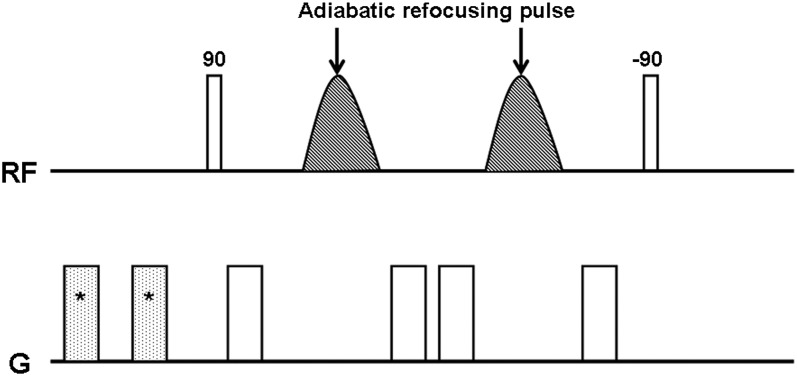
MRI was performed with a 3.0-T system (Achieva® Quasar Dual; Philips, Best, Netherlands) with an eight-channel head coil. Figure 1 shows a diagram of the diffusion-sensitized driven-equilibrium (DSDE) preparation. The DSDE-TFE has two distinct components: first, the DSDE preparation and, second, the segmented 3D turbo field echo (TFE) data acquisition.11 The DSDE preparation is an extension of motion-sensitized driven-equilibrium preparation, which has been used for black-blood imaging.15,16 Motion-sensitized driven-equilibrium preparation has also been applied to brain imaging for detection of metastatic tumours.17 To reduce B0 and B1 inhomogeneity and eddy current effects, adiabatic refocusing pulses and additional gradients were inserted in front of the sequence.11,14 Immediately after DSDE preparation, data acquisition using TFE was performed. We used a phase-cycling scheme to eliminate T1 effects in the acquired signal by TFE.18,19 Imaging parameters for DSDE-TFE were as follows: repetition time (TR)/echo time (TE) = 6.2/3 ms, flip angle = 10°, echo train length = 75, b-factor = 0, 500 s mm−2, sensitivity-encoding factor = 2, field of view (FOV) = 240 mm, voxel size = 1.5 × 1.5 × 1.5 mm3, number of signal averages (NSAs) = 2 and acquisition time = 5 min 22 s. Coronal T1 weighted images without or with contrast material [gadopentetate dimeglumine (Bayer, Osaka, Japan), gadodiamide (Daiichisankyo, Tokyo, Japan) or gadoteridol (Eisai, Tokyo, Japan) at 0.05 mmol kg−1] and T2 weighted images were also obtained. Imaging parameters for pre- and post-contrast T1 weighted images were as follows: TR/TE = 450/13 ms; FOV, 150 mm; matrix, 224 × 180; slice thickness/gap, 3/0.3 mm; voxel size, 0.7 × 0.8 × 3 mm3; NSA, 2; and acquisition time, 2 min 44 s. Imaging parameters for T2 weighted images are as follows: TR/TE, 4000/80 ms; FOV, 150 mm; matrix, 320 × 254; slice thickness/gap, 3/0.3 mm; voxel size, 0.5 × 0.6 × 3 mm3; NSA, 2; and acquisition time, 2 min 48 s.
Figure 1.
Diagram of three-dimensional turbo field echo with diffusion-sensitized driven-equilibrium sequence used in this study. *Pre-pulse gradients for eddy current compensation. RF, radiofrequency.
Analysis
DSDE-TFE data sets were originally imaged with axial planes. They were reformatted to the coronal plane (3-mm thick) and saved as digital imaging and communications in medicine. ADC maps were calculated on a personal computer using ImageJ v. 1.44p (National Institutes of Health, Bethesda, MD) for Windows software (http://rsbweb.nih.gov/ij/). Regions of interest were placed at the intrasellar pituitary adenoma without cysts or haemorrhage on conventional MR images and at the unaffected pituitary gland and adjacent normal-appearing left temporal grey matter by neuroradiologists independently (AH and KY; 16 and 12 years' experience in neuroradiology, respectively). Post-contrast T1 weighted images were used to detect the unaffected anterior lobe of the pituitary gland and pituitary adenoma. All conventional MR images were transferred to picture archiving and communication systems (Rapideye; Toshiba, Ohtawara, Japan). Signal intensity ratios on both the pituitary adenoma and the unaffected pituitary gland compared with grey matter were calculated on T1 weighted images and T2 weighted images in order to compare with ADC. Serum hormone levels were also measured. Tumour volume was calculated on post-contrast T1 weighted images.
Statistical analysis was performed by an author (AH) using statistical software (JMP v. 9.0.2; SAS Institute, Cary, NC, and MedCalc v. 12.2.0.0; MedCalc Software, Mariakerke, Belgium). Paired t-test was used to compare the ADC, T1 weighted images and T2 weighted images of all pituitary adenomas and the unaffected anterior lobes of the pituitary gland. We used Shapiro–Wilk test and Levene test to evaluate Gaussian distribution and variances. Then, we used Tukey–Kramer honestly significant difference test to evaluate these variables with tumour subtypes. p-values <0.05 were considered significant in these assessment. Interrater reliability was measured by using the intraclass correlation coefficient (ICC) with single measures generated by a two-way random-effects model with an absolute agreement definition and is reported as a point estimate with a 95% confidence interval (95% CI).20
RESULTS
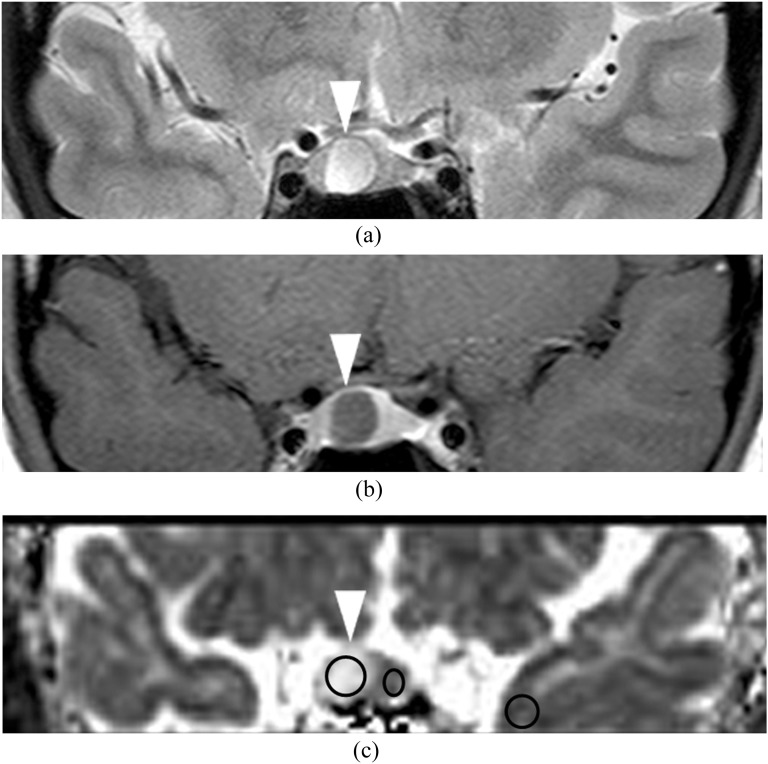
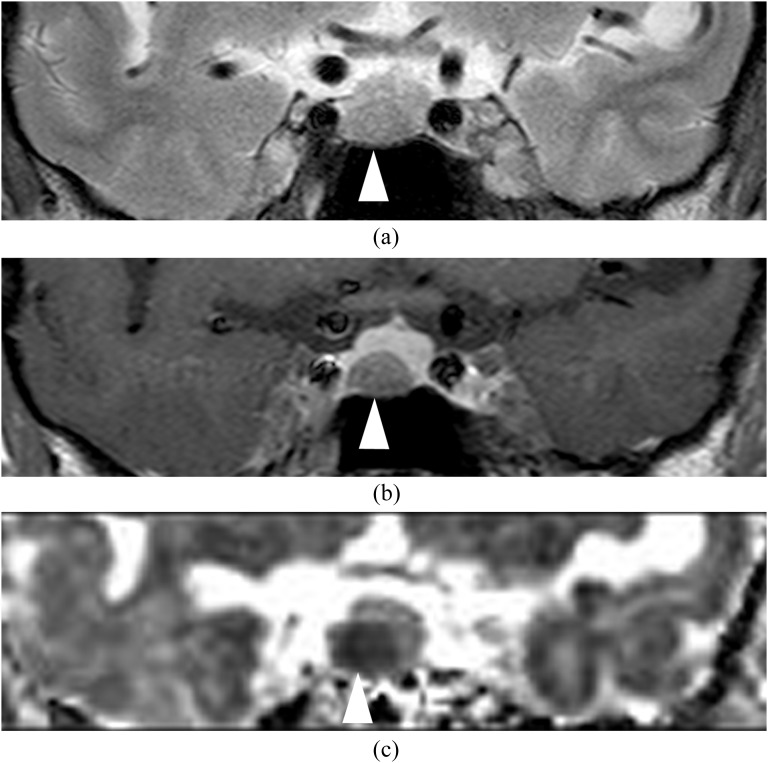
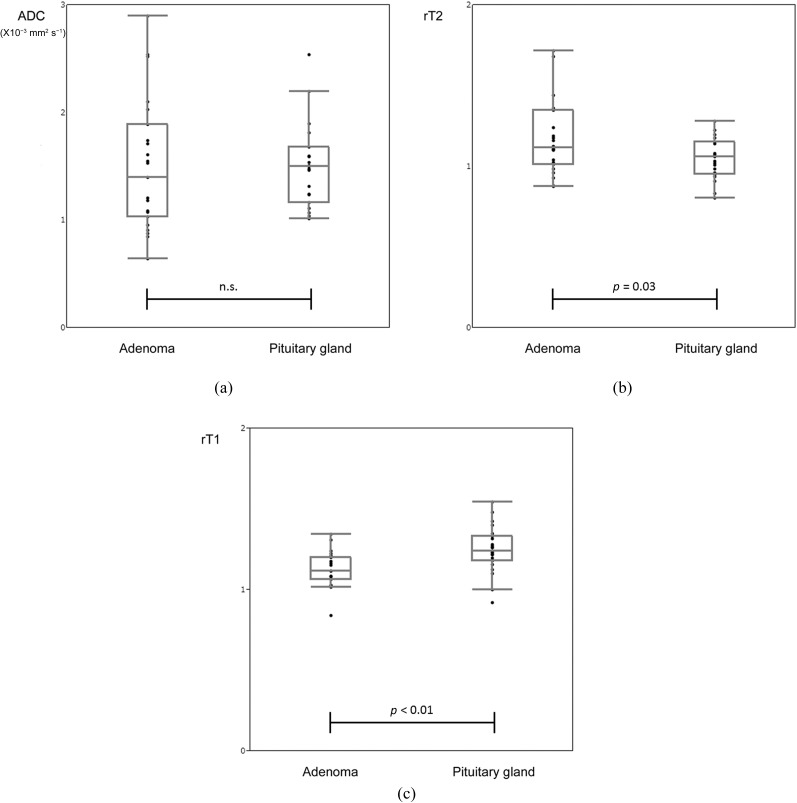
There were 17 macroadenomas and 6 microadenomas. The size of the adenomas ranged from 7.9 to 35.0 mm in maximum diameter (mean ± standard deviation; 15.99 ± 6.95 mm) and from 0.15 to 9.08 cm3 (1.87 ± 2.16 cm3) in volume. In each patient, the unaffected anterior lobe of the pituitary gland and the pituitary adenoma were clearly visualized on DSDE-TFE and ADC maps without obvious geometrical distortion (Figures 2 and 3). There were no statistically significant differences in ADC of all pituitary adenomas (1.50 ± 0.61 × 10⁻³ mm2 s−1; range 0.642–2.90) and the unaffected anterior lobe of the pituitary gland (1.49 ± 0.37 × 10⁻³ mm2 s−1; range 1.01–2.54, p = 0.99; Figure 4a). The T2 weighted images of the pituitary adenoma ranged from 0.88 to 1.72 (1.17 ± 0.23) and was higher than that of the anterior lobe of the unaffected pituitary gland (1.05 ± 0.12; range 0.80–1.28; p = 0.03; Figure 4b). The T1 weighted images of the pituitary adenoma ranged from 0.84 to 1.34 (1.12 ± 0.11) and was significantly lower than that of the unaffected anterior lobe of the pituitary gland (1.25 ± 0.14; range 0.92–1.55; p < 0.01; Figure 4c).
Figure 2.
A 23-year-old female with prolactin-producing microadenoma (0.28 cm3). T2 weighted image (a) shows a hyperintense mass (arrowhead) in the right side of the pituitary fossa. Post-contrast T1 weighted image (b) shows the hypointense mass (arrowhead). Apparent diffusion coefficient map (c) shows hyperintensity in the mass (2.54 × 10⁻³ mm2 s−1; arrowhead). Circles indicate the regions of interest in the adenoma, the unaffected anterior lobe of the pituitary gland and adjacent normal-appearing left temporal grey matter.
Figure 3.
A 63-year-old female with growth hormone-producing microadenoma (0.37 cm3). T2 weighted image (a) shows a hypointense mass (arrowhead) in the right side of the pituitary fossa. Post-contrast T1 weighted image (b) shows a hypointense mass (arrowhead). Apparent diffusion coefficient map (c) shows hypointensity in the mass (0.64 × 10⁻³ mm2 s−1; arrowhead).
Figure 4.
Comparison of pituitary adenoma and the anterior lobe of the pituitary gland. Apparent diffusion coefficient (ADC) derived from turbo field echo with diffusion-sensitized driven-equilibrium (a) shows no difference in the pituitary adenoma (1.50 ± 0.61 × 10⁻³ mm2 s−1) and in the unaffected anterior lobe of the pituitary gland (1.49 ± 0.37 × 10⁻³ mm2 s−1). The T2 weighted images (rT2) (b) of the pituitary adenoma (1.17 ± 0.23) is higher than that of the anterior lobe of the unaffected pituitary gland (1.05 ± 0.12; p = 0.03). The T1 weighted images (rT1) (c) of the pituitary adenoma (1.12 ± 0.11) is lower than that of the unaffected anterior lobe of the pituitary gland (1.25 ± 0.14; p < 0.01). n.s., not significant.
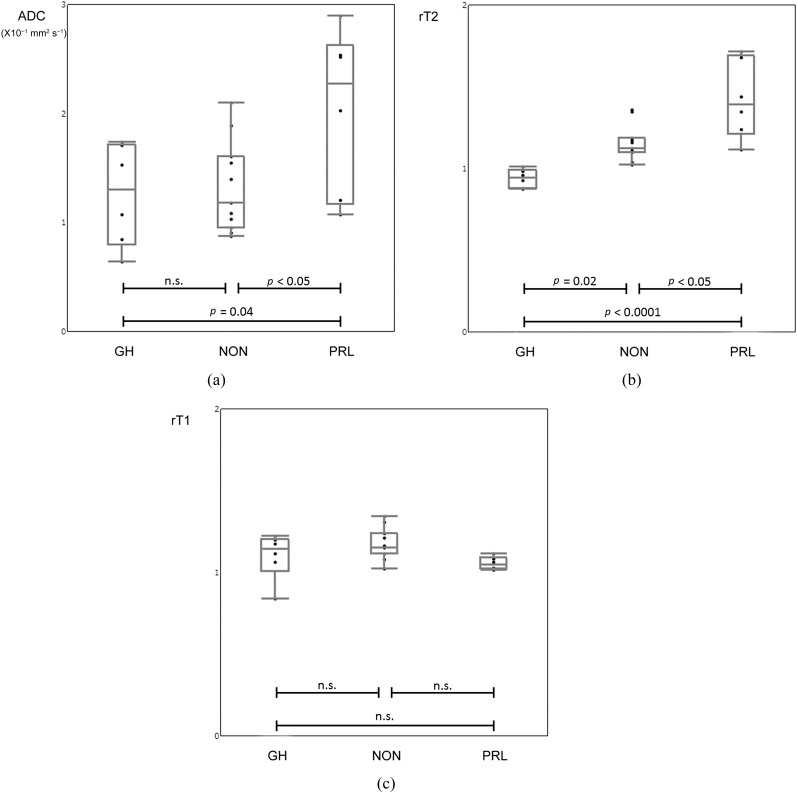
The ADC in PRL (2.04 ± 0.76 × 10⁻³ mm2 s−1) was significantly higher than that in GH (1.26 ± 0.47 × 10⁻³ mm2 s−1; p < 0.05) and NON (1.33 ± 0.42 × 10⁻³ mm2 s−1; p = 0.04). There was no statistically significant difference between GH and NON (p = 0.97; Figure 5a).
Figure 5.
Comparison among tumour subtypes. Apparent diffusion coefficient (ADC) derived from turbo field echo with diffusion-sensitized driven-equilibrium (a) in prolactin-producing tumours (PRL) (2.04 ± 0.76 × 10⁻³ mm2 s−1) is higher than that in growth hormone-producing tumours (GH) (1.26 ± 0.47 × 10⁻³ mm2 s−1; p < 0.05) and non-functioning tumours (NON) (1.33 ± 0.42 × 10⁻³ mm2 s−1; p = 0.04). There is no statistically significant difference between GH and NON (p = 0.97). The T2 weighted images (rT2) (b) in PRL (1.42 ± 0.24) is higher than that in GH (0.94 ± 0.06; p < 0.0001) and NON (1.16 ± 0.11; p < 0.05). The rT2 in NON is also significantly higher than that in GH (p = 0.02). There are no statistically significant differences in T1 weighted images (rT1) (c) among tumour subtypes; NON (1.17 ± 0.09), GH (1.10 ± 0.14) and PRL (1.06 ± 0.04; p > 0.05). n.s., not significant.
The T2 weighted images in PRL (1.42 ± 0.24) was significantly higher than that in GH (0.94 ± 0.06; p < 0.0001) and NON (1.16 ± 0.11; p < 0.05, Figure 5b). The T2 weighted images in NON was also significantly higher than that in GH (p = 0.02, Figure 5b).
There were no statistically significant differences in T1 weighted images among tumour subtypes; NON (1.17 ± 0.09), GH (1.10 ± 0.14) and PRL (1.06 ± 0.04; p > 0.05; Figure 5c).
ICCs as measured by the two readers were 0.985 (95% CI: 0.965 to 0.994) for the ADC, 0.943 (95% CI: 0.871 to 0.975) for T2 weighted images and 0.400 (95% CI: 0.025 to 0.685) for T1 weighted images in the pituitary adenomas. Those in the unaffected anterior lobe of the pituitary glands were 0.635 (95% CI: 0.311 to 0.827) for the ADC, 0.440 (95% CI: 0.070 to 0.8712) for T2 weighted images and 0.549 (95% CI: 0.179 to 0.781) for T1 weighted images.
DISCUSSION
This is the first report to evaluate the diffusivity of pituitary adenomas including microadenomas as well as unaffected anterior lobes of the pituitary gland using DSDE-TFE. DSDE-TFE itself has been originally reported as one of the nerve sheath imaging techniques to minimize image distortion by reducing B0 and B1 inhomogeneity and eddy current effects.11–13 The other advantage of DSDE-TFE is its high spatial resolution (1.5 × 1.5 × 1.5 mm3) and 3D data set. Because of these, we can reformat images in various planes. Previously, Hiwatashi et al12 verified a good correlation in ADC measurement between DSDE-TFE and EP-DW imaging (r = 0.79, p < 0.0001) in normal appearing brain structures. Therefore, we believe this technique is feasible to evaluate structures in and around the pituitary fossae.
In this study, DSDE-TFE could visualize anterior lobes of the pituitary glands and adenomas without distortion of the images in all patients. Because of the susceptibility artefacts with EP-DW imaging, it is hard to evaluate the unaffected pituitary gland. Therefore, previous reports using EP-DW imaging were mainly limited to pituitary macroadenomas, apoplexy or abscess.3–7 Other researchers applied non EP-DW imaging8–10 for sellar and parasellar lesions to overcome image degradation. DSDE-TFE could be added as a new evaluation tool for the pituitary fossa.
In this study, we could not reveal differences in diffusivity between the unaffected anterior lobe of the pituitary glands and pituitary adenomas. However, ADC in PRL (2.04 ± 0.76 × 10⁻³ mm2 s−1) was significantly higher than that in NON (1.33 ± 0.42 × 10⁻³ mm2 s−1; p < 0.05; Figure 5a). Previously, Pierallini et al5 reported that ADC was related to tumour consistency in macroadenoma, indicating that soft tumours showed reduced diffusivity; however, evaluation was not performed in the unaffected pituitary gland. On the contrary, Boxerman et al7 reported that reticulin-poor solid macroadenoma, which is curable in transsphenoid surgery, tended to show increased diffusivity. We have not evaluated tumour consistency in this study. Further study is required; however, diffusivity itself may be influenced by tumour subtypes. Although we could not demonstrate clinical importance of ADC measurement in pituitary adenomas, this technique may be useful to diagnose other diseases such as abscess or hypercellular tumours in and around the pituitary fossa because ADC measurement itself is well known to be useful to evaluate these conditions.4,6 We are continuing to apply this technique clinically.
Signal intensity of pituitary adenoma on conventional sequences is also equivocal. Hagiwara et al21 reported that on T2 weighted MR images, hypointensity was noted more commonly in GH than in those without. Hypointensity was seen especially in densely granulated GH adenomas. They speculated that the amounts of amyloid, fibrous tissue and iron contained in adenomas had little relationship with signal intensity. In our study, T2 weighted images could discriminate between PRL, GH and NON. GH adenoma showing hypointensity compared with PRL adenoma in this study is consistent with the results of Hagiwara et al.21 Other proponents such as Lundin et al22 reported that the signal intensities of PRL and NON adenomas were similar; in general, slightly hypointense on T1 weighted images, isointense on proton density-weighted images and moderately hyperintense on T2 weighed images.
In this study, ICCs as measured by the two readers were 0.985 (95% CI: 0.965. 0.994) and 0.635 (0.311. 0.827) for the ADC in pituitary adenomas and unaffected pituitary gland. With its insensitivity to field inhomogeneity and high spatial resolution, DSDE-TFE visualized both pituitary adenomas and unaffected pituitary gland clearly. However, probably due to the relatively small size of the deviated unaffected pituitary gland, we assumed that its ICC was less than that of the adenoma. The ICCs of ADC of both adenoma and pituitary gland were higher than those of conventional sequences. In addition to the high-spatial resolution of DSDE-TFE, the use of relative value in conventional sequences might have affected this issue.
Limitations of this study include the low b-value and single direction of diffusion weighting. We could obtain DW images with DSDE-TFE at a b-value >500 s mm−2; however, it was sometimes difficult to obtain ADC maps, probably due to insufficient eddy current corrections. Also, we were trying to apply diffusion weighting in more than three directions, for which further technical developments are required. T2 weighted images could better differentiate tumour subtypes than ADC in this study. We will continue to gather patients with pituitary adenomas with different techniques with higher b-values. The small number of patients included is another limitation. We tried to compare imaging findings with hormonal activity; however, it seemed to be in vain because of patients' demographics and wide variation of tumour size. We will continue to gather relevant patient data. The lack of neither control group nor pathological specimen was another limitation. We did not apply our new technique with contrast material for patients without hormonal abnormality nor normal subjects.
In conclusion, with its insensitivity to field inhomogeneity and high spatial resolution, DSDE-TFE proved a feasible method for evaluating the diffusivity in the pituitary gland and adenoma.
CONFLICTS OF INTEREST
Makoto Obara is an employee of Philips Electronics Japan. He was not involved in data analysis in this study.
FUNDING
This work was supported by the Japan Society for the Promotion of Science Grants-in-Aid for Scientific Research grant number 26461826.
Contributor Information
Akio Hiwatashi, Email: hiwatasi@radiol.med.kyushu-u.ac.jp.
Osamu Togao, Email: togao@radiol.med.kyushu-u.ac.jp.
Koji Yamashita, Email: yamakou@radiol.med.kyushu-u.ac.jp.
Kazufumi Kikuchi, Email: kkikuchi@radiol.med.kyushu-u.ac.jp.
Makoto Obara, Email: makoto.obara@philips.com.
Takashi Yoshiura, Email: tyoshiu@radiol.med.kyushu-u.ac.jp.
Hiroshi Honda, Email: honda@radiol.med.kyushu-u.ac.jp.
REFERENCES
- 1.Le Bihan D, Breton E, Lallemand D, Grenier P, Cabanis E, Laval-Jeantet M. MR imaging of intravoxel incoherent motions: application to diffusion and perfusion in neurologic disorders. Radiology 1986; 161: 401–7. doi: 10.1148/radiology.161.2.3763909 [DOI] [PubMed] [Google Scholar]
- 2.Provenzale JM, Sorensen AG. Diffusion-weight MR imaging in acute stroke: theoretic considerations and clinical applications. AJR Am J Roentgenol 1999; 173: 1459–67. doi: 10.2214/ajr.173.6.10584783 [DOI] [PubMed] [Google Scholar]
- 3.Rogg JM, Tung GA, Anderson G, Cortez S. Pituitary apoplexy: early detection with diffusion-weighted MR imaging. AJNR Am J Neuroradiol 2002; 23: 1240–5. [PMC free article] [PubMed] [Google Scholar]
- 4.Yamasaki F, Kurisu K, Satoh K, Arita K, Sugiyama K, Ohtaki M, et al. Apparent diffusion coefficient of human brain tumors at MR imaging. Radiology 2005; 235: 985–91. doi: 10.1148/radiol.2353031338 [DOI] [PubMed] [Google Scholar]
- 5.Pierallini A, Caramia F, Falcone C, Tinelli E, Paonessa A, Ciddio AB, et al. Pituitary macroadenomas: preoperative evaluation of consistency with diffusion-weighted MR imaging—initial experience. Radiology 2006; 239: 223–31. doi: 10.1148/radiol.2383042204 [DOI] [PubMed] [Google Scholar]
- 6.Takao H, Doi I, Watanabe T. Diffusion-weighted magnetic resonance imaging in pituitary abscess. J Comput Assist Tomogr 2006; 30: 514–16. doi: 10.1097/00004728-200605000-00028 [DOI] [PubMed] [Google Scholar]
- 7.Boxerman JL, Rogg JM, Donahue JE, Machan JT, Goldman MA, Doberstein CE. Preoperative MRI evaluation of pituitary macroadenoma: imaging features predictive of successful transsphenoidal surgery. AJR Am J Roentgenol 2010; 195: 720–8. doi: 10.2214/AJR.09.4128 [DOI] [PubMed] [Google Scholar]
- 8.Kunii N, Abe T, Kawamo M, Tanioka D, Izumiyama H, Moritani T. Rathke's cleft cysts: differentiation from other cystic lesions in the pituitary fossa by use of single-shot fast spin-echo diffusion-weighted MR imaging. Acta Neurochir (Wien) 2007; 149: 759–69. doi: 10.1007/s00701-007-1234-x [DOI] [PubMed] [Google Scholar]
- 9.Suzuki C, Maeda M, Hori K, Kozuka Y, Sakuma H, Taki W, et al. Aparent diffusion coefficient of pituitary macroadenoma evaluated with line-scan diffusion-weighted imaging. J Neuroradiol 2007; 34: 228–35. doi: 10.1016/j.neurad.2007.06.007 [DOI] [PubMed] [Google Scholar]
- 10.Mahmoud OM, Tominaga A, Amatya VJ, Ohtaki M, Sugiyama K, Sakoguchi T, et al. Role of PROPELLER diffusion-weighted imaging and apparent diffusion coefficient in the evaluation of pituitary adenomas. Eur J Radiol 2011; 80: 412–17. doi: 10.1016/j.ejrad.2010.05.023 [DOI] [PubMed] [Google Scholar]
- 11.Obara M, Takahara T, Honda M, Kwee T, Imai Y, Van Gauteren M. Diffusion weighted MR nerve sheath imaging (DW-NSI) using diffusion-sensitized driven-equiliblium (DSDE). Proc Intl Soc Mag Reson Med 2011; 19: 4023. [Google Scholar]
- 12.Hiwatashi A, Yoshiuta T, Togao O, Yamashita K, Kikuchi K, Kobayashi K, et al. Evaluation of diffusivity in the anterior lobe of the pituitary gland: 3D turbo field echo with diffusion-sensitized driven-equilibrium preparation. AJNR Am J Neuroradiol 2014; 35: 95–8. doi: 10.3174/ajnr.A3620 [DOI] [PMC free article] [PubMed] [Google Scholar]
- 13.Hiwatashi A, Yoshiura T, Togao O, Yamashita K, Kikuchi K, Fujita Y, et al. Diffusivity of intraorbital lymphoma vs IgG4-related DISEASE: 3D turbo field echo with diffusion-sensitised driven-equilibrium preparation technique. Eur Radiol 2014; 24: 581–6. doi: 10.1007/s00330-013-3058-9 [DOI] [PubMed] [Google Scholar]
- 14.Nezafat R, Stuber M, Ouwerkerk R, Gharib AM, Desai MY, Pettigrew RI. B1-insensitive T2 preparation for improved coronary magnetic resonance angiography at 3 T. Magn Reson Med 2006; 55: 858–64. doi: 10.1002/mrm.20835 [DOI] [PubMed] [Google Scholar]
- 15.Koktzoglou I, Li D. Diffusion-prepared segmented steady-state free precession: application to 3D black-blood cardiovascular magnetic resonance of the thoracic aorta and carotid artery walls. J Cardiovasc Magn Reson 2007; 9: 33–42. doi: 10.1080/10976640600843413 [DOI] [PubMed] [Google Scholar]
- 16.Wang J, Yarnykh VL, Hatsukami T, Chu B, Balu N, Yuan C. Improved suppression of plaque-mimicking artifacts in black-blood carotid atherosclerosis imaging using a multislice motion-sensitized driven-equilibrium (MSDE) turbo Spin-echo (TSE) sequence. Magn Reson Med 2007; 58: 973–81. doi: 10.1002/mrm.21385 [DOI] [PubMed] [Google Scholar]
- 17.Nagao E, Yoshiura T, Hiwatashi A, Obara M, Yamashita K, Kamano H, et al. 3D turbo spin-echo sequence with motion-sensitized driven-equilibrium preparation for detection of brain metastases on 3T MR imaging. AJNR Am J Neuroradiol 2011; 32: 664–70. doi: 10.3174/ajnr.A2343 [DOI] [PMC free article] [PubMed] [Google Scholar]
- 18.Coremans J, Spanoghe M, Budinsky L, Sterckx J, Luypaert R, Eisendrath H, et al. A comparison between different imaging strategies for diffusion measurements with the centric phase-encoded turboFLASH sequence. J Magn Reson 1997; 124: 323–42. doi: 10.1006/jmre.1996.1025 [DOI] [PubMed] [Google Scholar]
- 19.Thomas DL, Pell GS, Lythgoe MF, Gadian DG, Ordidge RJ. A quantitative method for fast diffusion imaging using magnetization-prepared TurboFLASH. Magn Reson Med 1998; 39: 950–60. doi: 10.1002/mrm.1910390613 [DOI] [PubMed] [Google Scholar]
- 20.Shrout PE, Fleiss JL. Intraclass correlations: uses in assessing rater reliability. Psychol Bull 1979; 86: 420–8. doi: 10.1037/0033-2909.86.2.420 [DOI] [PubMed] [Google Scholar]
- 21.Hagiwara A, Inoue Y, Wakasa K, Haba T, Tashiro T, Miyamoto T. Comparison of growth hormone-producing and non-growth hormone-producing pituitary adenomas: imaging characteristics and pathologic correlation. Radiology 2003; 228: 533–8. doi: 10.1148/radiol.2282020695 [DOI] [PubMed] [Google Scholar]
- 22.Lundin P, Nyman R, Burman P, Lundberg PO, Muhr C. MRI of pituitary macroadenomas with reference to hormonal activity. Neuroradiology 1992; 34: 43–51. doi: 10.1007/BF00588432 [DOI] [PubMed] [Google Scholar]


