Abstract
Poly (lactide-co-glycolide) (PLGA) microparticles have significant potential for sustained delivery of plasmid DNA. However, unmodified PLGA microparticles have poor transfection efficiencies. In this study, we use several approaches to enhance the transfection efficiencies of PLGA microparticles in a HepG2 liver cell line. Polyethylenimine is used to condense the plasmid DNA prior to loading into the PLGA microparticles. This provides enhanced loading efficiencies and greater protection to the plasmid DNA (pDNA) during the entrapment process. In addition, the pDNA used (ApoE) incorporates a hybrid liver-specific Murine Albumin enhancer/α-1 antitrypsin promoter (AlbE/hAAT) to enhance transgene expression in human liver (HepG2) cells. The percentage of surfactant used in the preparation of the microparticles, the polymer composition of the PLGA, the ratio of the (polyethylenimine) PEI to pDNA (N/P), the structure of the PEI and the potential utility of a galactose targeting ligand were then investigated to further optimize the efficacy of the cationic microparticle non-viral delivery system in transfecting HepG2 cells. For each PLGA PEI pDNA microparticle formulation prepared, we evaluated particle size, zeta-potential, loading of pDNA, cytotoxicity and transgene expression in HepG2 cells and control human embryonic kidney (HEK293) and Monkey African green kidney fibroblast-like (COS7) cells. Loading PLGA particles with PEI-ApoE pDNA complexes resulted in a significant reduction in particle size when compared to PLGA microparticles loaded with ApoE pDNA alone. Scanning electron microscopy images showed that all the particle formulations were smooth and spherical in appearance. Incorporation of the cationic PEI in the PLGA particles changed the zeta potential from negative to positive. Complexing PEI with ApoE pDNA increased the loading efficiency of the ApoE pDNA into the PLGA microparticles. The cytotoxicity of PLGA particles loaded with PEI-ApoE pDNA complexes was similar to PLGA particles loaded with ApoE pDNA alone. The transfection efficiency of all particle formulations prepared with ApoE pDNA was significantly higher in HepG2 cells when compared to HEK293 and COS7 cell lines. The release of PEI-pDNA complexes from particles prepared with different PLGA polymer compositions including PLGA 50-50, PLGA 75-25 and PLGA 85-15 was sustained in all cases but the release profile was dependent on the polymer composition. Transmission electron microscopy images showed that PEI-pDNA complexes remained structurally intact after release. The optimum formulation for PLGA particles loaded with PEI-ApoE pDNA complexes was prepared using 2% PVA, 50-50 PLGA compositions and N/P ratios of 5 to 10. Strong sustained transgene expression in HepG2 cells was generated by PLGA PEI ApoE pDNA particles up to the full 13 days tested.
Keywords: Polyethylenimine (PEI), liver, targeting ligands, Poly (lactide-co-glycolide) (PLGA), HepG2, PVA, microparticle, polyplexes, complexes, non-viral gene delivery, galactose, formulation, luciferase, plasmid DNA
1. Introduction
Gene therapy has the potential to provide new treatments for a variety of inherited and acquired diseases [1–3]. Liver is an attractive target tissue for gene delivery because of its metabolic capacity and size [4–5]. Liver tissue has a strong vascular network that allows for delivery of target genes to the liver and the distribution of protein production from liver to the systemic circulation [6]. In order to achieve this goal, it requires a delivery system that generates high transfection efficiency without causing cytotoxicity. Viral vectors are widely used for many gene therapies because of their strong transfection efficiency, but they have several drawbacks [7–8]. These include immunogenicity of adenoviruses, packaging constraints of adeno-associated virus (AAV) and the necessity for cell mitosis for most retroviruses. In contrast, non-viral vectors are not immunogenic. Advantages to non-viral vectors include ease of scale-up, storage stability and quality control. Drawbacks to non-viral gene delivery are poor transfection and transient gene expression, necessitating regular administration to increase efficacy. A number of hepatocyte-targeting gene delivery vectors have been reported [4–5, 9–17].
Polymeric gene carriers have been considered important for enhancing stability and improving the transport properties of gene materials. The polymeric drug carriers have been used as a reservoir in which drug molecules can be incorporated by means of chemical, physical or electrostatic interactions, depending on their physicochemical properties. PLGA is biodegradable, biocompatible and has been approved by the Food and Drug Administration for human use in a variety of applications [2, 18–22]. Encapsulation of plasmid DNA (pDNA) in biodegradable polymer potentially offers a way to protect pDNA from degradation. In addition, PLGA particles can facilitate sustained release of drug and pDNA [2–3, 18–19, 23]. Hence, it can mediate longer-term gene expression.
The hybrid liver-specific promoter murine albumin enhancer/α-1 antitrypsin promoter was first cloned by Kramer et al. in 2003 [24]. This liver-specific promoter is a chimeric construction of promoter and enhancer regions of albumin and α-1 antitrypsin. Albumin, an abundant protein in adult serum, is mostly expressed in liver. The human α-1 antitrypsin (hAAT) is one of the predominant proteinase inhibitors in serum and is primarily synthesized in hepatocytes. Previous studies have shown that the inclusion of this hybrid liver-specific promoter (AlbE/hAAT) increased and sustained transgene expression in hepatocytes [25].
PLGA particles loaded with polyethylenimine (PEI)-pDNA complexes is an efficient approach for delivering pDNA to target cells because of increased entrapment efficiencies, protection of pDNA from endonuclease degradation, enhancing transgene expression and low cytotoxicity [26]. In this study, PLGA PEI particles were used to deliver pDNA encoding firefly luciferase gene driven by a hybrid liver-specific promoter (AlbE/hAAT) which is denoted as ApoE pDNA for increased transgene expression in hepatocytes. Different formulation parameters were investigated in order to optimize the preparation of PLGA PEI ApoE pDNA particles. PLGA PEI ApoE pDNA particles were evaluated for physicochemical characteristics including size, morphology, surface charge and ApoE pDNA loading efficiency. The effect of polymer composition on in vitro release of PEI-ApoE pDNA complexes was determined. In addition, the conformational stability of released PEI-ApoE pDNA complexes was examined. In vitro cytotoxicity, transgene expression and sustained transgene expression of PLGA particles loaded with PEI-ApoE pDNA were also evaluated in HepG2, HEK293 and COS-7 cell lines.
2. Materials and methods
2.1 Materials
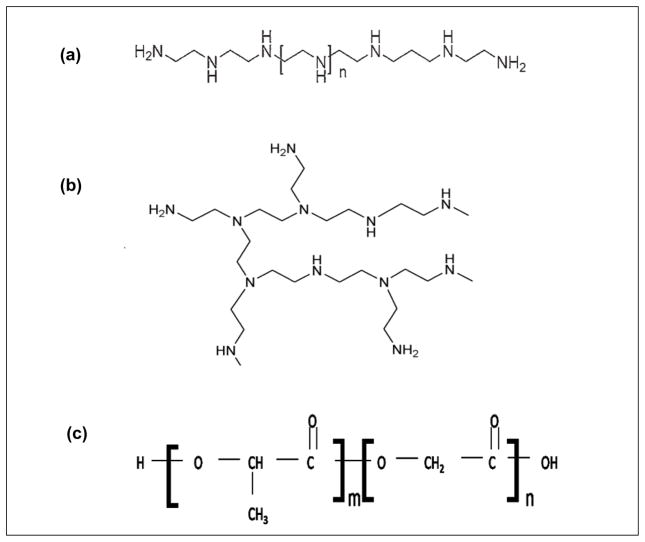
Poly(D,L-lactide-co-glycolide) (PLGA) (Figure 1, molar ratio: 50-50, inherent viscosity: 0.41dL/g; molar ratio: 75-25, inherent viscosity: 0.47dL/g and molar ratio 85-15, inherent viscosity: 0.99 dL/g) were purchased from Absorbable Polymers International (Pelham, AL USA). Branched polyethylenimine (PEI, MW 25 kDa, Figure 1), Polyvinyl alcohol PVA (Mw 30–70 kDa) 88% hydrolysed and dichloromethane were obtained from Aldrich Chemical Company (Milwaukee, WI, USA). The bicinchoninic acid (BCA) protein assay kit was obtained from Pierce Biotechnology Inc. (Rockford, IL). Dulbecco’s Modified Eagle’s Medium (DMEM) was supplied from Gibco BRL (Grand Island, NY). The luciferase assay system was obtained from Promega (Madison, WI). The MTT assay system was purchased from Sigma-Aldrich Chemical Company (Milwaukee, WI, USA).
Figure 1.
Chemical structure of (a) linear polyethylenimine (b) branched polyethylenimine and (c) poly (lactide-co-glycolide).
2.2 Preparation of galactosylated PEI
Galactosylated PEI (GPEI) was prepared as previously described [10]. Briefly, 1 g of branched PEI (25 kDa) and 477 mg of lactose were dissolved in 45 ml of sodium borate buffer (200 mM, pH 8.5). The reaction mixture was incubated at 40°C for 48 hours after the addition of sodium cyanoborohydride at 5 molar excess. The galactosylated PEI was purified by ultrafiltration using Pierce dialysis membrane (MWCO 10,000 Da, Pierce Biotecnology Inc.) and washing with distilled water. Finally, galactosylated PEI was lyophilized (Labconco FreeZone 4.5, Kansas City, MO) and stored at −20°C. The degree of galactose conjugated was determined by the resorcinol test which showed 5% conjugation of galactose to PEI. The ratio of PEI nitrogen to DNA phosphate (N/P) calculation for GPEI was based on a mean Mw of 61 kDa.
2.3 Cell culture
HepG2 human heptocellular carcinoma cells, COS-7 Monkey African green kidney and HEK293 Human embryonic kidney cells were obtained from American Type Culture Collection (ATCC, Rockville, MD). The cells were maintained in DMEM supplemented with 10% fetal bovine serum (FBS), streptomycin at 100 μg/ml, penicillin at 100 U/ml, and 4 mM L-glutamine at 37°C in a humidified 5% CO2-containing atmosphere.
2.4 Amplification and purification of plasmid DNA
ApoE pDNA encoding firefly luciferase driven by the murine albumin enhancer/α1-antitrypsin promoter (AlbE/hAAT) was kindly provided from Dr. Paul McCray (Carver College of Medicine, University of Iowa). The plasmid was transformed in Escherichia coli DH5α and amplified in Terrific Broth media at 37°C overnight on a plate shaker set at 300 rpm. The plasmid was purified by an endotoxin-free QIAGEN Giga plasmid purification kit (QIAGEN, Valencia, CA) according to the manufacturer’s protocol. Purified DNA was dissolved in saline, and its purity and concentration were determined by UV absorbance at 260 and 280 nm using a SpectraMax Plus384 Microplate Spectrophotometer (Molecular Devices, Sunnyvale, CA).
2.5 Preparation of PEI-ApoE pDNA complexes
PEI-ApoE pDNA complexes were prepared in double distilled water by addition of PEI to ApoE pDNA solution at the desired N/P ratio and immediately vortexed for 20 seconds. The solutions were incubated for 30 minutes at room temperature for complex formation. All experiments were repeated at least twice.
2.6 PLGA particles loaded with ApoE pDNA
PLGA particles loaded with ApoE pDNA alone were prepared using a water in oil in water (w/o/w) double emulsion, solvent evaporation technique. One hundred mg of 50-50 PLGA was dissolved in 5 ml of dichloromethane (DCM). ApoE pDNA in 0.5% (w/v) polyvinyl alcohol (PVA) solution was prepared at a concentration of 4 mg/ml. Using a microtip probe sonicator set at level 2 (Sonic Dismembrator Model 100, Fisher Scientific, Pittsburgh, PA), 500 μl of the PVA solution containing 2 mg of ApoE pDNA was mixed with the PLGA/DCM solution for 20 seconds to form the first emulsion. This emulsion was then rapidly added to 50 ml of 0.5% (w/v) PVA solution with stirring at 13,500 rpm for 30 seconds using an IKA Ultra-Turrax T25 basic homogenizer (IKA, Wilmington, NC). The mixture was stirred overnight during which time the DCM solvent was evaporated. The particles were then washed 3 times with deionized water and lyophilized. The supernatant was collected and analyzed spectrophotometrically at 260 nm using a SpectraMax Plus384 Microplate Spectrophotometer for pDNA content. The amount of pDNA loaded in the PLGA particles was calculated by subtracting the pDNA content in the supernatant from the initial concentration of pDNA added. Particles were stored at −20°C until use.
2.7 PLGA particles loaded with PEI-ApoE pDNA complexes
PEI-ApoE pDNA complexes at N/P ratio of 2, 5 or 10 were prepared by mixing 2 mg of ApoE pDNA with 0.52, 1.3 or 2.6 mg of PEI in 500 μl of PVA solution (various concentrations), respectively. The mixture was vortexed for 20 seconds, and incubated for 30 minutes at room temperature. Then 500 μl of PEI-ApoE pDNA complexes solution with N/P ratio of 2, 5 or 10 was mixed with 5 ml of DCM containing 100 mg of PLGA using the microtip probe sonicator set at level 2 for 30 seconds to form the first emulsion. This emulsion was then rapidly added to 50 ml of PVA solution (various concentrations) and homogenized at 13,500 rpm for 30 seconds. The mixture was stirred overnight for evaporation of the DCM solvent. The particles were then washed 3 times with deionized water and lyophilized. Particles were stored at −20°C until use.
2.8 Particle characterization
Microparticle size and zeta potentials were measured using the Zetasizer Nano ZS (Malvern, Southborough, MA). Polystyrene of known particle size was used to calibrate the Zetasizer Nano ZS. Briefly, the particles were suspended in deionized water at a concentration of 1 mg/ml. The size measurements were performed at 25°C at a 173º scattering angle. The mean hydrodynamic diameter was determined by cumulant analysis (Zetasizer Nano ZS). The zeta potential determinations were based on electrophoretic mobility of the PEI-pDNA complexes in deionized water (pH 4.7), which were performed using folded capillary cells (Malvern, Southborough, MA). Particle with known zeta potential was used as the standard to calibrate the Zetasizer Nano ZS.
2.9 Surface morphology analysis
Particle morphology was assessed by scanning electron microscopy (SEM, Hitachi S-4000). Air-dried particles were placed on adhesive carbon tabs mounted on SEM specimen stubs. The specimen stubs were coated with approximately 5 nm of gold by ion beam evaporation before examination in the SEM operated at 5 kV accelerating voltage.
2.10 Plasmid DNA loading estimation
Plasmid DNA loading in PLGA particles was determined by dissolving 200 mg of lyophilized particles in 2 mL of chloroform. The pDNA was extracted in TE buffer (10 mM, pH 8.3). The amount of pDNA was evaluated based on absorbance at 260 nm. Empty PLGA particles in chloroform were spiked with a known amount of pDNA. After the procedure, recovery of the extracted pDNA was found to be complete. Plasmid DNA concentrations in PEI-pDNA complexes were measured at 480 nm/520 nm (Ex/Em) using the PicoGreen reagent (Invitrogen, Carlsbad, CA).
2.11 Transmission electron microscope analysis of PEI-ApoE pDNA complexes
PEI-ApoE pDNA complexes, before encapsulation in PLGA particles and following their release (at day 5) were visualized by transmission electron microscopy (TEM). PEI-ApoE pDNA complexes (20 μL) were adsorbed onto carbon-coated grids for 1 minute and negatively stained for 1 minute with 2% uranyl acetate. After drying, samples were examined with a JEOL JEM-1230 transmission electron microscope.
2.12 In vitro release of PEI-ApoE pDNA complexes from PLGA particles loaded with PEI-ApoE pDNA complexes
PEI-ApoE pDNA complexes release was determined by suspending triplicate samples of 5–10 mg of particles exactly weighted in 1.5 ml of PBS buffer, pH 7.4. The samples were incubated at 37ºC with 100 rpm agitation. The sample triplicates were centrifuged at 5000 rpm for 8 minutes. One ml of supernatant was taken at each time point for complexes analysis and 1 ml of fresh PBS was added into the particle suspension. For quantification of the released PEI-ApoE pDNA complexes, a standard curve of PEI-ApoE pDNA complexes with known concentrations of pDNA was constructed with different concentrations of PEI-ApoE pDNA complexes in PBS (pH 7.4). The pDNA concentrations were determined from the unknown sample by extrapolating from a the standard curve. The pDNA concentration in the sample was quantified spectrophotometrically at 480 nm/520 nm (Ex/Em) using the Picogreen reagent.
2.13 Cytotoxicity evaluation using the MTT assay
Cytotoxicity of the PLGA particles loaded with ApoE alone and PLGA particles loaded with PEI-ApoE pDNA complexes was evaluated using the MTT (3-[4,5-dimethylthiazol-2-yl]-2, 5-diphenyl tetrazolium bromide) assay. PEI-ApoE pDNA complexes alone were used as a control. HepG2, COS-7 and HEK293 cells were seeded in a 96-well plate at a density of 1 × 10⁴ cells/well. Twenty-four hours later, cells were incubated with 200 μl of complete DMEM containing PLGA particles loaded with ApoE alone, PLGA particles loaded with PEI-ApoE pDNA complexes or PEI-ApoE pDNA complexes at various concentrations. After 4 h of incubation, the medium in each well was replaced with 100 μl of fresh complete medium. MTT solution in PBS was added to each well and incubated with cells for an additional 2 h. Cells were lysed with 100 μl of the extraction buffer (20% SDS in 50% DMF, pH 4.7) overnight. The optical density of the lysate was measured at 550 nm using a Spectramax plus384 Microplate Spectrophotometer. Values are expressed as a percentage of the control to which no particles are added.
2.14 Evaluation of luciferase expression in HepG2, COS7 and HEK293 cells
Cells were seeded into a 24-well plate at a density of 1.5 × 10⁵/well of HepG2, 8×10⁴/well of COS-7 and HEK293 cells 24 h before transfection. Plasmid DNA and PLGA PEI pDNA particles (0.2 mg/well) were added to the cells in the transfection medium (serum-free) and incubated for 4 hours at 37 ºC, followed by further incubation in serum containing medium for 44 hours. The concentration of the particles was chosen from an estimated pDNA loading and a target pDNA dose of 1 μg/well. After 44 hours of incubation, cells were treated with 200 μl of lysis buffer (Promega). The lysate was subjected to two cycles of freezing and thawing, then transferred into tubes and centrifuged at 13,200 rpm for 5 minutes. Twenty microliters of supernatant was added to 100 μl of luciferase assay reagent (Promega) and samples were measured on a luminometer for 10 seconds (Lumat LB 9507, EG&G Berthold, Oak Ridge, TN). The relative light units (RLU) were normalized against protein concentration in the cell extracts, measured by a BCA protein assay kit. Luciferase activity was expressed as relative light units (RLU/mg protein in the cell lysate). The data are reported as mean ± standard deviation for triplicate samples. Every transfection experiment was repeated at least twice.
2.15 Measuring sustained in vitro transfection activity
The experiment was performed as described above except the incubation time of particles varied. The cells were incubated with particles for 4 hours, 1, 3, 5, 7 and 11 days. After the pre-determined incubation time, the medium containing particles was removed and washed with PBS. Then completed medium was added to cells which were incubated for another 44 hours for protein expression. Measurement of luciferase activity and protein assay were carried out as described above.
2.16 Statistical analysis
Group data are reported as mean ± SD. Differences between groups were analyzed by one way analysis of variance with a Tukey post-test analysis. Levels of significance were accepted at the P<0.05 level. Statistical analyses were performed using Prism 3.02 software (Graphpad Software, Inc., San Diego, CA.)
3. Results
3.1 Parameters evaluated in preparation and characterization of PLGA PEI ApoE pDNA microparticles
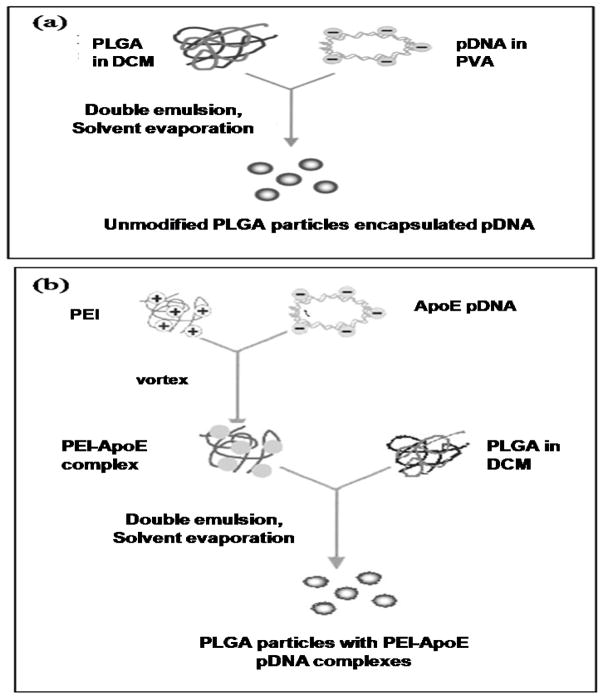
PLGA particles loaded with PEI-ApoE pDNA complexes were prepared by encapsulating PEI-ApoE pDNA complexes into PLGA particles using the double-emulsion solvent-evaporation technique. This method had been selected based on the results of our previous work evaluating and comparing different cationic microparticle formulation methodologies [26]. Figure 2 shows a schematic diagram of the preparation method for PLGA PEI ApoE pDNA particles.
Figure 2.
Schematic of the preparation of (a) PLGA particles loaded with ApoE pDNA and (b) PLGA particles loaded with PEI-ApoE pDNA complexes.
The concentration of surfactant used in the preparation of PLGA pDNA particles can have a significant impact on particle size and the transgene expression generated by biodegradable particles [27]. To characterize the impact of surfactant concentration on transgene expression, five different concentrations of PVA including 0.5%, 1.0%, 1.5%, 2.0% and 5% were used to prepare PLGA particles loaded with PEI-ApoE pDNA complexes (indicated as formulations 1, 2, 3, 4 and 5, respectively, in Table 1).
Table 1.
Formulation parameters for PLGA particles loaded with PEI-ApoE pDNA complexes (formulation 1 to 11) prepared by the double-emulsion solvent-evaporation technique.
| Formulation | PLGA | PEI Structure | PVA(%) | N/P ratio |
|---|---|---|---|---|
| 1 | 50-50 | Branched | 0.5 | 5 |
| 2 | 50-50 | Branched | 1.0 | 5 |
| 3 | 50-50 | Branched | 1.5 | 5 |
| 4 | 50-50 | Branched | 2.0 | 5 |
| 5 | 50-50 | Branched | 5.0 | 5 |
| 6 | 50-50 | Linear | 0.5 | 5 |
| 7 | 50-50 | Galactosylated | 0.5 | 5 |
| 8 | 50-50 | Branched | 0.5 | 5 |
| 9 | 50-50 | Branched | 0.5 | 5 |
| 10 | 75-25 | Branched | 0.5 | 5 |
| 11 | 85-15 | Branched | 0.5 | 5 |
| PLGA | 50-50 | - | 0.5 | 5 |
Correction: Change N/P ratio of Formulation 9 from 5 to 10 and Formulation 8 from 5 to 2 in the table.
Previous studies have shown that the polymer composition can significantly impact the degradation rate of PLGA particles [28]. This can result in different release rates of PEI-ApoE pDNA complexes. Therefore, in this study we hypothesized that using PLGA with different polymer compositions might also result in changes in transgene expression. We compared three different types of PLGA in this study including PLGA 50-50, PLGA 75-25 and PLGA 85-15.
To characterize whether changing the structure of the PEI or conjugating a ligand to PEI that binds specific receptors could modulate transgene expression, three different types of PEI including branched PEI (BPEI), linear PEI (LPEI) and galactosylated PEI (GPEI) were used to complex with ApoE pDNA followed by loading into PLGA particles. GPEI has a galactose group that is known to be one of the most effective binding ligands for hepatocytes. The galactose ligand binds to the asiaglycoproteins receptor (ASGP-R) on the surface on hepatocytes [10]. We hypothesized that the galactose moiety in combination with the hybrid liver-specific promoter could enhance transfection in hepatocytes even further.
A correlation between N/P ratio and transfection efficiency has been explored by several researchers [29–30]. However, the effects of N/P ratio on transfection efficiency after the PEI-pDNA complexes have been loaded into PLGA particles has yet to be determined. Therefore, PLGA particles loaded with PEI-ApoE pDNA complexes at three different N/P ratios were also prepared and evaluated.
3.2 Particle size, zeta potential and surface morphology of PLGA PEI ApoE particles
The presence of PEI within the internal aqueous phase affected particle size, zeta potential and surface morphology of PLGA particles. The mean diameter of all PLGA PEI ApoE pDNA particles significantly decreased upon addition of PEI (p<0.001). The mean particle size was found to dependent on the PVA concentration used in the particle fabrication (p<0.001). Particle sizes of PLGA particles loaded with PEI-ApoE pDNA complexes prepared with 0.5% to 1.5% PVA range from 1000 to 1200 nm (Table 2). Increasing the PVA concentration above 1.5% resulted in a further decrease in particle size which ranged from 650 to 850 nm (Table 2). The mean particle diameter of particles prepared by BPEI and GPEI was similar (900–1000 nm) while that of particles prepared by LPEI was lower (752 nm). Furthermore, increasing the content of PEI in the PLGA particles does not significantly change particle size. This result is consistent with our previous observations of PLGA PEI particle preparations [26].
Table 2.
Physical characterization of the PLGA particles loaded with PEI-ApoE pDNA complexes formulated using different PVA concentrations. The results are the mean of three experiments ± SD.
| Formulation | PVA (%) | PLGA | Mean Particle Size (nm) | Zeta Potential (mV) | pDNA loading (μg pDNA/mg particle) |
|---|---|---|---|---|---|
| 1 | 0.5 | 50-50 | 1067±14 | 3.90±0.01 | 8.28±0.28 |
| 2 | 1.0 | 50-50 | 1037±40 | 3.13±0.03 | 9.50±.25 |
| 3 | 1.5 | 50-50 | 1151±64 | 2.93±0.01 | 9.98±0.14 |
| 4 | 2.0 | 50-50 | 682±10 | 2.64±0.04 | 10.26±0.25 |
| 5 | 5.0 | 50-50 | 812±52 | 2.40±0.01 | 10.54±0.71 |
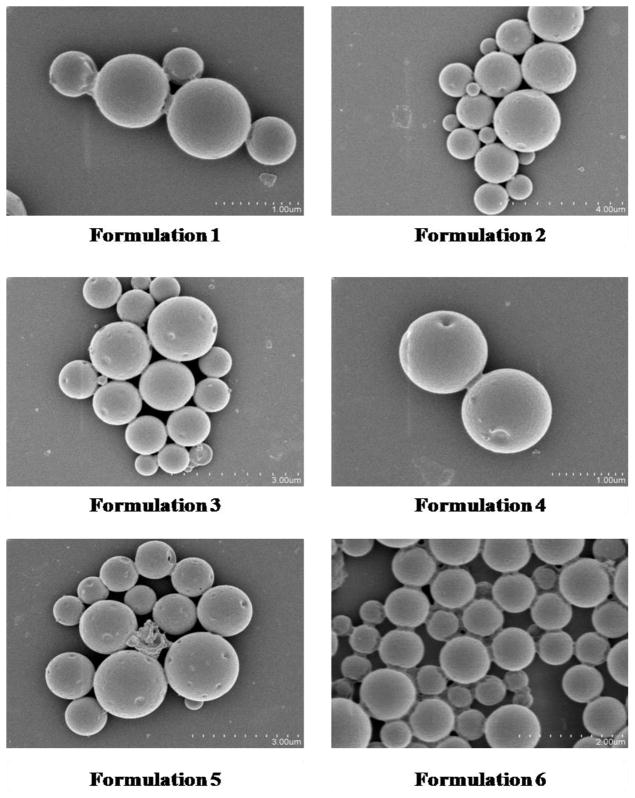
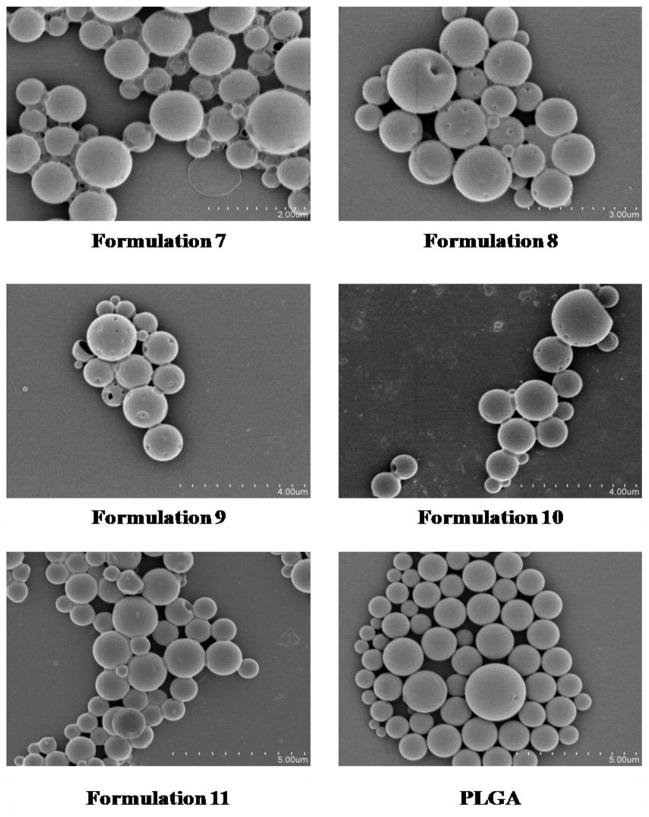
Unmodified PLGA particles loaded ApoE pDNA displayed a net negative surface charge of −26.15 mV. After the introduction of PEI, all formulations except formulation 8 (PLGA particles loaded with PEI-ApoE pDNA complexes at N/P ratio of 2) show a net positive surface charge with values ranging from +2.40 to +9.88 mV. PLGA particles loaded with PEI-ApoE pDNA complexes at N/P ratio of 10 displayed the highest zeta potential among all formulations (Table 2 to Table 5). As shown in Table 2, the zeta potential of PLGA particles loaded with PEI-pDNA complexes decreased from +3.90 to +2.40 mV as the concentration of PVA increased from 0.5% to 5%. There is no significant difference in zeta potential for PLGA PEI ApoE particles prepared with different PLGA polymer compositions (Table 3). In addition, for PLGA PEI ApoE particles prepared with different types of PEI, the surface charge of particles formed with LPEI displayed the highest zeta potential followed by those prepared by BPEI and GPEI, respectively (Table 4). The surface charge of PLGA PEI ApoE particles was more positive in the group prepared with higher N/P ratios (Table 5). Figure 3 displays SEM images of PLGA particles. Scanning electron microscopy was used to study surface morphology of PLGA particles. All PLGA PEI ApoE particles are smooth and spherical in appearance.
Table 5.
Physical characterization of the PLGA particles loaded with PEI-ApoE pDNA complexes formulated using PEI-ApoE pDNA complexes at different N/P ratios. The results are the mean of three experiments ± SD.
| Formulation | PVA (%) | N/P Ratio | Mean Particle Size (nm) | Zeta Potential (mV) | pDNA loading (μg pDNA/mg particle) |
|---|---|---|---|---|---|
| 8 | 0.5 | 2 | 1316±8 | −10.62±0.05 | 7.48±0.08 |
| 1 | 0.5 | 5 | 1067±14 | 3.90±0.01 | 8.28±0.28 |
| 9 | 0.5 | 10 | 1218±13 | 9.88±0.01 | 10.24±0.23 |
Table 3.
Physical characterization of the PLGA particles loaded with PEI-ApoE pDNA complexes formulated using different PLGA polymer compositions. The results are the mean of three experiments ± SD.
| Formulation | PVA (%) | PLGA | Mean Particle Size (nm) | Zeta Potential (mV) | pDNA loading (μg pDNA/mg particle) |
|---|---|---|---|---|---|
| 1 | 0.5 | 50-50 | 1067±14 | 3.90±0.01 | 8.28±0.28 |
| 10 | 0.5 | 75-25 | 1360±27 | 4.15±0.02 | 8.39±0.74 |
| 11 | 0.5 | 85-15 | 1335±81 | 3.91±0.02 | 10.09±0.42 |
Table 4.
Physical characterization of the PLGA particles loaded with PEI-ApoE pDNA complexes formulated using different forms of PEI. The results are the mean of three experiments ± SD.
| Formulation | PVA (%) | PEI | Mean Particle Size (nm) | Zeta Potential (mV) | pDNA loading (μg pDNA/mg particle) |
|---|---|---|---|---|---|
| 1 | 0.5 | BPEI | 1067±14 | 3.90±0.01 | 8.28±0.28 |
| 6 | 0.5 | LPEI | 752±114 | 4.23±0.16 | 10.33±0.38 |
| 7 | 0.5 | GPEI | 909±81 | 3.15±0.04 | 8.76±0.28 |
Figure 3.
Scanning electron micrographs of PLGA particles loaded with PEI-ApoE pDNA complexes (formulation 1 to 11) and PLGA particles loaded with ApoE pDNA.
3.3 Plasmid DNA loading in PLGA particles
The pDNA loading efficiency was determined by dissolved PLGA particles in chloroform and PEI-ApoE pDNA complexes was extracted in TE buffer (10 mM, pH 8.3). Then the amount of PEI-ApoE pDNA was evaluated by UV spectroscopy and the picogreen reagent using standard calibration curves in order to determine the amount of pDNA [3]. In this study, all PLGA particles loaded with PEI-ApoE pDNA complexes displayed significantly higher loading of ApoE pDNA in comparison to unmodified PLGA particles loaded with ApoE pDNA (p<0.001). The loading efficiency of ApoE pDNA in PLGA PEI particles increased from 8.28 to 10.54 μg pDNA/mg particle as the PVA concentration was increased from 0.5% to 5% (Table 2). Amongst the particles prepared with different PLGA polymer compositions, the pDNA loading efficiency of 50-50 PLGA was found to be the lowest (8.28 μg pDNA/mg particles) and there was no significant increase (P>0.05) in the ApoE pDNA loading of 75-25 PLGA (8.39 μg pDNA/mg particles) when compared with 50-50 PLGA. There was a significant increase (P<0.001) in the ApoE pDNA loading of 85-15 PLGA (10.09 μg pDNA/mg particles) in comparison to 50-50 PLGA and 75-25 PLGA. Complex formation of PEI and ApoE with different types of PEI prior to encapsulation into PLGA particles resulted in differences in ApoE pDNA loading efficiency. PLGA PEI pDNA particles prepared from LPEI resulted in the highest pDNA loading (10.33 μg pDNA/mg particles) followed by those prepared from GPEI (8.76 μg pDNA/mg particles) and BPEI (8.28 μg pDNA/mg particles), respectively (Table 4). As shown in Table 5, increasing the N/P ratio of PEI-ApoE pDNA complexes leads to increases in ApoE pDNA loading efficiency. For example, the ApoE pDNA loading efficiency increased from 7.50 to 10.28 μg pDNA/mg particles as the N/P ratio increased from 2 to 10.
3.4 In vitro release of PEI-ApoE pDNA complexes
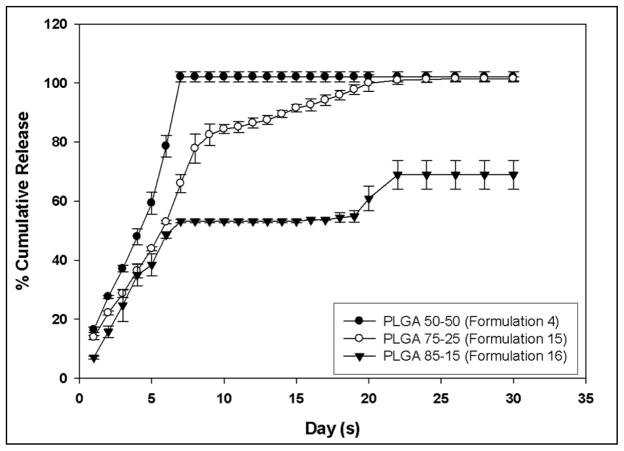
The release profiles of PEI-ApoE pDNA complexes from all the formulations are reported in Figure 4. The experiments measuring release of PEI-ApoE pDNA complexes from PLGA particles were carried out in PBS (pH 7.4) at 37ºC. PLGA particles loaded with PEI-ApoE pDNA complexes prepared from different copolymer compositions; PLGA 50-50, PLGA 75-25 and PLGA 85-15 showed a decrease in PEI-ApoE pDNA complex release rate as the lactide content of the polymer increases. Particles prepared by PLGA 50-50 were characterized by a monophasic profile. The initial burst release corresponded to about 17% of the total PEI-ApoE pDNA complexes loaded. This was followed by a slower phase that lasted approximately 7 days. PLGA particles loaded with PEI-ApoE pDNA complexes prepared from 50-50 PLGA displayed 100% release of total entrapped PEI-ApoE pDNA complexes in 7 days. PLGA particles loaded with PEI-ApoE pDNA complexes prepared from 75-25 PLGA demonstrated a biphasic release profile with an initial burst release of 15% followed by slower controlled release up to 22 days. Total complexes released from PLGA particles prepared from 75-25 PLGA were observed at 22 days. The release of PEI-ApoE pDNA complexes from PLGA particles prepared with 85-15 PLGA was characterized by a triphasic release profile. It started with a small initial burst release of 8% followed by a slower controlled release phase. No release is observed from day 9 to day 18. Beyond day 19, the release rate increases and is followed by a lag phase (no release) up to day 30. PLGA particles prepared from 85-15 PLGA released 70% of the total pDNA-ApoE pDNA complexes in 30 days.
Figure 4.
Cumulative (%) release of PEI-ApoE pDNA complexes from PLGA particles loaded with PEI-ApoE pDNA complexes prepared using PLGA 50-50, PLGA 75-25 and PLGA 85-15. Experiments were carried out in PBS buffer pH 7.4 at 37ºC. Data is presented as means ± SD and are representative of three independent experiments.
3.5 Physical characterization of released PEI-ApoE pDNA complexes
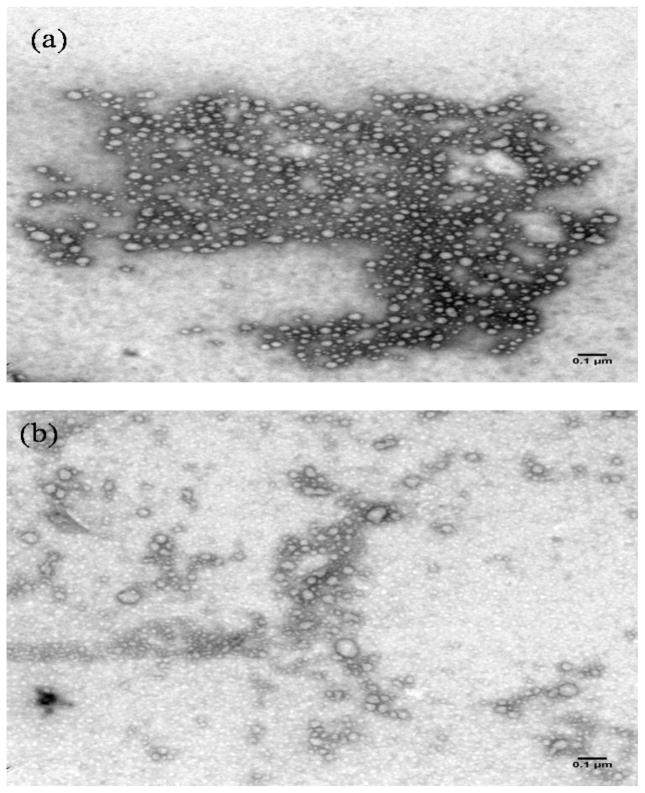
Characteristics of PEI-ApoE pDNA complexes before and after their release from PLGA particles were evaluated by TEM in order to determine whether the formulation process altered the morphology of PEI-ApoE pDNA complexes. PEI-ApoE pDNA complexes released from PLGA particles had a spherical shape, similar to their shape before encapsulation (Figure 5). After encapsulation, some PEI-ApoE pDNA complexes appear to have a less distinct area of uranyl acetate staining, which may be due to more pDNA exposed on the surface of the complexes.
Figure 5.
Transmission electron micrographs (TEM) of PEI-ApoE pDNA complexes (a) before encapsulation in PLGA particles and (b) 5 days after release from PLGA particles. The bar represents 100 nm.
3.6 Effect of PVA concentration on transfection efficiencies of PLGA particles loaded with PEI-ApoE pDNA complexes
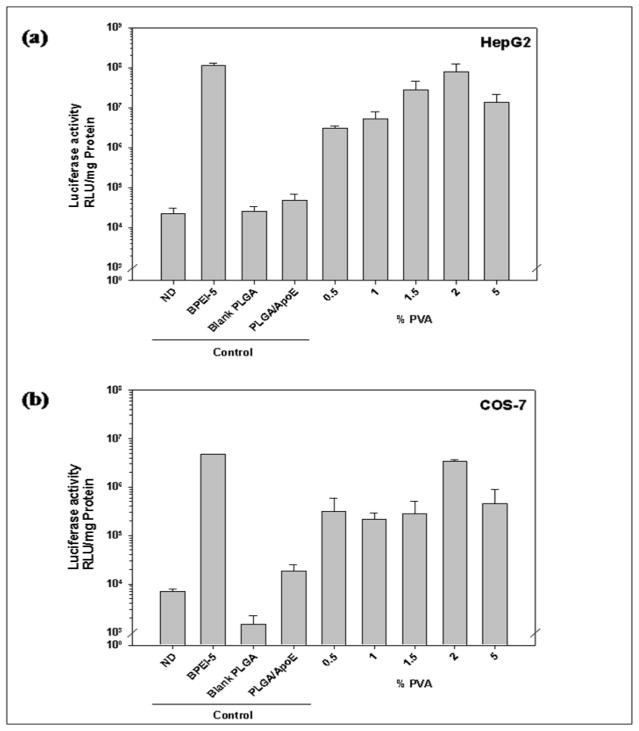
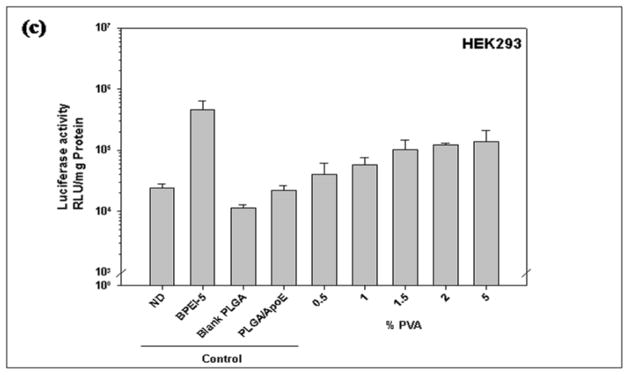
The concentration of PVA used to prepare PLGA particles affects transfection efficiency (Figure 6). As shown in Figure 6a and 6b, particles prepared from 2% PVA showed the highest transfection efficiency in HepG2 and COS-7 cells (7.86×10⁷ and 3.34×10⁷ RLU/mg protein, respectively) with no significant difference in comparison to BPEI-ApoE pDNA complexes at the same N/P ratio (P>0.05). The transfection efficiency was PVA concentration dependent in HEK293 cells. As the PVA concentration used in the PLGA particle preparation increased, the transfection efficiency was enhanced from 4.06×10⁴ to 1.3×10⁵ RLU/mg protein (Figure 6c).
Figure 6.
Luciferase activity of (a) HepG2, (b) HEK293, (c) COS-7 cells that have been treated with unmodified PLGA particles loaded with ApoE pDNA (PLGA/ApoE), PLGA particles loaded with PEI-ApoE pDNA complexes prepared using varying concentrations of PVA solution (0.5%, 1.0%, 1.5%, 2.0% and 5% (w/v)). Transfection was performed by incubating these formulations with cells for 4 hours (reporter gene: ApoE pDNA; pDNA: 1 μg/well). Data is presented as the mean ± standard deviation (n = 3). ND represents naked DNA.
3.7 Effect of PLGA composition on transfection efficiencies of PLGA PEI ApoE particles
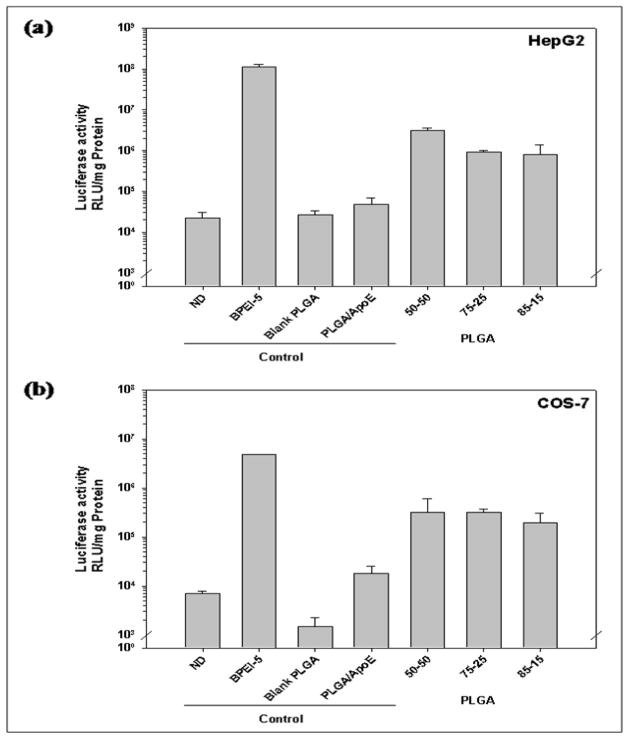
In HepG2 cells, PLGA particles made with 50-50 PLGA displayed the highest transgene expression at 3.11×10⁶ RLU/mg protein in comparison with those made with 75-25 PLGA at 9.12×10⁵ RLU/mg protein and 85-15 PLGA at 7.86×10⁵ RLU/mg protein (Figure 7). In contrast, for transgene expression in COS-7 cells, PLGA particles prepared from 50-50 PLGA showed similar transfection efficiency as PLGA particles prepared from 75-25 PLGA (3.19×10⁵ and 3.12×10⁵ RLU/mg protein for PLGA particles prepared from 50-50 PLGA and 75-25 PLGA, respectively). The transgene expression in COS7 cells was the lowest in the cells treated with PLGA particles prepared from 85-15 PLGA (1.92×10⁵ RLU/mg protein).
Figure 7.
Luciferase activity from (a) HepG2, (b) HEK293, (c) COS-7 cells that have been treated with unmodified PLGA particles loaded with ApoE pDNA (PLGA/ApoE), PLGA particles loaded with PEI-ApoE pDNA complexes prepared with varying polymer compositions of PLGA polymer (PLGA 50-50, PLGA 75-25 and PLGA 85-15). Transfection experiments were performed by incubating these formulations with cells for 4 h (reporter gene: ApoE pDNA; pDNA: 1 μg/well). Data is presented as the mean ± standard deviation (n = 3). ND represents naked DNA.
3.8 Effect of PEI structure and galactose ligand conjugation to PEI on transfection efficiencies generated by PLGA PEI ApoE pDNA particles
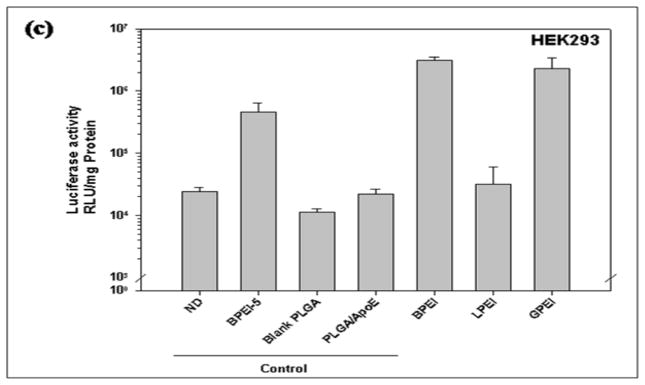
Two forms of PEI were used to complex with ApoE pDNA prior to encapsulation in PLGA particles. As shown in Figure 8, PLGA particles loaded with BPEI and galactosylated branched PEI (GPEI) displayed similar transgene expression profiles in HepG2 cells (3.11×10⁶ and 2.33×10⁶ RLU/mg protein respectively) whilst PLGA particles loaded with linear PEI (LPEI) resulted in the lowest transgene expression (3.16×10⁴ RLU/mg protein). In COS7 cells, LPEI showed the highest transfection efficiency followed by BPEI and GPEI respectively.
Figure 8.
Luciferase activity from (a) HepG2, (b) HEK293, (c) COS-7 cells that have been treated with unmodified PLGA particles loaded with ApoE pDNA (PLGA/ApoE), PLGA particles loaded with PEI-ApoE pDNA complexes prepared with varying types of PEI polymer (branched PEI (BPEI), linear PEI (LPEI) and galactosylated PEI (GPEI)). Transfection experiments were performed by incubating these formulations with cells for 4 h (reporter gene: ApoE pDNA; pDNA: 1 μg/well). Data is presented as the mean ± standard deviation (n = 3). ND represents naked DNA.
3.9 Effect of N/P ratio of PEI to ApoE pDNA on transfection efficiency of PLGA particles loaded with PEI-ApoE pDNA complexes
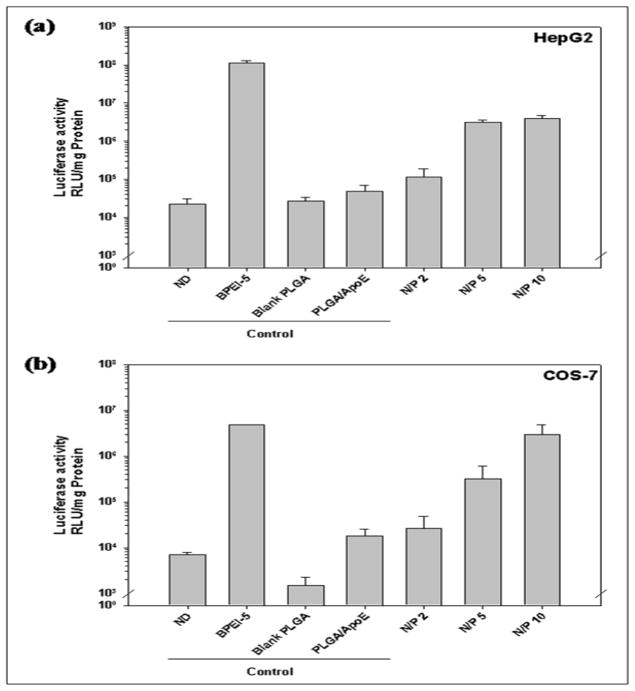
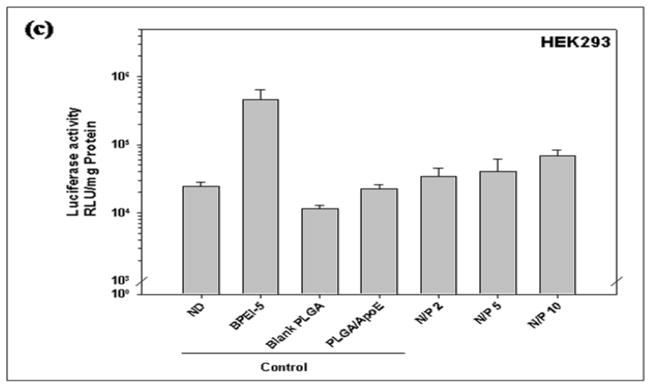
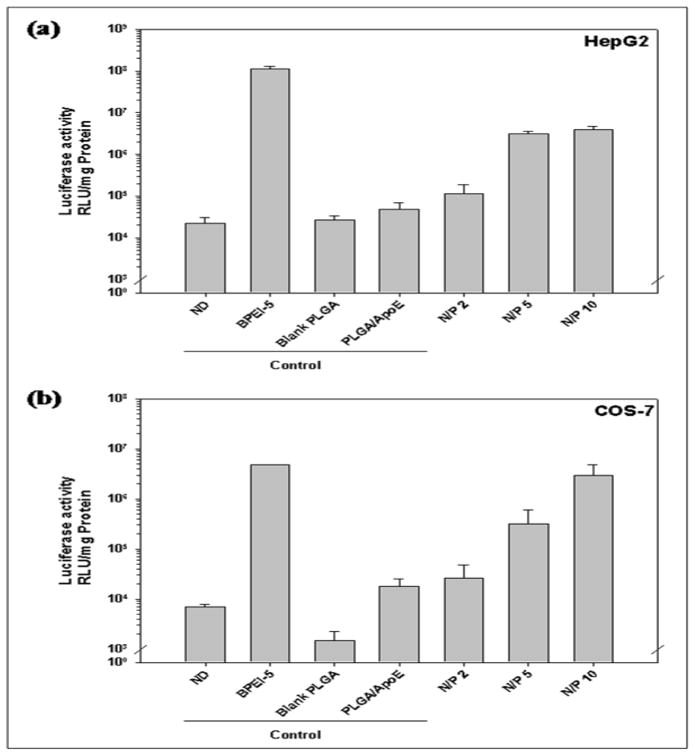
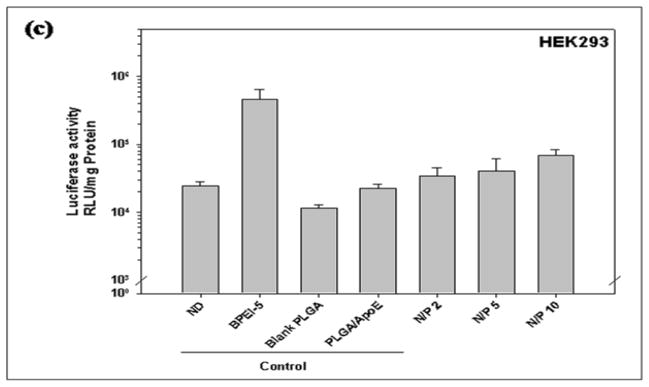
The N/P ratio used for PEI-ApoE pDNA complexes formation prior to encapsulation in PLGA particles also affects the transfection efficiency of PLGA particles in HepG2, COS-7 and HEK293 cells (Figure 9). The transfection efficiency of PLGA particles increases with increasing N/P ratio used for PEI-ApoE pDNA complexes formation prior to encapsulaton in PLGA particles in all cells. PEI-ApoE pDNA complexes made at N/P = 10 yield the highest transgene expression in all cell lines. In HepG2 and HEK293 cells, there is no significant difference between PLGA particles containing PEI-ApoE pDNA complexes prepared at N/P = 5 and N/P = 10 (P>0.05).
Figure 9.
Luciferase activity from (a) HepG2, (b) HEK293, (c) COS-7 cells that have been treated with unmodified PLGA particles loaded with ApoE pDNA (PLGA/ApoE), PLGA particles loaded with PEI-ApoE pDNA complexes prepared with varying N/P ratio of PEI-ApoE pDNA complexes (2, 5 and 10). Transfection experiments were performed by incubating these particles with cells for 4 h (reporter gene: ApoE pDNA; pDNA: 1 μg/well). Data is presented as the mean ± standard deviation (n = 3). ND represents naked DNA.
3.10 PLGA particles loaded with PEI-ApoE pDNA complexes generate sustained transgene expression in HepG2 cells
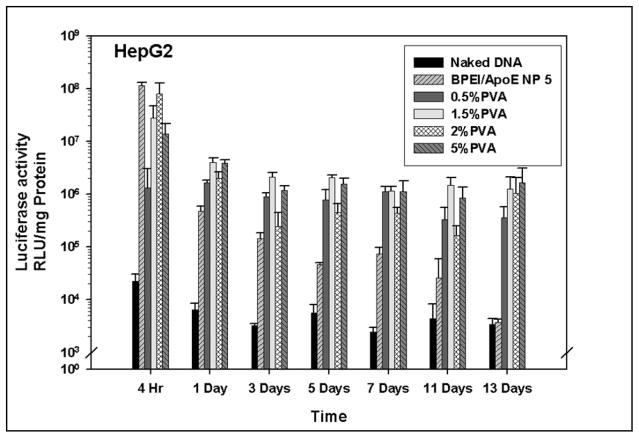
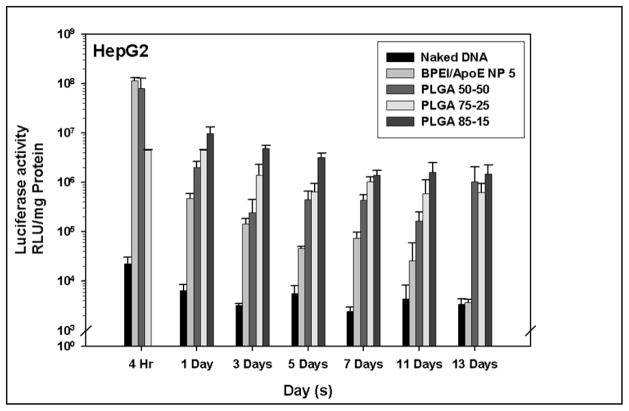
In vitro transgene expression generated from all PLGA particles loaded with PEI-ApoE complexes were evaluated and compared with PEI-ApoE complexes and PLGA particles loaded with ApoE pDNA in HepG2 cells. Two different factors; PVA concentrations and PLGA polymer compositions were also evaluated. All PLGA PEI ApoE particles prepared with different PVA concentrations and different polymer compositions displayed sustained transgene expression in HepG2 cells (Figure 10 and 11). For the first 4 hours, transgene expression was higher in the PEI group than that of all groups with PLGA particles loaded with PEI-ApoE complexes. The transgene expression in the cationic PLGA particle groups was maintained for 13 days, whereas the transgene expression resulting from BPEI-ApoE pDNA complexes significantly decreased after day 1 (P<0.01). The transgene expression generated by cationic PLGA particles groups was 449 and 390 fold higher than that of the BPEI-ApoE pDNA complexes at day 13 for particles prepared with 5% PVA and PLGA 85-15, respectively.
Figure 10.
Luciferase activity from HepG2 cells that have been treated with naked ApoE pDNA, BPEI-ApoE pDNA complexes at N/P ratio 5 and PLGA particles loaded with PEI-ApoE pDNA complexes prepared with varying concentrations of PVA solution (0.5%, 1.5%, 2.0% and 5% (w/v)). Transfection was performed by incubating these particles with cells for 4 hours, 1 day, 3 days, 5 days, 7 days, 11 days and 13 days (reporter gene: ApoE pDNA; pDNA: 1 μg/well). Data is presented as the mean ± standard deviation (n = 3).
Figure 11.
Luciferase activity of HepG2 cells that have been treated with naked ApoE pDNA, BPEI-ApoE pDNA complexes at N/P ratio 5 and PLGA particles loaded with PEI-ApoE pDNA complexes prepared with varying polymer compositions of PLGA polymer (PLGA 50-50, PLGA 75-25 and PLGA 85-15). Transfection was performed by incubating these particles with cells for 4 hours, 1 day, 3 days, 5 days, 7 days, 11 days and 13 days (reporter gene: ApoE pDNA; pDNA: 1 μg/well). Data is presented as the mean ± standard deviation (n = 3).
3.11 Evaluation of cytotoxicity of PLGA PEI ApoE microparticles
Cytotoxicity is a major hurdle for use of polycationic gene delivery systems. In vitro cytotoxicity was evaluated in HepG2, HEK293 and COS7 cells with increasing doses of PLGA particles loaded with PEI-ApoE pDNA complexes (from 7.8 to 1000 μg of particles per milliliter of DMEM). BPEI 25 kDa, LPEI 25 kDa and GPEI 25 kDa were used as a control. The LD50 value which represents 50% cell viability is reported. For BPEI 25 kDa, the LD50 value of HepG2 cells was reached at 150 μg/ml of the polymer concentration (Table 6). The LD50 value of HepG2 cells treated with GPEI was 170 μg/ml of the polymer concentration. PLGA particles loaded with PEI-ApoE pDNA complexes showed similar cytotoxicity profile in HepG2 cells in comparison with unmodified PLGA particles with LD50 value greater than 1000 μg/ml of the polymer concentration. The LD50 value of BPEI, LPEI and GPEI was 150, 170 and 27 μg particles/ml of the DMEM medium, respectively (Table 7). As shown in table 6 and 7, the cytotoxicity of all PLGA PEI ApoE particles was significantly lower than that of BPEI, LPEI and GPEI. The LD50 value of PLGA particles loaded with PEI-ApoE pDNA complexes was similar to unmodified PLGA particles with values greater than 1000 μg particles/ml of the DMEM medium. In addition, the concentration dependent effect on the cell viability was observed in all the cell lines (data not shown).
Table 6.
Cytotoxicity of PEI-ApoE pDNA complexes in free form or loaded in PLGA particles and PLGA particles loaded with ApoE pDNA in HepG2 cell lines. The results are reported as 50% of cell viability (LD50). The results are the mean of three experiments ± SD.
| Sample | LD50 (μg particles/ml of DMEM medium) |
|---|---|
| Branched PEI | 150±19 |
| Linear PEI | >1000 |
| GPEI | 170±15 |
| PLGA | >1000 |
| Formulation 1 | >1000 |
| Formulation 2 | >1000 |
| Formulation 3 | >1000 |
| Formulation 4 | >1000 |
| Formulation 5 | >1000 |
| Formulation 6 | >1000 |
| Formulation 7 | >1000 |
| Formulation 8 | >1000 |
| Formulation 9 | >1000 |
| Formulation 10 | >1000 |
| Formulation 11 | >1000 |
Table 7.
Cytotoxicity of PEI-ApoE pDNA complexes in free form or loaded in PLGA particles and PLGA particles loaded with ApoE pDNA in HEK293 cell lines. The results are reported as 50% of cell viability (LD50). The results are the mean of three experiments ± SD.
| Sample | LD50 (μg particles/ml of DMEM medium) |
|---|---|
| Branched PEI | 100±17 |
| Linear PEI | 170±21 |
| GPEI | 80±8 |
| PLGA | >1000 |
| Formulation 1 | >1000 |
| Formulation 2 | >1000 |
| Formulation 3 | >1000 |
| Formulation 4 | >1000 |
| Formulation 5 | >1000 |
| Formulation 6 | >1000 |
| Formulation 7 | >1000 |
| Formulation 8 | >1000 |
| Formulation 9 | >1000 |
| Formulation 10 | >1000 |
| Formulation 11 | >1000 |
4. Discussion
Gene delivery to liver cells is of interest for systemic delivery of transgene products and for the treatment of liver diseases. There are many barriers to efficient delivery of pDNA to the hepatocytes. An important step in the advancement of gene therapy is the development of an efficient, targeted gene delivery system. This delivery system should provide pDNA stability, protection from nuclease and endosomal degradation, intracellular protection from endosomal degradation, release of pDNA from gene carrier and uptake into the liver cells. Moreover, the safety of the delivery system is major concern. In addition, long-term expression of the transgene is desirable. In this study, we complex ApoE pDNA encoding firefly luciferase driven by a hybrid liver specific promoter (AlbE/hAAT) to a cationic polymer, PEI, and load the complexes into biodegradable PLGA particles. PEI complexes with pDNA by electrostatic interactions with positively charged amine groups in PEI and negatively charged phosphate groups in pDNA. The N/P ratio is charge balance between positively charged amine groups in PEI and negatively charged phosphate groups in pDNA [31]. In all PEI-ApoE complexes, increasing the N/P ratio resulted in particle size reduction. The decrease in particle size may be explained by (i) condensation of PEI and pDNA and (ii) repulsion force of charged particles that prevent particles from aggregation. The condensation property of PEI is a very important factor in its use in non-viral gene delivery [32].
Particle size is one of the critical factors in determining the transfection efficiency of non-viral gene vectors. Complex formation between PEI and pDNA before encapsulation into the PLGA particles leads to a decrease in the mean particle size of PLGA particles [3, 26]. In this study, the mean particle size of PLGA PEI particles was found to be dependent on the PVA concentrations used in the particle formation. Higher PVA concentrations resulted in the formation of smaller PLGA particles. Significant increases in the net shear stress can be induced by increases in PVA concentration. As the concentration of PVA increases, more PVA can be oriented at the water and organic solvent interface to reduce the interfacial tension [33]. In addition, PLGA particles prepared with PLGA 50-50 had lower mean particle sizes than particles prepared with PLGA 75-25 and PLGA 85-15. An increase in the lactide composition of PLGA led to an increase in the mean particle size of PLGA PEI ApoE particles.
The surface charge of the non-viral delivery system is expected to influence its interactions with various biological components as well as its cellular interaction and cellular uptake. PLGA particles loaded with ApoE pDNA had a net negative zeta potential. After the introduction of PEI, the zeta potential of all formulation turned positive except formulation 8 (PLGA 50:50, BPEI, 0.5% PVA and N/P 2). Increasing the concentration of PVA used in PLGA particles formation resulted in a decrease in the positive surface charge of PLGA particles. This may be explained by PVA surfactant residue left on the surface of PLGA particles. After the removal of the organic solvent, PVA residues can physically adsorb onto the surface of particles [34]. All of the PLGA particles loaded with PEI-ApoE pDNA had smooth surfaces and spherical shape.
Plasmid DNA complexation with PEI significantly enhanced the loading of pDNA from 3.52 μg pDNA/mg particles to 10.54 μg pDNA/mg particles. This is consistent with ours and other previous studies on the use of cationic excipients to increase loading efficiency of pDNA in PLGA particles [2]. Other factors that can also affect the loading of macromolecules include drug/polymer interactions and emulsion stability. For example, one study showed that the interaction of gene materials such as oligonucleotides with PEI and PLGA occurs at the interface and lead to a decrease in concentration of gene materials in the aqueous phase [35]. This can be used to increase loading in the PLGA PEI ApoE particle delivery system. The pDNA loading efficiency of PLGA particles prepared from PLGA 50-50 was found to be the lowest. There was no significant increase (P>0.05) in the pDNA loading efficiency of PLGA particles prepared from PLGA 75-25 in comparison with PLGA particles prepared from PLGA 50-50. However, there was a significant increase (P<0.05) in the pDNA loading efficiency of PLGA particles prepared from PLGA 85-15 in comparison with PLGA particles prepared from PLGA 50-50. This can be attributed to the fact that as lactide content of PLGA copolymer increases (from PLGA 50-50 to PLGA 85-15), the hydrophobicity of the copolymer also increases because of the hydrophobic nature of the lactide content in the copolymer.
In general, the release of drugs from PLGA particles can be described by two mechanisms. In the first, the drugs can diffuse through channels formed during particle fabrication. Secondly, the release of the drugs is dependent on polymer degradation. Therefore, the degradation rate plays an important role in drug release. In vitro release of PEI-ApoE complexes from PLGA particles using three different PLGA polymers including PLGA 50-50, PLGA 75-25 and PLGA 85-15 were studied. One hundred percent release of PEI-pDNA complexes from PLGA particles prepared from PLGA 50-50 was reached within 6 days. In contrast, PLGA particles made by PLGA 85-15 resulted in complexes release beyond 30 days. PEI-pDNA complexes released from PLGA particles prepare from PLGA 85-15 reached 70% cumulative release at day 30. PLGA particles made by PLGA 75-25 showed a biphasic release profile. A small burst release was observed from all PLGA batches. This phase was attributed to the complexes on or close to the particle surface. The different amounts of complexes released in the initial phase could be from (i) different amounts of complexes adsorbed onto the wall of particles that lead to immediate release causing burst effect and (ii) different sizes of channels on the surface of PLGA particles. After the initial phase, the sustained release of complexes from PLGA particles could result from diffusion through PLGA channels as well as the erosion of PLGA polymer. Hence, the degradation rate of PLGA 50-50 is fastest followed by PLGA 75-25 and PLGA 85-15, respectively. In our study, the release of complexes from PLGA particle reaches 100% within 6 days and 21 days for PLGA 50-50 and PLGA 75-25, respectively. The increase in the release rate from the particles could also result from increases in water uptake by the PEI moiety which leads to increases in hydrolysis of the PLGA particles.
It has been reported that PLGA particle preparation using the double-emulsion solvent-evaporation method can cause pDNA damage during the fabrication process. Shear force generated by ultrasonication and homogenization can cause nicking of naked pDNA [2, 36]. In our study, PEI-ApoE pDNA complexes that release from PLGA particles maintained their physical characteristics including size and morphology. This result suggests that the double-emulsion solvent-evaporation technique does not damage PEI-ApoE pDNA complexes appreciably. This may be explained by the protection effect of PEI. For example, Chumakova et al. have reported that by forming complexes of pDNA with PEI, the polymer can protect pDNA from ultrasound-induced damage [37]. In comparison with freshly prepared complexes on the TEM micrograph, the negative stain of released complexes was less discrete (Figure 5). This difference may be explained by the partial dissociation of PEI-ApoE complexes over time.
Transgene expression mediated by PLGA PEI ApoE particles were evaluated in 3 different cell lines including HepG2, COS-7 and HEK293 (Figure 6 to 9). ApoE pDNA is driven by the Murine Albumin enhancer/α1-antitrypsin promoter (AlbE/hAAT) which is specific liver promoter. In all formulations, the transfection efficiency of PLGA PEI ApoE particles was highest in HepG2 cells. This system is therefore attractive for hepatocyte specific gene delivery. All PLGA particles loaded with PEI-ApoE pDNA complexes showed significantly higher transfection efficiencies than unmodified PLGA particles loaded with ApoE pDNA (P<0.05). PLGA particles loaded with PEI-pDNA complexes were prepared with solution of PVA concentrations of 0.5%, 1.0%, 1.5%, 2.0% and 5.0% (w/v). The optimal transfection efficiency was observed in all cell lines transfected with particles prepared with 2.0% (w/v) PVA solution. The transgene expression of PLGA particles loaded with BPEI-ApoE pDNA complexes showed no significant difference in comparison to PLGA particles loaded with GPEI-ApoE pDNA complexes. Therefore, in this study, the use of a galactose ligand in combination with a hybrid liver promoter (AlbE/hAAT) did not show any additive enhancement in transgene expression generated in HepG2 cells.
In this study, the cells transfected with PLGA particles loaded with PEI-ApoE pDNA complexes demonstrated significant and sustained luciferase expression (Figure 10 and 11). The slow intracellular release of the entrapped PEI-ApoE complexes from PLGA particles is hypothesized to be a convincing explanation for this observation. Sustained delivery of PEI-ApoE complexes in the extracellular matrix of target tissue should prolong the duration of ApoE pDNA expression due to a continuous PEI-ApoE pDNA complexes uptake by the target cells. In addition, this study also shows that released complexes maintain their biological activity.
PEI has been shown to significantly promote pDNA transfection efficiency but also has high cytoxicity. Higher molecular weight PEI showed higher cytotoxicity [38]. Cell viability of all PLGA particles loaded with PEI-ApoE pDNA complexes formulations was evaluated and compared to BPEI-ApoE pDNA complexes. PLGA particles loaded with PEI-ApoE pDNA complexes show similar cytotoxicity as the unmodified PLGA particles in HEK293, COS-7 and HepG2 cells. PLGA particles loaded with PEI-ApoE pDNA complexes displayed significantly lower cytotoxicity than BPEI-ApoE pDNA, LPEI-ApoE pDNA and GPEI-ApoE pDNA complexes in vitro (P<0.001) (Table 6). For BPEI, concentrations above 150 μg/ml medium resulted in lower than 50% cell viability in HepG2 and COS-7 cells. In comparison, for PLGA particles and all PLGA particles loaded with PEI-ApoE pDNA complexes, more than 50% of the cells are viable at concentrations as high as 1000 μg/ml medium in both cell lines. This shows that PLGA particles loaded with PEI-ApoE pDNA complexes retain the low cytotoxicity properties of PLGA particles. No significant difference in the toxicity of the PLGA particles loaded with PEI-ApoE pDNA complexes is observed among the different formulations. Low cytotoxicity of PLGA particles loaded with PEI-ApoE pDNA complexes could also be attributed to the slow release of PEI-ApoE pDNA complexes from PLGA particles, which reduces the direct interaction of cationic polymer with cells.
5. Conclusions
In this study, we rationally designed and developed a non-viral vector for targeted and sustained delivery of genes to liver cells. Cationic PEI polymers were used to condense pDNA and improve transfection efficiencies. These complexes were loaded into biodegradable PLGA particles to provide sustained release and improve toxicity profiles of the delivery system. A liver specific promoter and the use of a galactose ligand were evaluated to improve the transgene expression generated in HepG2 cells. Several parameters including the composition of the PLGA polymer, the PVA surfactant concentration, the structure of the PEI and the N/P ratio of the PEI-pDNA complexes were investigated to optimize the transgene expression generated by the PLGA PEI ApoE pDNA delivery system. Encapsulation of PEI-ApoE pDNA complexes in PLGA particles resulted in particle size reduction, zeta potential increases and pDNA loading enhancement. Additionally, the PLGA PEI ApoE pDNA particles showed sustained transgene expression in HepG2 cells for at least 13 days. The PLGA PEI pDNA particles had cytotoxicity profiles that were significantly lower than PEI and similar to unmodified PLGA as demonstrated by MTT assays. The optimum PLGA PEI ApoE pDNA particles for transfection of HepG2 cells was achieved by preparing particles using a 2% PVA surfactant concentration and a 50-50 PLGA composition.
Table 8.
Cytotoxicity of PEI-ApoE pDNA complexes in free form or loaded in PLGA particles and PLGA particles loaded with ApoE pDNA particles in COS-7 cell lines. The results are reported as 50% of cell viability (LD50). The results are the mean of three experiments ± SD.
| Sample | LD50 (μg particles/ml of DMEM medium) |
|---|---|
| Branched PEI | 150±24 |
| Linear PEI | 170±15 |
| GPEI | 27±5 |
| PLGA | >1000 |
| Formulation 1 | >1000 |
| Formulation 2 | >1000 |
| Formulation 3 | >1000 |
| Formulation 4 | >1000 |
| Formulation 5 | >1000 |
| Formulation 6 | >1000 |
| Formulation 7 | >1000 |
| Formulation 8 | >1000 |
| Formulation 9 | >1000 |
| Formulation 10 | >1000 |
| Formulation 11 | >1000 |
Acknowledgments
We gratefully acknowledge support from the American Cancer Society (RSG-09-015-01-CDD), the National Cancer Institute at the National Institutes of Health (1R21CA13345-01/1R21CA128414-01A2), and the Pharmaceutical Research and Manufacturers of America Foundation. J. Intra acknowledges support from the Parenteral Drug Association for a predoctoral fellowship. We have no declarations of conflicts of interest.
References
- 1.Salem AK, Searson PC, Leong KW. Multifunctional nanorods for gene delivery. Nature Materials. 2003;2(10):668–671. doi: 10.1038/nmat974. [DOI] [PubMed] [Google Scholar]
- 2.Abbas AO, Donovan MD, Salem AK. Formulating poly(lactide-co-glycolide) particles for plasmid DNA delivery. Journal of Pharmaceutical Sciences. 2008;97(7):2448–2461. doi: 10.1002/jps.21215. [DOI] [PubMed] [Google Scholar]
- 3.Intra J, Salem AK. Fabrication, Characterization and In Vitro Evaluation of Poly(D,L-Lactide-co-Glycolide) Microparticles Loaded With Polyamidoamine-Plasmid DNA Dendriplexes for Applications in Nonviral Gene Delivery. Journal of Pharmaceutical Sciences. 2010;99(1):368–384. doi: 10.1002/jps.21840. [DOI] [PMC free article] [PubMed] [Google Scholar]
- 4.Sun X, et al. Targeted gene delivery to hepatoma cells using galactosylated liposome-polycation-DNA complexes (LPD) Journal of Drug Targeting. 2005;13(2):121–128. doi: 10.1080/10611860400024714. [DOI] [PubMed] [Google Scholar]
- 5.Wang SL, et al. Design and synthesis of novel galactosylated polymers for liposomes as gene drug carriers targeting the hepatic asialoglycoprotein receptor. Journal of Drug Targeting. 2008;16(3):233–242. doi: 10.1080/10611860801902609. [DOI] [PubMed] [Google Scholar]
- 6.Kim TH, et al. Synergistic effect of poly(ethylenimine) on the transfection efficiency of galactosylated chitosan/DNA complexes. Journal of Controlled Release. 2005;105(3):354–366. doi: 10.1016/j.jconrel.2005.03.024. [DOI] [PubMed] [Google Scholar]
- 7.Christopher M, Wiethoff CRM. Barriers to nonviral gene delivery. Journal of Pharmaceutical Sciences. 2003;92(2):203–217. doi: 10.1002/jps.10286. [DOI] [PubMed] [Google Scholar]
- 8.Gao G, VL, Wilson J. New Recombinant Serotypes of AAV Vectors. Current Gene Therapy. 2005;5(3):285–297. doi: 10.2174/1566523054065057. [DOI] [PubMed] [Google Scholar]
- 9.Midoux P, et al. Specific Gene-Transfer Mediated by Lactosylated Poly-L-Lysine into Hepatoma-Cells. Nucleic Acids Research. 1993;21(4):871–878. doi: 10.1093/nar/21.4.871. [DOI] [PMC free article] [PubMed] [Google Scholar]
- 10.Zanta MA, et al. In vitro gene delivery to hepatocytes with galactosylated polyethylenimine. Bioconjugate Chemistry. 1997;8(6):839–844. doi: 10.1021/bc970098f. [DOI] [PubMed] [Google Scholar]
- 11.Sagara K, Kim SW. A new synthesis of galactose-poly(ethylene glycol)-polyethylenimine for gene delivery to hepatocytes. Journal of Controlled Release. 2002;79(1–3):271–281. doi: 10.1016/s0168-3659(01)00555-7. [DOI] [PubMed] [Google Scholar]
- 12.Chen J, et al. Galactose-poly(ethylene glycol)-polyethylenimine for improved lung gene transfer. Biochemical and Biophysical Research Communications. 2008;375(3):378–383. doi: 10.1016/j.bbrc.2008.08.006. [DOI] [PubMed] [Google Scholar]
- 13.Cook SE, et al. Galactosylated polyethylenimine-graft-poly(vinyl pyrrolidone) as ahepatocyte-targeting gene carrier. Journal of Controlled Release. 2005;105(1–2):151–163. doi: 10.1016/j.jconrel.2005.03.011. [DOI] [PubMed] [Google Scholar]
- 14.Hashida M, et al. Targeted delivery of drugs and proteins to the liver via receptor-mediated endocytosis. Journal of Controlled Release. 1997;46(1–2):129–137. [Google Scholar]
- 15.Hohokabe M, et al. Hepatocyte-selective gene transfer by galactosylated Protein/Linear Polyethyleneimine/Plasmid DNA complexes in mice. Journal of Biomedical Nanotechnology. 2007;3:277–284. [Google Scholar]
- 16.Kunath K, et al. Galactose-PEI-DNA complexes for targeted gene delivery: degree of substitution affects complex size and transfection efficiency. Journal of Controlled Release. 2003;88(1):159–172. doi: 10.1016/s0168-3659(02)00458-3. [DOI] [PubMed] [Google Scholar]
- 17.Zhang XQ, et al. Galactosylated ternary DNA/polyphosphoramidate nanoparticles mediate high gene transfection efficiency in hepatocytes. Journal of Controlled Release. 2005;102(3):749–763. doi: 10.1016/j.jconrel.2004.10.024. [DOI] [PubMed] [Google Scholar]
- 18.Zhang XQ, et al. Potent antigen-specific immune responses stimulated by codelivery of CpG ODN and antigens in degradable microparticles. Journal of Immunotherapy. 2007;30(5):469–478. doi: 10.1097/CJI.0b013e31802fd8c6. [DOI] [PubMed] [Google Scholar]
- 19.Zhang XQ, et al. A comparative study of the antigen-specific immune response induced by co-delivery of CpG ODN and antigen using fusion molecules or biodegradable microparticles. Journal of Pharmaceutical Sciences. 2007;96:3283–3292. doi: 10.1002/jps.20978. [DOI] [PubMed] [Google Scholar]
- 20.Zhang XQ, Intra J, Salem AK. Conjugation of polyamidoamine dendrimers on biodegradable microparticles for nonviral gene delivery. Bioconjugate Chemistry. 2007;18:2068–2076. doi: 10.1021/bc070116l. [DOI] [PubMed] [Google Scholar]
- 21.Goforth R, et al. Immune stimulatory antigen loaded particles combined with depletion of regulatory T-cells induce potent tumor specific immunity in a mouse model of melanoma. Cancer Immunology Immunotherapy. 2009;58(4):517–530. doi: 10.1007/s00262-008-0574-6. [DOI] [PMC free article] [PubMed] [Google Scholar]
- 22.Krishnamachari Y, Salem AK. Innovative strategies for co-delivering antigens and CpG oligonucleotides. Advanced Drug Delivery Reviews. 2009;61(3):205–217. doi: 10.1016/j.addr.2008.12.013. [DOI] [PMC free article] [PubMed] [Google Scholar]
- 23.Shive JMAaMS. Biodegradation and biocompatibility of PLA and PLGA microspheres. Advanced Drug Delivery Reviews. 1997;28(1):5–24. doi: 10.1016/s0169-409x(97)00048-3. [DOI] [PubMed] [Google Scholar]
- 24.Kramer MG, et al. In vitro and in vivo comparative study of chimeric liver-specific promoters. Molecular Therapy. 2003;7(3):375–385. doi: 10.1016/s1525-0016(02)00060-6. [DOI] [PubMed] [Google Scholar]
- 25.Kang YB, et al. Persistent expression of factor VIII in vivo following nonprimate lentiviral gene transfer. Blood. 2005;106(5):1552–1558. doi: 10.1182/blood-2004-11-4358. [DOI] [PMC free article] [PubMed] [Google Scholar]
- 26.Zhang XQ, Intra J, Salem AK. Comparative study of poly (lactic-co-glycolic acid)-poly ethyleneimine-plasmid DNA microparticles prepared using double emulsion methods. Journal of Microencapsulation. 2008;25:1–12. doi: 10.1080/02652040701659347. [DOI] [PubMed] [Google Scholar]
- 27.Prabha S, Labhasetwar V. Critical determinants in PLGA/PLA nanoparticle-mediated gene expression. Pharmaceutical Research. 2004;21(2):354–364. doi: 10.1023/b:pham.0000016250.56402.99. [DOI] [PubMed] [Google Scholar]
- 28.Wu XS, Wang N. Synthesis, characterization, biodegradation, and drug delivery application of biodegradable lactic/glycolic acid polymers. Part II: Biodegradation. Journal of Biomaterials Science-Polymer Edition. 2001;12(1):21–34. doi: 10.1163/156856201744425. [DOI] [PubMed] [Google Scholar]
- 29.Oh YK, et al. Polyethylenimine-mediated cellular uptake, nucleus trafficking and expression of cytokine plasmid DNA. Gene Therapy. 2002;9(23):1627–1632. doi: 10.1038/sj.gt.3301735. [DOI] [PubMed] [Google Scholar]
- 30.Intra J, Salem AK. Characterization of the transgene expression generated by branched and linear polyethylenimine-plasmid DNA nanoparticles in vitro and after intraperitoneal injection in vivo. Journal of Controlled Release. 2008;130(2):129–138. doi: 10.1016/j.jconrel.2008.04.014. [DOI] [PMC free article] [PubMed] [Google Scholar]
- 31.Dunlap DD, et al. Nanoscopic structure of DNA condensed for gene delivery. 1997:3095–3101. doi: 10.1093/nar/25.15.3095. [DOI] [PMC free article] [PubMed] [Google Scholar]
- 32.Kunath K, et al. Low-molecular-weight polyethylenimine as a non-viral vector for DNA delivery: comparison of physicochemical properties, transfection efficiency and in vivo distribution with high-molecular-weight polyethylenimine. Journal of Controlled Release. 2003;89(1):113–125. doi: 10.1016/s0168-3659(03)00076-2. [DOI] [PubMed] [Google Scholar]
- 33.Nandi A, Khakhar DV, Mehra A. Coalescence in Surfactant-Stabilized Emulsions Subjected to Shear Flow. 2001:2647–2655. [Google Scholar]
- 34.Galindo-Rodriguez S, et al. Physicochemical Parameters Associated with Nanoparticle Formation in the Salting-Out, Emulsification-Diffusion, and Nanoprecipitation Methods. Pharmaceutical Research. 2004;21(8):1428–1439. doi: 10.1023/b:pham.0000036917.75634.be. [DOI] [PubMed] [Google Scholar]
- 35.De Rosa G, et al. Poly(lactide-co-glycolide) microspheres for the controlled release of oligonucleotide/polyethylenimine complexes. Journal of Pharmaceutical Sciences. 2002;91(3):790–799. doi: 10.1002/jps.10063. [DOI] [PubMed] [Google Scholar]
- 36.Walter E, et al. Microencapsulation of DNA using poly(DL-lactide-co-glycolide): stability issues and release characteristics. Journal of Controlled Release. 1999;61(3):361–374. doi: 10.1016/s0168-3659(99)00151-0. [DOI] [PubMed] [Google Scholar]
- 37.Chumakova OV, et al. Composition of PLGA and PEI/DNA nanoparticles improves ultrasound-mediated gene delivery in solid tumors in vivo. Cancer Letters. 2008;261(2):215–225. doi: 10.1016/j.canlet.2007.11.023. [DOI] [PubMed] [Google Scholar]
- 38.Fischer D, et al. A novel non-viral vector for DNA delivery based on low molecular weight, branched polyethylenimine: Effect of molecular weight on transfection efficiency and cytotoxicity. Pharmaceutical Research. 1999;16(8):1273–1279. doi: 10.1023/a:1014861900478. [DOI] [PubMed] [Google Scholar]


