

Abstract
Background The primary objective of this study was to test interobserver reliability when classifying fractures by consensus by AO types and groups among a large international group of surgeons. Secondarily, we assessed the difference in inter- and intraobserver agreement of the AO classification in relation to geographical location, level of training, and subspecialty.
Methods A randomized set of radiographic and computed tomographic images from a consecutive series of 96 distal radius fractures (DRFs), treated between October 2010 and April 2013, was classified using an electronic web-based portal by an invited group of participants on two occasions.
Results Interobserver reliability was substantial when classifying AO type A fractures but fair and moderate for type B and C fractures, respectively. No difference was observed by location, except for an apparent difference between participants from India and Australia classifying type B fractures. No statistically significant associations were observed comparing interobserver agreement by level of training and no differences were shown comparing subspecialties. Intra-rater reproducibility was “substantial” for fracture types and “fair” for fracture groups with no difference accounting for location, training level, or specialty.
Conclusion Improved definition of reliability and reproducibility of this classification may be achieved using large international groups of raters, empowering decision making on which system to utilize.
Level of Evidence Level III
Keywords: distal radius fracture, classification, reliability, reproducibility
The Müller AO classification of distal radius fractures (DRFs) was first published in 1987 as a part of the group's overall classification system for long bone fractures.1 This scheme was adopted by the Orthopaedic Trauma Association as the system of choice in 2007 and termed the “AO/OTA Classification of Fractures and Dislocations.”2 It was originally designed to provide a measure of injury severity, provide information for planning treatment, and facilitate scientific communication.3 It remains one of the most widely used classification systems for DRFs in clinical research today. The original version classifies fractures into 3 types (A, B, and C), 9 groups (1, 2, and 3), and 27 subgroups (0.1, 0.2, and 0.3).3 The shortened form including nine categories (type and group) is most widely used.
This system demonstrates varying levels of agreement, with an interobserver kappa between 0.37 and 0.68 for fracture types.4 5 Inter- and intraobserver agreement of this classification has been typically evaluated by having a few surgeons, and surgeons-in-training of varying levels of experience evaluate radiographic studies and apply the classification. Because observer variability has an effect on the comparability of various scientific investigations, evaluation of the system may be improved by using a larger, international cohort.
We sought to establish reliability and reproducibility of the AO classification on radiographs and computed tomographic scans by a large cohort of observers practicing in different geographical regions. We tested the primary null hypothesis that interobserver reliability is similar for AO fracture types and groups.
Secondarily, we assessed the difference in inter- and intraobserver agreement of the AO classification in relation to geographical location of observers, their level of training, and subspecialty.
Methods
Study Design
After obtaining institutional review board approval from Alberto Fernandez's institute, we included a consecutive series of 96 DRFs treated at his institution from October 2010 to April 2013, for which both computed tomographic scans and posterior-anterior and lateral radiographs were available. The fractures were randomly ordered and images were built into an electronic survey system (REDCap, Vanderbilt University, Nashville , TN).6 At least one computed tomographic image through the fracture in the sagittal, coronal, and transverse plane along with a three-dimensional view was included, in addition to a lateral and posterior-anterior radiograph. Full consent was acquired for use of the images for research and educational purposes.
We then invited participants to classify all 96 fractures by AO type and group (subgroups were not included). We also provided the option “AO classification insufficient” for both type and group. Participants who accepted the invitation and consented to the study were provided a diagrammatic version of the AO classification that could be used during the grading process (Fig. 1). All participants completed the initial survey followed by a second survey independently. Surveys were sent via email link observing a 3-week washout period between each rating. The format included 96 sets of images randomly ordered and then reordered for the second survey. Participants were blinded to their previous rating.
Fig. 1.
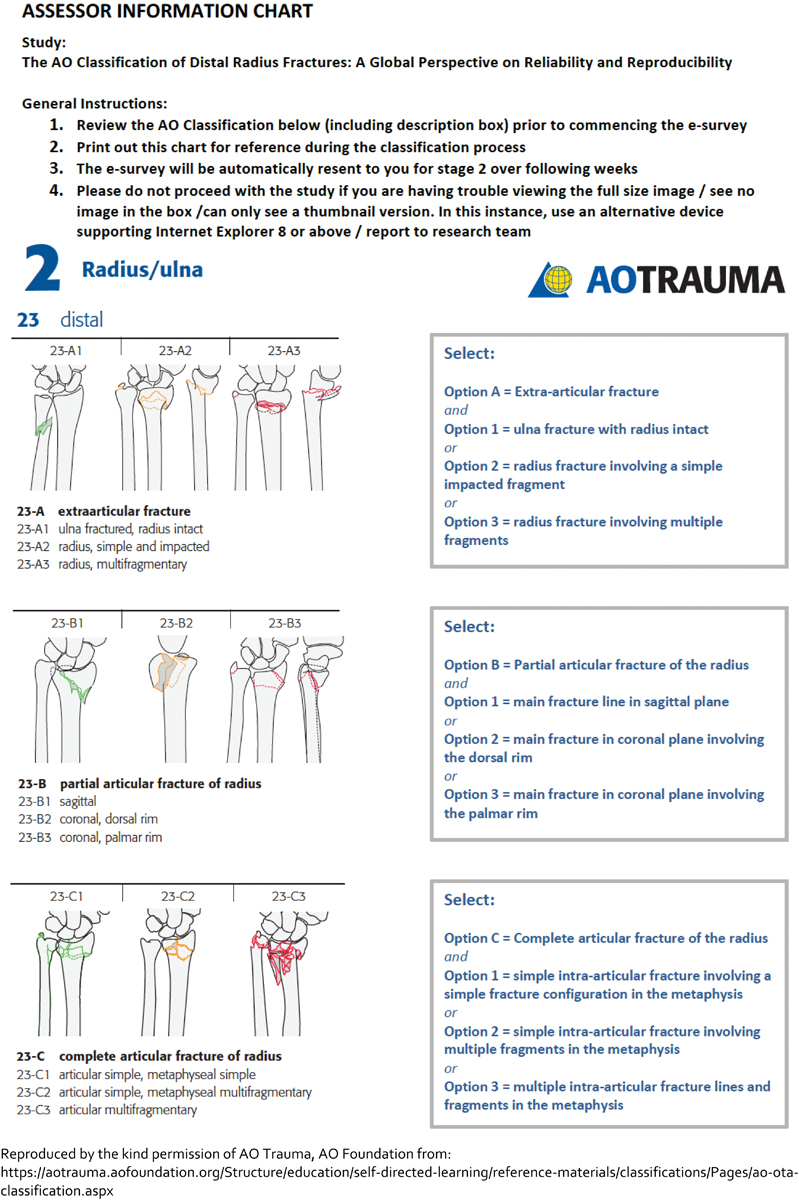
Assessor information sheet including instructions and classification system as a reference.
Study Population
Participants were recruited from the authors' international network. Acknowledgment, scientific curiosity, and camaraderie were the only incentives for participation. They received the study protocol and, after returning a signed participation form, a link to the first survey. Of the 75 invited, 65 completed the first survey of whom 50 also classified the fractures a second time. Fifteen percent of the participants were female (n = 10). The majority practiced in Spain (31%, n = 20) and the United Kingdom (20%, n = 13). Seventy-seven percent (n = 50) were registrars or fellows. Of the consultant or attending level surgeons (n = 15), the majority (n = 9) were upper extremity specialists (Table 1).
Table 1. Observer demographics.
| n = 65 | ||
|---|---|---|
| Variables | Data | |
| Sex | ||
| Male | 55 (85%) | |
| Female | 10 (15%) | |
| Area | ||
| United Kingdom | 13 (20%) | |
| Belgium | 8 (12%) | |
| The Netherlands | 4 (6.2%) | |
| Spain | 20 (31%) | |
| China | 1 (1.5%) | |
| India | 5 (7.7%) | |
| Australia | 3 (4.6%) | |
| Uruguay | 11 (17%) | |
| Level | ||
| Registrars | 50 (77%) | |
| Training years | 3.1 ( ± 2.0) | |
| Surgeons | 15 (23%) | |
| Practice years | 10 ( ± 8.6) | |
| Specialty | ||
| Upper extremity | 9 (14%) | |
| Trauma | 5 (7.7%) | |
| General orthopedics | 1 (1.5%) | |
| Residents | 50 (77%) | |
Statistical Analysis
To determine the fracture distribution, we averaged all 11,040 ratings (consensus-based assessment) (Table 2).
Table 2. Fracture demographics.
| n = 11,040 | ||
|---|---|---|
| Fractures | ||
| Type A | 2,933 (27%) | |
| A.1 | 52 (0.47%) | |
| A.2 | 1,332 (12%) | |
| A.3 | 1,488 (13%) | |
| A. insufficient | 61 (0.55%) | |
| Type B | 2,672 (24%) | |
| B.1 | 587 (5.3%) | |
| B.2 | 907 (8.2%) | |
| B.3 | 1,053 (9.5%) | |
| B. insufficient | 125 (1.1%) | |
| Type C | 5,200 (47%) | |
| C.1 | 1,620 (15%) | |
| C.2 | 1,474 (13%) | |
| C.3 | 1,960 (18%) | |
| C. insufficient | 146 (1.3%) | |
| AO type insufficient | 235 (2.1%) | |
Note: Discrete data presented as number (percentage), continuous data as mean (± standard deviation).
Interobserver variability was assessed by intra-class correlation coefficient. This accounted for deflation of interobserver agreement, which may occur within large cohorts when using multi-rater kappa. Since intra-class correlation coefficient is used for continuous data, we converted all fracture classifications to 0 or 1 scores. For example, an observer rates a fracture C1. His/her rating is converted to 1 in the C1 category and 0 for all other categories. Subsequently, the mean intra-class correlation coefficient per fracture and per group and type is calculated. Using this method, there is no gold standard indicating the “‘real” fracture type. Instead the intra-class correlation reflects the consensus of the AO fracture type or group of all raters. To calculate the intra-class correlation, we used a two-way random effects model for each AO fracture type and group. This model assumes all raters rate the same set of fractures and that they are sampled randomly from a larger population. We report the absolute agreement, that is, how much each measurement performed per observer differed from the other observers.
Intraobserver agreement, the reproducibility of one's previous assessment, was determined by using Cohen kappa statistic. This measure could only be computed for the 50 assessors who completed both the first and second surveys.
The generated values are interpreted according to the guidelines of Landis and Koch. A value of 0.01 to 0.20 indicates slight agreement; 0.21 to 0.40, fair agreement; 0.41 to 0.60, moderate agreement; 0.61 to 0.80, substantial agreement; and 0.81 to 0.99, almost perfect agreement. Zero indicates no agreement beyond that expected because of chance alone; –1.00, total disagreement; and +1.00, perfect agreement.7 We regarded nonoverlapping confidence intervals (CIs) as a significant difference; all statistical analyses were conducted using Stata 13.0 (StataCorp LP, Texas).
Results
By consensus, 27% (2,933) of the fractures were rated as type A, 24% (2,672) as type B, 47% (5,200) as type C, and 2% (235) as unclassifiable (Table 2). The interobserver agreement was substantial concerning type A fractures (0.68, 95% CI: 0.62–74) and moderate concerning type C (0.44, 95% CI: 0.37–0.52) fractures. It was fair for type B (0.28, 95% CI: 0.23–0.35).
We found variable intra-class correlations between AO fracture group ratings for all three fracture types, with the C.3 classification being the most reliably classified (moderate agreement, C.3: 0.45, 95% CI: 0.39–0.53, vs. slight agreement, C.1: 0.13, 95% CI: 0.10–0.17 and C.2: 0.13, 95% CI: 0.10–0.18).
We found no difference in interobserver agreement based on practice location when classifying AO type A and C fractures. Classifying type B fractures, there were no significant differences in interobserver reliability, except for an apparent difference between India and Australia (India: 0.23, 95% CI: 0.16–0.31 vs. Australia 0.42, 95% CI: 0.33–0.53).
Although registrars had less interobserver agreement than consultant or attending surgeons for all fracture types, this was not significant. We found no difference in interobserver reliability between specialty types (Table 3).
Table 3. Inter-rater agreement (intra-class correlation coefficient).
| Variable | Ratings | Type A | Type B | Type C |
|---|---|---|---|---|
| Overall | 115 | 0.68 (0.62–0.74) | 0.28 (0.23–0.35) | 0.44 (0.37–0.52) |
| Group | ||||
| 1 | 0.026 (0.018–0.037) | 0.22 (0.17–0.28) | 0.13 (0.10–0.17) | |
| 2 | 0.39 (0.32–0.46) | 0.080 (0.061–0.11) | 0.13 (0.10–0.18) | |
| 3 | 0.32 (0.27–0.40) | 0.31 (0.25–0.38) | 0.45 (0.39–0.53) | |
| Level | ||||
| Registrar | 86 | 0.67 (0.60–0.73) | 0.28 (0.23–0.35) | 0.42 (0.36–0.50) |
| Surgeon | 29 | 0.73 (0.67–0.78) | 0.32 (0.26–0.40) | 0.51 (0.44–0.58) |
| General orthopedics | 2 | 0.66 (0.53–0.76) | 0.44 (0.26–0.58) | 0.63 (0.49–0.73) |
| Upper extremity | 17 | 0.72 (0.66–0.78) | 0.36 (0.29–0.44) | 0.52 (0.45–0.60) |
| Trauma | 10 | 0.74 (0.69–0.80) | 0.28 (0.21–0.37) | 0.48 (0.40–0.57) |
| Area | ||||
| United Kingdom | 22 | 0.67 (0.61–0.74) | 0.31 (0.24–0.38) | 0.50 (0.43–0.58) |
| Belgium | 14 | 0.66 (0.60–0.73) | 0.34 (0.27–0.42) | 0.47 (0.40–0.56) |
| The Netherlands | 8 | 0.67 (0.59–0.74) | 0.35 (0.27–0.45) | 0.49 (0.40–0.58) |
| Spain | 38 | 0.70 (0.64–0.76) | 0.30 (0.24–0.37) | 0.42 (0.35–0.50) |
| China | 2 | 0.66 (0.53–0.76) | 0.44 (0.26–0.58) | 0.62 (0.49–0.73) |
| India | 7 | 0.70 (0.63–0.76) | 0.23 (0.16–0.31) | 0.37 (0.29–0.57) |
| Australia | 5 | 0.59 (0.49–0.67) | 0.42 (0.33–0.53) | 0.55 (0.45–0.64) |
| Uruguay | 19 | 0.71 (0.65–0.77) | 0.27 (0.21–0.34) | 0.43 (0.36–0.51) |
Note: Data presented as mean (95% confidence interval).
Intraobserver reproducibility was substantial for fracture types (0.63, 95% CI: 0.59–65) and only fair for fracture groups (0.40, 95% CI: 0.37–0.44). We found no difference in intraobserver reproducibility based on practice location or level of training (Table 4).
Table 4. Intra-rater agreement.
| Variable | Raters | Types | Groups |
|---|---|---|---|
| Overall | 50 | 0.63 (0.59–0.65) | 0.40 (0.37–0.44) |
| Level | |||
| Registrar | 36 | 0.60 (0.56–0.64) | 0.43 (0.36–0.50) |
| Surgeon | 14 | 0.68 (0.63–0.73) | 0.39 (0.36–0.43) |
| General orthopedics | 1 | 0.59 | 0.28 |
| Upper extremity | 8 | 0.65 (0.58–0.73) | 0.49 (0.35–0.64) |
| Trauma | 5 | 0.73 (0.64–0.83) | 0.41 (0.32–0.50) |
| Area | |||
| United Kingdom | 9 | 0.60 (0.51–0.70) | 0.38 (0.30–0.47) |
| Belgium | 6 | 0.59 (0.42–1.0) | 0.36 (0.19–0.53) |
| The Netherlands | 4 | 0.71 (0.55–0.87) | 0.42 (0.24–0.59) |
| Spain | 18 | 0.63 (0.57–0.69) | 0.43 (0.36–0.49) |
| China | 1 | 0.59 | 0.28 |
| India | 2 | 0.59 (−0.43 to 1.0) | 0.40 (−0.62 to 1) |
| Australia | 2 | 0.61 (−0.025 to 1.2) | 0.55 (−0.21 to 1) |
| Uruguay | 8 | 0.63 (0.58–0.69) | 0.38 (0.33–0.44) |
Note: Data presented as mean (95% confidence interval).
Discussion
The classification of fractures by different surgeons at different times needs to be similar and consistent if a system is to become widely utilized. The AO/OTA system is recognized as a useful, inclusive scheme for broad anatomical classification but has been criticized for lack of practical application in surgical decision making.4 8 Previous studies have demonstrated variable interobserver reliability and intra-rater reproducibility, ranging from fair to substantial (Table 5). The majority of these have involved relatively small surgeon–investigator cohorts. We sought to establish the level of reliability and reproducibility of this classification in a large international cohort of observers of different levels of experience and subspecialty interest. To the best of our knowledge, this has not been demonstrated in the literature.
Table 5. Inter- and intrarater agreement of the AO distal radius fracture classification reported in the literature.
| Study (year) | Modality | Images | Raters | Type of observers | Inter-rater agreement (kappa) | Intra-rater agreement (kappa) | ||||||||
|---|---|---|---|---|---|---|---|---|---|---|---|---|---|---|
| S | F | R | O | Rad | Type | Group | Subgroup | Type | Group | Subgroup | ||||
| Andersen et al (1996)15 | XR | 55 | 4 | 2 | 2 | 0.64 | 0.30 | 0.25 | 0.66 | 0.37 | 0.31 | |||
| Kreder et al (1996)5 a | XR | 30 | 36 | 8 | 0.68 | 0.48 | 0.33 | 0.86 | ||||||
| Illarramendi et al (1998)4 b | XR | 200 | 6 | 3 | 1 | 2 | 0.37 | 0.57 | ||||||
| Flikkilä et al (1998)9 c | XR | 30 | 5 | 2 | 1 | 2 | 0.48 | 0.23 | 0.18 | |||||
| CT | 0.78 | 0.25 | 0.16 | |||||||||||
| McDermid et al (2001)20 | XR | 64 | 2 | 2 | 0.38 (0.15–0.61) | 0.33 (0.10–0.56) | ||||||||
| Oskam et al (2001)21 | XR | 124 | 2 | 2 | 0.65 | |||||||||
| Jin et al (2007)14 , d | XR | 43 | 5 | 5 | 0.45 (0.31–0.71) | 0.25 (0.18–0.33) | 0.49 (0.45–0.57) | 0.36 (0.34–0.41) | ||||||
| 0.48 (0.28–0.71) | 0.29 (0.21–0.71) | |||||||||||||
| Ploegmakers et al (2007)12 | XR | 5 | 45 | Combination of surgeons and residents | 0.52 | |||||||||
| Belloti et al (2008)11 | XR | 90 | 5 | 2 | 1 | 1 | 1 | 0.27–0.31 | 0.46–0.61 | |||||
| Kural et al (2010)10 | XR | 32 | 9 | 9 | 0.096 | 0.31 | ||||||||
| van Leerdam et al (2010)22 | XR | 621 | International cohort of surgeons vs. research team | 0.60 | 0.41 | 0.33 | ||||||||
| Küçük et al (2013)13 | XR | 50 | 20 | 10 | 10 | 0.30–0.32 | 0.37–0.50 | |||||||
| Siripakarn et al (2013)16 | XR | 98 | 6 | 3 | 0.34 | 0.29 | ||||||||
| Arealis et al (2014)17 | XR | 26 | 7 | 7 | 0.30 | 0.65 | ||||||||
| CT | 0.30 | |||||||||||||
| Jayakumar et al (current study) | XR & CT | 96 | 65 | 15 | 15 | 35 | 0.63 (0.59–0.65) | 0.40 (0.37–0.44) | ||||||
Note: Type of observers—S, surgeons; F, fellows; R, registrars; O, student, nonclinical, therapist, nurse; Rad, radiologists; blank, not measured/not disclosed.
Study involves 36 raters but inter- and intra-rater agreement analysis reported in eight surgeons only.
Study regrouped for statistical analysis from full AO 27-part classification into five groups (I = A, II = B, III = C1, IV = C2, V = C3).
Study regrouped for statistical analysis from full AO 27-part classification into five groups (A2, A3, and C1, C2, C3) and two main types (A and C).
We found different levels of agreement among raters when classifying AO fracture types and groups. Previous studies do not distinguish between different AO fracture types, groups, and subgroups and use kappa statistics; this makes it difficult to compare our study with prior results. Kappa for interobserver reliability from studies assessing AO fracture types ranges from 0.37 to 0.784 8; between groups, it ranges from 0.23 to 0.485 9; and between subgroups, it ranges from 0.094 to 0.34.10 11 The varying results might be explained by difference in case mix (more AO type B fractures would result in lower agreement) and the different number of observers, ranging between two and eight for types and groups, and two and twenty for subgroups (Table 5). Higher levels of interobserver agreement with type A fractures may not be surprising, as one assumes that the distinction between extra- and intra-articular fractures may be clearer to define than partial and complete articular configurations. Making a clear distinction between a fracture involving part of a joint surface versus one with simple articular involvement and unclear diaphyseal separation (C.1 fractures) may be more challenging. The type B classification, in particular, had the worst agreement in our study and this may reflect the difficulty in categorizing the variety of partial articular fracture configurations, such as “die-punch” fractures. Communication on these particular fracture types might benefit from further information and more consideration.
From the geographical perspective, observers had similar agreement classifying type A and C fractures, but observers from India had less interobserver reliability than observers from Australia when classifying type B fractures. No previous study compares difference in interobserver reliability based on geographic location. Our results again seem to emphasize the difficulty classifying AO type B fractures. This is of particular interest to the international scientific community reporting on these fracture types. Future research could assess how to more reliably classify partial intra-articular fractures.
We found no difference in interobserver reliability between specialty types. Although residents had less interobserver agreement than consultant or attending surgeons for all fracture types, this was not significant. It could be assumed that the level of agreement among residents may not be as high as the more senior and experienced surgeons, despite a lack of statistical significance. On the other hand, previous study also found low but similar correlation for interobserver reliability between observers depending on experience for AO groups (spearman correlation <6 years’ experience: 0.10, p = 0.04 vs. ≥6 years' experience: 0.10, p = 0.05; total 45 observers, unknown distribution between groups).12 Another study also found similar interobserver reliability between 10 residents and 10 surgeons for AO subgroups (mean kappa residents: 0.30 vs. surgeons 0.32).13 These results and ours suggest that the AO classification scheme can reliably be used by trainees and more experienced users, and between specialties in terms of interobserver reliability.
In our study, kappa intraobserver reproducibility was substantial (0.63, 95% CI: 0.59–65) for fracture types and fair for groups (0.40, 95% CI: 0.37–0.44). In the literature, kappa for AO type ranges between 0.49 and 0.6614 15; between 0.29 and 0.65 for groups16 17; and between 0.31 and 0.46 for subgroups (Table 5).10 11 15 We found no difference in intraobserver reproducibility based on practice location or level of training. Prior results vary for intraobserver reliability by experience. One previous study found higher intraobserver agreement between younger raters (one fellow and two residents) than three orthopedic surgeons (kappa 0.63 trainees vs. 0.50 surgeons, p < 0.03).4 Another study found higher intraobserver reliability of subgroups between 10 residents (kappa 0.37) and 10 surgeons (kappa 0.50).13 Similar to a study by Andersen et al, we found no difference in intraobserver reliability by specialty. They found similar kappa values between two radiologists and two hand surgeons.15 The AO classification seems reproducible by observers, but reliability decreases as groups and subgroups are included. It is unclear if there is a difference in intraobserver reliability based on experience. This is something future studies could assess.
This study has some limitations. First, there were no requirements placed on the types of DRFs acquired for the study which led to extremely low numbers of certain configurations, for example, type A1 fractures (0.3% by consensus-based assessment). Although this is not a limitation in itself, when only a few observers choose a specific outcome, intra-class correlation loses reliability and thus, the intra-class correlation for A1 fractures may therefore not be reliably assessed. Limited numbers were also observed in subspecialty with only one general orthopedic surgeon included limiting the strength of the comparison with this subgroup. Second, selection bias may exist given that all these injuries underwent CT scanning, suggesting a tendency for selecting more complex fracture configurations that may have warranted more detailed imaging. Thus, the range of images tested may not be an accurate representation of all fracture types. Moreover, the CT images themselves were also specific screenshots and observers were unable to gain control and scroll through the series, which may have influenced the classification. Third, some of the radiographs consisted of fractures in plaster. Although the classification does not specify which images to use when rating these injuries, reduced fractures may prevent a complete appreciation of the original configuration.
Fourth, regarding our guidelines for assessing kappa, we recognized that the interpretation by Fleiss is less favorable than that of Landis and Koch.18 However, both set ranges somewhat arbitrarily and we selected the latter given it appeared to be the most widely quoted, utilized in almost all of our identified series of studies, and included a higher number of grades, potentially providing greater depth to the conclusions. Fifth, participants were informed this was a test–retest investigation and this may in itself have created some bias in intraobserver variability. This was difficult to avoid due to logistics of participant recruitment.
Finally, the process of recruiting observers willing to participate in this study may be open to selection bias. However, we aimed to limit this by performing the investigation in a relatively large group of participants.
We established reliability of AO type and group classification in a large, international cohort. Interobserver reliability varies between types and groups, and between practice locations. Type B, C.1, and C.2 fractures had the worst interobserver reliability. Communication on these particular fracture types might benefit from further information and more consideration when faced with these configurations in the clinical setting.19 This study highlights these challenging fracture types and provides a global perspective on the utilization of this system.
Acknowledgments
The authors would like to thank Dr. Alberto Fernandez, MD, for the images and scientific advice and the Harvard Catalyst for their statistical support. The authors would also like to thank the raters who participated in this study:
Acosta Zaro A., Allen L., Al Hakim W., Andres H., Angel A., Arroyo M., Auplish S., Belloni A., Bernat A., Bertoni J., Brown K., Canizares A., Capel Agundez A., Carvajal R., Cecilia Lopez D., Cesar Cordova Peralta J., Clitherow H., Clockaerts S., Crosa F., Curion N., De Keyzer P., Devendra A., Dheep K., Dirckx M., Fei W., Fleming S., Frima H., Gallardo J., Garcia C., Garcia L., Garcia de la Fuente P., Garcia Fernandez D., Gonzalez C., Gordon M., Hernandez Rath D., Hollman F., Houwert M., Jeyaseelan L., Jiminez V., Kahane S., Lasa A., Lockey J., Martinez Leocadio M., Martin Fuentes A., Mathew P., Middleton C., Minnen L., Mulligan A., Munoz M., Olayo, Paramo P., Quintana Plaza J., Rashid M., Robledo H., Ross M., Srikanth K., Stoffelen D., Taylor M., Vacas E., Van Gestel L., Vanhees M., Vanhoecke E., Verstreken F., Zorilla Sanchez de Neyra J.
Conflict of Interest None.
Note
Prakash Jayakumar and Teun Teunis contributed equally to this work. This work was performed at the Orthopaedic Hand and Upper Extremity Service, Massachusetts General Hospital - Harvard Medical School.
References
- 1.Müller M E Nazarian S Koch P Classification AO des Fractures: Tome I: les os Longs. 1st ed Berlin, Germany: Springer-Verlag; 1987. Part 2 [Google Scholar]
- 2.Marsh J L Slongo T F Agel J et al. Fracture and dislocation classification compendium - 2007: Orthopaedic Trauma Association classification, database and outcomes committee J Orthop Trauma 200721(10, Suppl):S1–S133. [DOI] [PubMed] [Google Scholar]
- 3.Müller M E, Koch P, Nazarin S, Berlin, Heidelberg: Springer-Verlag; 1990. Radius and ulna; pp. 106–115. [Google Scholar]
- 4.Illarramendi A, González Della Valle A, Segal E, De Carli P, Maignon G, Gallucci G. Evaluation of simplified Frykman and AO classifications of fractures of the distal radius. Assessment of interobserver and intraobserver agreement. Int Orthop. 1998;22(2):111–115. doi: 10.1007/s002640050220. [DOI] [PMC free article] [PubMed] [Google Scholar]
- 5.Kreder H J, Hanel D P, McKee M, Jupiter J, McGillivary G, Swiontkowski M F. Consistency of AO fracture classification for the distal radius. J Bone Joint Surg Br. 1996;78(5):726–731. [PubMed] [Google Scholar]
- 6.Harris P A, Taylor R, Thielke R, Payne J, Gonzalez N, Conde J G. Research electronic data capture (REDCap)—a metadata-driven methodology and workflow process for providing translational research informatics support. J Biomed Inform. 2009;42(2):377–381. doi: 10.1016/j.jbi.2008.08.010. [DOI] [PMC free article] [PubMed] [Google Scholar]
- 7.Landis J R, Koch G G. The measurement of observer agreement for categorical data. Biometrics. 1977;33(1):159–174. [PubMed] [Google Scholar]
- 8.Trumble T E, Culp R, Hanel H P. et al. Instructional course lectures, the American Academy of Orthopaedic Surgeons—Intra-articular fractures of the distal aspect of the radius. J Bone Joint Surgery. 1998;80(4):582–600. [Google Scholar]
- 9.Flikkilä T, Nikkola-Sihto A, Kaarela O, Pääkkö E, Raatikainen T. Poor interobserver reliability of AO classification of fractures of the distal radius. Additional computed tomography is of minor value. J Bone Joint Surg Br. 1998;80(4):670–672. doi: 10.1302/0301-620x.80b4.8511. [DOI] [PubMed] [Google Scholar]
- 10.Kural C, Sungur I, Kaya I, Ugras A, Ertürk A, Cetinus E. Evaluation of the reliability of classification systems used for distal radius fractures. Orthopedics. 2010;33(11):801. doi: 10.3928/01477447-20100924-14. [DOI] [PubMed] [Google Scholar]
- 11.Belloti J C, Tamaoki M J, Franciozi C E. et al. Are distal radius fracture classifications reproducible? Intra and interobserver agreement. Sao Paulo Med J. 2008;126(3):180–185. doi: 10.1590/S1516-31802008000300008. [DOI] [PMC free article] [PubMed] [Google Scholar]
- 12.Ploegmakers J J, Mader K, Pennig D, Verheyen C C. Four distal radial fracture classification systems tested amongst a large panel of Dutch trauma surgeons. Injury. 2007;38(11):1268–1272. doi: 10.1016/j.injury.2007.03.032. [DOI] [PubMed] [Google Scholar]
- 13.Küçük L, Kumbaracı M, Günay H, Karapınar L, Ozdemir O. Reliability and reproducibility of classifications for distal radius fractures. Acta Orthop Traumatol Turc. 2013;47(3):153–157. doi: 10.3944/aott.2013.3038. [DOI] [PubMed] [Google Scholar]
- 14.Jin W J, Jiang L S, Shen L. et al. The interobserver and intraobserver reliability of the Cooney classification of distal radius fractures between experienced orthopaedic surgeons. J Hand Surg Eur Vol. 2007;32(5):509–511. doi: 10.1016/j.jhse.2007.03.002. [DOI] [PubMed] [Google Scholar]
- 15.Andersen D J, Blair W F, Steyers C M Jr, Adams B D, el-Khouri G Y, Brandser E A. Classification of distal radius fractures: an analysis of interobserver reliability and intraobserver reproducibility. J Hand Surg Am. 1996;21(4):574–582. doi: 10.1016/s0363-5023(96)80006-2. [DOI] [PubMed] [Google Scholar]
- 16.Siripakarn Y, Niempoog S, Boontanapibul K. The comparative study of reliability and reproducibility of distal radius' fracture classification among: AO Frykman and Fernandez classification systems. J Med Assoc Thai. 2013;96(1):52–57. [PubMed] [Google Scholar]
- 17.Arealis G, Galanopoulos I, Nikolaou V S, Lacon A, Ashwood N, Kitsis C. Does the CT improve inter- and intra-observer agreement for the AO, Fernandez and Universal classification systems for distal radius fractures? Injury. 2014;45(10):1579–1584. doi: 10.1016/j.injury.2014.06.017. [DOI] [PubMed] [Google Scholar]
- 18.Fleiss J L. New York: John Wiley & Sons; 1981. Statistical Methods for Rates and Proportions. 2nd ed; pp. 217–218. [Google Scholar]
- 19.Jupiter J B, Fernandez D L. Comparative classification for fractures of the distal end of the radius. J Hand Surg Am. 1997;22(4):563–571. doi: 10.1016/S0363-5023(97)80110-4. [DOI] [PubMed] [Google Scholar]
- 20.MacDermid J C, Richards R S, Donner A, Bellamy N, Roth J H, Hildebrand K A. Reliability of hand fellows' measurements and classifications from radiographs of distal radius fractures. Plastic Surgery. 2001;9(2):51–58. [Google Scholar]
- 21.Oskam J, Kingma J, Klasen H J. Interrater reliability for the basic categories of the AO/ASIF's system as a frame of reference for classifying distal radial fractures. Percept Mot Skills. 2001;92(2):589–594. doi: 10.2466/pms.2001.92.2.589. [DOI] [PubMed] [Google Scholar]
- 22.van Leerdam R H, Souer J S, Lindenhovius A L, Ring D C. Agreement between Initial Classification and Subsequent Reclassification of Fractures of the Distal Radius in a Prospective Cohort Study. Hand (NY) 2010;5(1):68–71. doi: 10.1007/s11552-009-9212-9. [DOI] [PMC free article] [PubMed] [Google Scholar]