Abstract
Objective:
To investigate the changes in CT number (CTN) in gross tumour volume (GTV) and organs at risk (OARs) during the course of radiation therapy (RT) for nasopharyngeal cancer (NPC).
Methods:
Daily megavoltage CT (MVCT) data collected from 30 patients with NPC treated with a prescription dose of 70 Gy in 30–33 fractions using helical tomotherapy were retrospectively analyzed. The contours of GTV and OARs on daily MVCTs were obtained by populating the planning contours from planning CT to daily MVCTs with manual editing, if necessary. The changes of GTV and OAR volumes and the histograms of CTN in the GTV and OARs during the course of RT delivery were analyzed.
Results:
Volumes of GTV and parotid glands were reduced during the course of radiation treatment, with an average shrinkage rate of 0.23% per day (range, 0.02–0.8%) and 1.2% per day (range, 0.2–2.3%), respectively. The mean CTN changes in GTV and ipsilateral and contralateral parotid glands were reduced by 52 ± 35 HU, 18 ± 20 HU and 17 ± 22 HU, respectively. For GTV, the CTN and GTV volume decreases were found to be correlated with each other (p < 0.0001). No noticeable CTN change was found in the spinal cord and non-specified tissue irradiated with low doses.
Conclusion:
The CTN changes in GTV and parotids are measurable during the delivery of fractionated radiotherapy for NPC, were associated with the doses received (the number of fractions delivered) and were patient specific.
Advances in knowledge:
The CTN change during radiotherapy is dose dependent and is measurable for NPC.
INTRODUCTION
High-dose gradients from plans with intensity-modulated radiation therapy (IMRT), such as helical tomotherapy, are particularly desirable for head and neck cancer owing to various organs at risk (OARs) adjacent to the target. Image-guided radiotherapy (IGRT) is recommended to ensure the accurate delivery of IMRT. It is widely reported that during radiation therapy (RT) for patients with head and neck cancer, significant anatomical changes can occur during the course of treatment. These changes include tumour regression and overall weight loss.1–3 These changes can be detected from images acquired with IGRT and may be accounted for by adaptive radiation therapy (ART),2,4–10 where the treatment plan is revised and delivered based on the changing anatomy of the tumour and/or OARs.3,5,11–13
It has been reported that radiation can lead to electron density changes in the lung and liver, as observed from CT images.14–18 The CT number (CTN) changes were found to be associated with radiation injuries.
In RT for head and neck cancer, changes in textural features, such as mean density, were used to characterize structural modifications on parotid glands owing to radiation.19 In this work, we explored whether radiation could cause CTN changes by examining the daily megavoltage CTs (MVCTs) acquired during IGRT for patients with nasopharyngeal cancer (NPC) and how these changes are associated with the anatomic changes observed for these patients.
METHODS AND MATERIALS
Patient data
Daily MVCT data acquired for 30 patients (24 males and 6 females) with pathologically proven NPCs treated with IGRT using tomotherapy (TomoTherapy®; Accuray Inc., Sunnyvale, CA) at the General Hospital of the People's Liberation Army were analyzed. Among these patients, 16 patients were treated with concurrent cisplatin-based chemotherapy during radiotherapy and 14 patients received radiotherapy alone. These patients had Stage I (23.3%), II (43.3%), III (26.7%) and IV (6.7%) NPC, with a median age of 46.5 years, ranging from 10 to 66 years old. For each patient, the gross tumour volume (GTV) (the primary nasopharyngeal tumour) and OARs (e.g. both ipsilateral and contralateral parotid glands and spinal cord) along with other structures were delineated based on the planning CT and MRI registration. The GTV in the planning CT ranged from 10.4 to 100.2 cm3. The prescription dose to GTV was 70 Gy in 30–33 fractions, with treatment duration of 40–45 days. The dose constraint for both parotid glands was V30 ≤ 50% (V30 is the volume covered by 30 Gy). For every treatment fraction, each patient was immobilized with a thermoplastic mask. A set of MVCT images were acquired in the normal acquisition mode [e.g. jaw width of 4 mm, pitch of 1, 2 or 3 for fine, normal or coarse resolution, with corresponding CT slice thicknesses of 2, 4 or 6 mm (in-plane resolution), respectively], and the patients were then repositioned based on the rigid-body registration of the planning CT and the daily MVCT prior to treatment delivery.
For the data sets selected in this study, the MVCT scanning lengths were sufficient to cover the entire GTV and parotid glands. For the purpose of this analysis, the GTVs were modified to largely exclude air cavity. Effort was made to keep the contouring method consistent in all MVCTs. In addition, a region of non-specified tissue (NST), which is a part of the trapezius muscle a distance away for the slices of the planning target volume and received doses substantially lower than the doses to the parotids and spinal cord, was also delineated from the planning CT. The contours of GTV, OARs (e.g. parotid glands and spinal cord) and NST were obtained on daily MVCTs by populating these contours from planning CTs to the daily CTs via rigid-body registration using a commercial software (Adaptive Plan, TomoTherapy, Accuray) and were edited manually, if necessary. For each patient, the MVCT sets for the first and last fractions and for 1 fraction per week, totalling 7 or 8 sets for patients treated with 30 or 33 fractions, were analyzed.
Data analysis
The selected daily MVCT sets and corresponding contours (e.g. GTV, parotids, spinal cord and NST) were exported in the digital imaging and communications in medicine RT format from the tomotherapy system and analyzed with an in-house software tool developed with MATLAB® v. R2013a (MathWorks, Natick, MA) to determine the volume and CTN in each voxel inside the relevant structures on each daily MVCT set. Histograms of CTN, in Hounsfield unit, for all structures on all selected fractions were obtained and the mean CTN (CTNmean) and mode CTN (CTNmode) values were calculated from each histogram. CTNmode is the CTN at which its probability distribution (e.g. histogram) reaches its maximum. To exclude air, CTNs below −400 HU were omitted from the data analysis of the GTV.
The changes in volume, CTNmean and CTNmode during the course of treatment delivery were analyzed. Two-tailed Pearson's correlation analysis was carried out to compare the changes in structure volumes and CTNs.
RESULTS
Data from representative cases
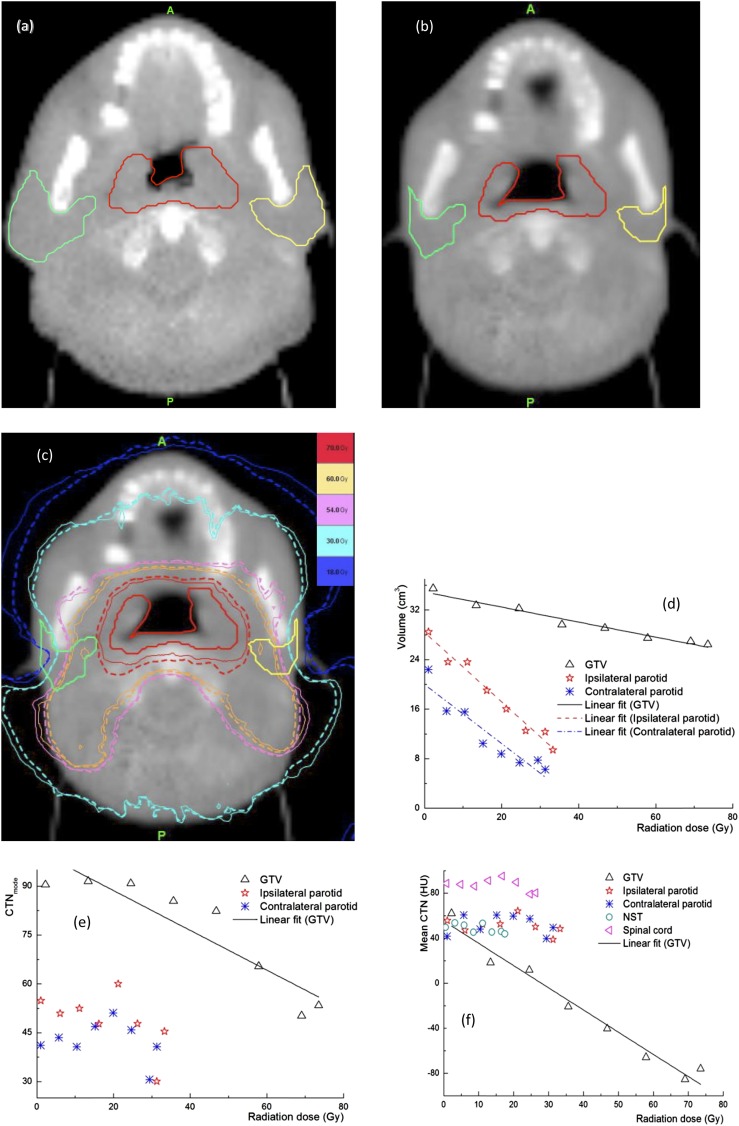
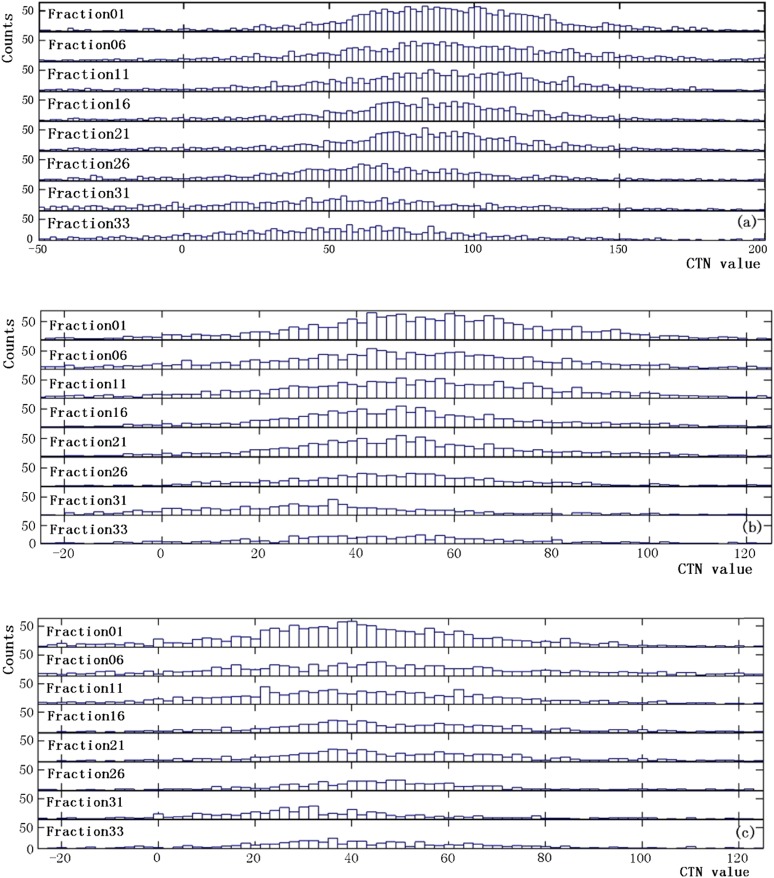
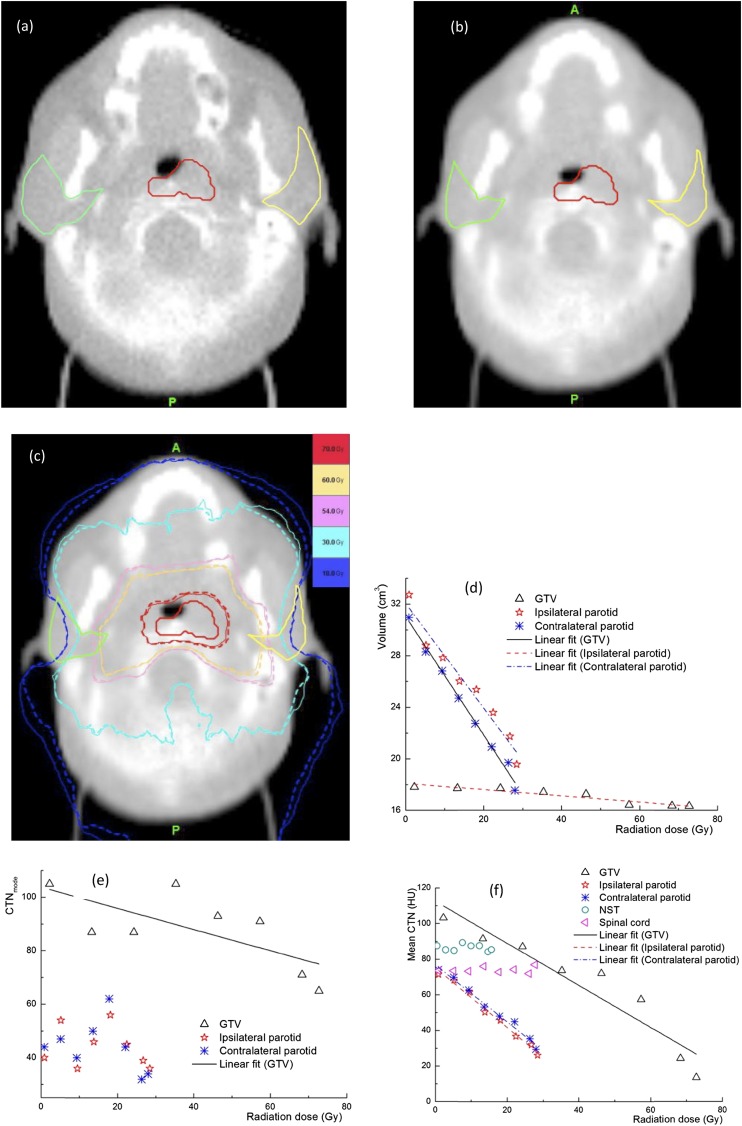
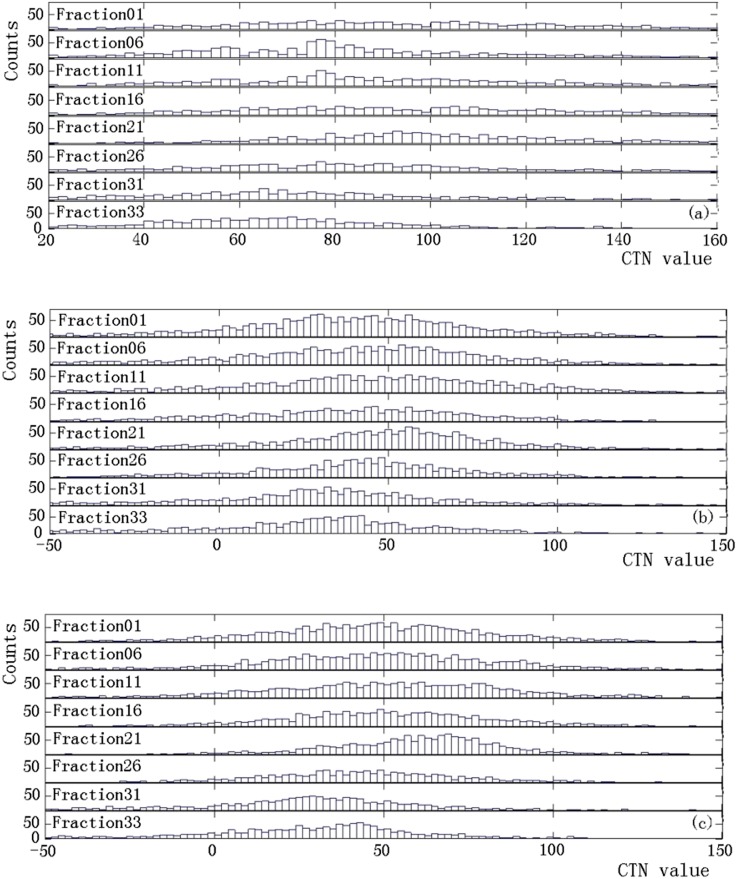
From the MVCTs acquired during the course of treatment delivery, detectable changes in CTN were observed for some patients, while significant anatomical changes in volumes were found in most patients. These changes are highly patient specific. Figure 1 shows a representative case with significant changes in the anatomy and CTN during treatment delivery. The shrinkages in GTV and OAR contours between the first (Figure 1a) and last (Figure 1b) fractions are evident. The dose distributions from the first and last fractions overlaid on the MVCT of the last fraction (Figure 1c) indicate that the doses in the ipsilateral and contralateral parotids have increased from the first to the last fraction owing to tumour shrinkage. Figure 1d shows the volume reductions for the parotid glands, 66.2% and 70.1% for the ipsilateral and contralateral glands, respectively, and GTV (25.5%) over the entire treatment course, while the changes in the CTNmode and CTNmean for various structures are presented in Figure 1e,f. It is clear that for this patient, a sizable change in the CTNmean was observed in the GTV, while the changes in other structures are minimal. There was almost no change in the CTN for the NST and spinal cord. The maximum doses to the NST and spinal cord were 20 and 30 Gy, respectively, which are substantially lower than those in the GTV (75 Gy) and parotid glands (65 Gy). This indicates that the observed changes in other structures were not due to the imaging process but were induced by radiation. The CTN histograms for the GTV and parotid glands at different fractions for the same case presented in Figure 1 are shown in Figure 2. Shifts in these histograms, particularly in GTV, were seen as more fractions were delivered. The CTNmode values obtained by fitting with a gaussian for GTV histogram show the same trend as the CTNmean. Figure 3 shows similar data, including changes in the anatomy and CTN for another sample case. It is clear that volumes of the GTV and parotids reduced during the treatment (by 8.3% for the GTV, 40.3% and 43.3% for the ipsilateral and contralateral parotid glands). The CTNmean for GTV decreased as the treatment fraction increased, while it did not change noticeably for all other structures (Figure 3f). The response of CTN for this case is clearly different from that for the case shown in Figure 2. The CTN histograms for the GTV and parotids for this case for the selected fractions are presented in Figure 4. These histograms as well as their CTNmode show a different trend compared with those in Figure 2 for a different case.
Figure 1.
Data for a representative case, changes in the gross tumour volume (GTV) and parotids between the first (a) and last (b) fractions, (c) isodose distributions of the first (solid line) and last (dashed line) fractions overlaid on the megavoltage CT of the last fraction and changes in (d) the volumes of the GTV and parotid glands, (e) the mode of CT number (CTNmode) of the GTV and parotid glands and (f) the mean CT number (CTN) values of the GTV, parotids, non-specified tissue and spinal cord, as functions of delivered radiation dose during the course of radiotherapy. HU, Hounsfield unit.
Figure 2.
CT number (CTN) histograms at various fractions for the (a) gross tumour volume, (b) ipsilateral and (c) contralateral parotid glands for the same case as in Figure 1.
Figure 3.
Data for another example case, changes in the gross tumour volume (GTV) and parotids on the daily megavoltage CT between (a) the first and (b) the last fractions, (c) isodose distributions for the first (solid line) and last (dashed line) fractions and changes in (d) the volume and (e) the mode of CT number (CTNmode) of GTV, parotids and (f) mean CT number (CTN) values of the GTV, parotids, spinal cord and non-specific tissue, as functions of the delivered dose. HU, Hounsfield unit.
Figure 4.
CT number (CTN) histograms for the sample case as shown in Figure 3 for selected fractions for (a) gross tumour volume, (b) ipsilateral and (c) contralateral parotid glands.
CT number and volume changes
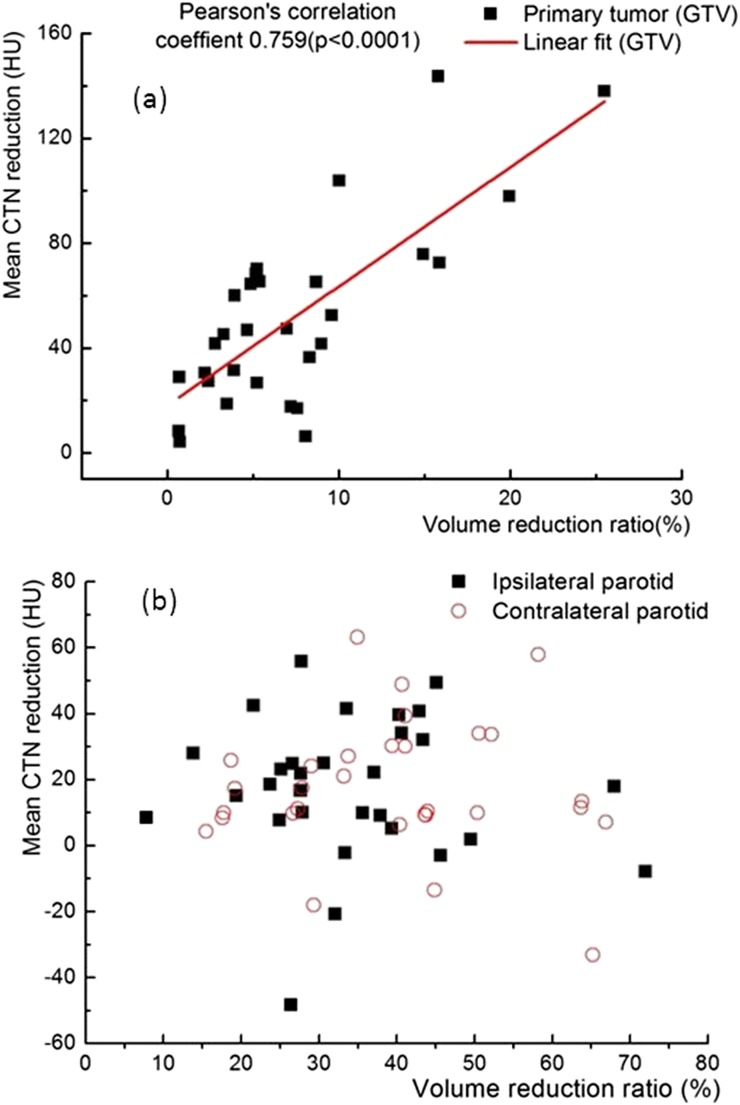
Figure 5 presents data for all 30 patients studied including (a) the percentage changes in the volumes of the parotid glands and the GTV during the entire course of treatment, (b) the mean doses of the parotids based on the helical tomotherapy plans and (c) the CTN changes for the GTV and the parotids during the whole treatment course. The volumes of the GTVs and both ipsilateral and contralateral parotid glands were reduced throughout the fractionated RT delivery with reduction rates in ranges of 0.02–0.8%, 0.2–2.3% and 0.7–2.1%, respectively, per treatment fraction. The percentage shrinkage of the ipsilateral parotids (median, 39.3 ± 15.0%) is slightly higher than that of the contralateral parotids (median, 34.2 ± 13.7%). The differences between the mean doses and the volume covered by 30 Gy of the ipsilateral and contralateral parotids based on the plans were statistically significant [30.36 ± 3.27 Gy vs 30.02 ± 3.79 Gy and 37.13 ± 4.81% vs 36.90 ± 4.67% (1 standard deviation), p < 0.0001]. The differences between the CTN changes in the contralateral and ipsilateral parotids were also significant (p < 0.001). Overall, the CTNmean values of all the GTVs were reduced during the whole treatment (Figure 5c). The CTNmean values of the parotid glands were slightly reduced for most of the patients studied. A strong correlation was observed between the relative volume reduction and the CTNmean reduction during the entire course of treatment for all GTVs studied with a Pearson's correlation coefficient of 0.759 and p < 0.0001 (Figure 6). However, there was no correlation (p = 0.780) between the relative volume reduction and the CTNmode. In addition, no significant correlation (p = 0.743) between the CTN change and the volume change in the parotid glands was seen (Figure 6).
Figure 5.
Volume and CT number (CTN) changes and mean doses for all 30 patients with nasopharyngeal cancer, (a) the percentage changes in the volumes of the parotid glands and the gross tumour volumes (GTVs) during the entire course of the treatment, (b) the mean doses of the ipsilateral parotid (Ipsi_Parotid) and contralateral parotid (Contra_Parotid) from the helical tomotherapy plans and (c) CTN changes for the GTV and the parotid glands during the whole treatment course.
Figure 6.
Correlation between the relative volume reduction and the mean CT number (CTN) reduction [in Hounsfield unit (HU)] for gross tumour volumes (GTVs) (a) and parotid glands (b) for all the patients studied.
DISCUSSION
It has been well reported that interfraction changes in the tumour and parotid glands during RT for head and neck cancer can be substantial. Barker et al3 demonstrated that nodal and primary tumour volumes assessed on repeated CT of 14 patients shrunk by about 1.8% per treatment day and that volumes of the parotid glands also decreased by 0.6% per day and shifted medially by up to a few millimetres. Similar findings were shown based on daily MVCT, repeated CT and fludeoxyglucose positron emission tomography.1,2,5,11 Hansen et al12 assessed the dosimetric impact of interfraction anatomic changes on 13 patients with head and neck cancer treated with IMRT and reported dose increases in OARs. It has been shown that the changes of parotid volumes and positions during RT resulted in an increase of mean doses to the parotid glands by 10%.6 This study shows that the volumes of the GTV, ipsilateral and contralateral parotid glands decreased on an average by 7.4%, 39.3% and 34.3%, respectively, during the whole treatment course (Figure 5). In addition to the dose increases to the parotid glands [the delivered and planned mean dose, 32.77 ± 4.95 Gy vs 30.19 ± 3.51 Gy (1 standard deviation), p < 0.0001] similar to previous studies,6,11–13 we observed CTN changes in the GTVs and parotid glands and also weight loss on an average by 11%. These changes were increased with the number of fractions delivered, thus, were radiation induced. Similar CTN changes were not observed (<3%) in the spinal cords and NSTs, where radiation doses were substantially lower than those in the GTVs and parotid glands (20–30 Gy vs 75–65 Gy in maximum doses). The observed CTN change was highly patient specific.
Various ART strategies7–9,20–23 have been reported to be effective, to correct for the interfraction dosimetric changes during the RT for head and neck cancer. In particular, the offline adaptation has been shown to be practical.9,10,23 However, the optimal timing and/or thresholds to trigger the adaptation and clinical benefit remains to be addressed. The patient-specific CTN change in the GTV observed in this study may be related to the radiation response of individual patients, as the doses to the GTVs were similar (approximately 70 Gy) for all the patients studied. The mechanism behind this CTN change is largely unknown. It has been reported that the pre-treatment tumour blood flow and capillary permeability in patients who achieved locoregional control were significantly higher than in those with treatment failure24 and that low perfusion of head and neck cancer was associated with higher rates of local failure of RT.25 Tumours that demonstrated CTN reduction may represent regions of improved oxygenation and sensitivity to radiation-induced damages.24–26 The mechanisms of underlying radiation-induced CTN change in the parotid glands remain even more unclear. Heo et al27 found that both age and obesity are closely correlated with the size and CTN of the major salivary glands. Factors such as the damage of secretory cells and lack of regeneration of the acinar cells with radiation dose may contribute to the CTN change of parotid glands.27–29 The number of cases considered in this exploratory study is too small to truthfully investigate the correlation between CTN changes and local control or treatment-related toxicity data. If the hypothesis that CTN change can measure the radiation response is verified and the mechanism behind is uncovered, then CTN change would potentially be used as an alternative or complimentary indicator, to trigger the adaptation in addition to or replacing the dosimetric indicators currently used in ART for head and neck cancer.
A drawback of this study is the use of low soft-tissue contrast in daily MVCTs, which inevitably introduced variations/errors in structure delineation. To reduce the variations, all contours on daily MVCT were generated by first populating the contours from the planning CTs and then manually editing by a single observer, if necessary. Of course, high-dose imaging, deionized and texture-enhanced MVCT would be made possible to improve the soft-tissue contrast.30,31 The delineation errors should not significantly affect the observed results, as only the relative and CTNmean change in a structure is of interest here.
In order to verify that the CTN change observed was not contributed by the daily variation of the MVCT imaging, we investigated the stability of the MVCT image quality over a period of time for the tomotherapy unit used in this study. The MVCTs for the “Cheese” phantom (TomoTherapy, Accuray) and CIRS phantom® Model 062 (CIRS Inc., Norfolk, VA) with a series of plugs of different materials with known electron densities were acquired weekly for a year using the same clinical imaging protocol. The CTNs in these phantom MVCTs were checked. It was noted that there was no noticeable change in CTNs for all densities in the phantoms, implying that there was no variation in MVCT imaging that contributed to the CTN changes observed in the patients with NPC. Similar results were also reported previously.32–34
Very recently, Feng et al35 observed similar CTN changes in patients with various types of head and neck cancers based on diagnostic-quality CTs acquired during the course of RT delivery using an in-room CT (e.g. CT on rails). With diagnostic-quality CT, the delineation uncertainty and CTN measurement error should be small. This study, based on MVCT, confirms that the CTN change can be induced during RT for NPC and is a function of the radiation dose delivered.
CONCLUSION
We observed and quantified CTN changes in the GTV and parotid glands during the fractionated RT for NPC. A decrease by 52 HU in the CTNmean in GTV was detected during the RT course. For the GTVs, CTN changes were found to be correlated with relative volume reductions, while no such correlation was identified in the parotid glands. This radiation-induced CTN change was highly patient specific and thus may be used as an indicator to trigger the ART for head and neck cancer.
FUNDING
This work was supported in part by the grant from the Chinese Natural Science Foundation (Grant No. 11105225).
Contributor Information
Shouping Xu, Email: shouping_xu@yahoo.com.
Zhaoxia Wu, Email: shouping_xu@yahoo.com.
Cungeng Yang, Email: cuyang@mcw.edu.
Lin Ma, Email: shouping_xu@yahoo.com.
Baolin Qu, Email: shouping_xu@yahoo.com.
Guangpei Chen, Email: gpchen@mcw.edu.
Weirong Yao, Email: shouping_xu@yahoo.com.
Shi Wang, Email: shouping_xu@yahoo.com.
Yaqiang Liu, Email: shouping_xu@yahoo.com.
X Allen Li, Email: ali@mcw.edu.
REFERENCES
- 1.Lee C, Langen KM, Lu W, Haimerl J, Schnarr E, Ruchala KJ, et al. Evaluation of geometric changes of parotid glands during head and neck cancer radiotherapy using daily MVCT and automatic deformable registration. Radiother Oncol 2008; 89: 81–8. doi: 10.1016/j.radonc.2008.07.006 [DOI] [PubMed] [Google Scholar]
- 2.Castadot P, Geets X, Lee JA, Christian N, Grégoire V. Assessment by a deformable registration method of the volumetric and positional changes of target volumes and organs at risk in pharyngo-laryngeal tumors treated with concomitant chemo-radiation. Radiother Oncol 2010; 95: 209–17. doi: 10.1016/j.radonc.2010.03.007 [DOI] [PubMed] [Google Scholar]
- 3.Barker JL, Jr, Garden AS, Ang KK, O'Daniel JC, Wang H, Court LE, et al. Quantification of volumetric and geometric changes occurring during fractionated radiotherapy for head-and-neck cancer using an integrated CT/linear accelerator system. Int J Radiat Oncol Biol Phys 2004; 59: 960–70. doi: 10.1016/j.ijrobp.2003.12.024 [DOI] [PubMed] [Google Scholar]
- 4.Castadot P, Lee JA, Geets X, Grégoire V. Adaptive radiotherapy of head and neck cancer. Semin Radiat Oncol 2010; 20: 84–93. doi: 10.1016/j.semradonc.2009.11.002 [DOI] [PubMed] [Google Scholar]
- 5.Geets X, Tomsej M, Lee JA, Duprez T, Coche E, Cosnard G, et al. Adaptive biological image-guided IMRT with anatomic and functional imaging in pharyngo-laryngeal tumors: Impact on target volume delineation and dose distribution using helical tomotherapy. Radiother Oncol 2007; 85: 105–15. doi: 10.1016/j.radonc.2007.05.010 [DOI] [PubMed] [Google Scholar]
- 6.Castadot P, Geets X, Lee JA, Grégoire V. Adaptive functional image-guided IMRT in pharyngo-laryngeal squamous cell carcinoma: is the gain in dose distribution worth the effort? Radiother Oncol 2011; 101: 343–50. doi: 10.1016/j.radonc.2011.06.011 [DOI] [PubMed] [Google Scholar]
- 7.Wu Q, Chi Y, Chen PY, Krauss DJ, Yan D, Martinez A. Adaptive replanning strategies accounting for shrinkage in head and neck IMRT. Int J Radiat Oncol Biol Phys 2009; 75: 924–32. doi: 10.1016/j.ijrobp.2009.04.047 [DOI] [PubMed] [Google Scholar]
- 8.Schwartz DL, Garden AS, Shah SJ, Chronowski G, Sejpal S, Rosenthal DI, et al. Adaptive radiotherapy for head and neck cancer—dosimetric results from a prospective clinical trial. Radiother Oncol 2013; 106: 80–4. doi: 10.1016/j.radonc.2012.10.010 [DOI] [PubMed] [Google Scholar]
- 9.Schwartz DL, Dong L. Adaptive radiation therapy for head and neck cancer—can an old goal evolve into a new standard? J Oncol 2011; 2011: 690595. doi: 10.1155/2011/690595 [DOI] [PMC free article] [PubMed] [Google Scholar]
- 10.Grégoire V, Jeraj R, Lee JA, O'Sullivan B. Radiotherapy for head and neck tumours in 2012 and beyond: conformal, tailored, and adaptive? Lancet Oncol 2012; 13: e292–300. doi: 10.1016/S1470-2045(12)70237-1 [DOI] [PMC free article] [PubMed] [Google Scholar]
- 11.Han C, Chen YJ, Liu A, Schultheiss TE, Wong JY. Actual dose variation of parotid glands and spinal cord for nasopharyngeal cancer patients during radiotherapy. Int J Radiat Oncol Biol Phys 2008; 70: 1256–62. doi: 10.1016/j.ijrobp.2007.10.067 [DOI] [PubMed] [Google Scholar]
- 12.Hansen EK, Bucci MK, Quivey JM, Weinberg V, Xia P. Repeat CT imaging and replanning during the course of IMRT for head-and-neck cancer. Int J Radiat Oncol Biol Phys 2006; 64: 355–62. doi: 10.1016/j.ijrobp.2005.07.957 [DOI] [PubMed] [Google Scholar]
- 13.Robar JL, Day A, Clancey J, Kelly R, Yewondwossen M, Hollenhorst H, et al. Spatial and dosimetric variability of organs at risk in head-and-neck intensity-modulated radiotherapy. Int J Radiat Oncol Biol Phys 2007; 68: 1121–30. doi: 10.1016/j.ijrobp.2007.01.030 [DOI] [PubMed] [Google Scholar]
- 14.Diot Q, Kavanagh B, Schefter T, Gaspar L, Stuhr K, Miften M. Regional normal lung tissue density changes in patients treated with stereotactic body radiation therapy for lung tumors. Int J Radiat Oncol Biol Phys 2012; 84: 1024–30. doi: 10.1016/j.ijrobp.2011.11.080 [DOI] [PubMed] [Google Scholar]
- 15.Howells CC, Stinauer MA, Diot Q, Westerly DC, Schefter TE, Kavanagh BD, et al. Normal liver tissue density dose response in patients treated with stereotactic body radiation therapy for liver metastases. Int J Radiat Oncol Biol Phys 2012; 84: e441–6. doi: 10.1016/j.ijrobp.2012.04.041 [DOI] [PubMed] [Google Scholar]
- 16.Palma DA, van Sörnsen de Koste J, Verbakel WF, Vincent A, Senan S. Lung density changes after stereotactic radiotherapy: a quantitative analysis in 50 patients. Int J Radiat Oncol Biol Phys 2011; 81: 974–8. doi: 10.1016/j.ijrobp.2010.07.025 [DOI] [PubMed] [Google Scholar]
- 17.Saito S, Murase K. Detection and early phase assessment of radiation-induced lung injury in mice using micro-CT. PLoS One 2012; 7: e45960. doi: 10.1371/journal.pone.0045960 [DOI] [PMC free article] [PubMed] [Google Scholar]
- 18.Guckenberger M, Heilman K, Wulf J, Mueller G, Beckmann G, Flentje M. Pulmonary injury and tumor response after stereotactic body radiotherapy (SBRT): results of a serial follow-up CT study. Radiother Oncol 2007; 85: 435–42. doi: 10.1016/j.radonc.2007.10.044 [DOI] [PubMed] [Google Scholar]
- 19.Scalco E, Fiorino C, Cattaneo GM, Sanguineti G, Rizzo G. Texture analysis for the assessment of structural changes in parotid glands induced by radiotherapy. Radiother Oncol 2013; 109: 384–7. doi: 10.1016/j.radonc.2013.09.019 [DOI] [PubMed] [Google Scholar]
- 20.Ahunbay EE, Peng C, Godley A, Schultz C, Li XA. An on-line replanning method for head and neck adaptive radiotherapy. Med Phys 2009; 36: 4776–90. doi: 10.1118/1.3215532 [DOI] [PubMed] [Google Scholar]
- 21.Thorwarth D, Eschmann SM, Paulsen F, Alber M. Hypoxia dose painting by numbers: a planning study. Int J Radiat Oncol Biol Phys 2007; 68: 291–300. doi: 10.1016/j.ijrobp.2006.11.061 [DOI] [PubMed] [Google Scholar]
- 22.Cheng HC, Wu VW, Ngan RK, Tang KW, Chan CC, Wong KH, et al. A prospective study on volumetric and dosimetric changes during intensity-modulated radiotherapy for nasopharyngeal carcinoma patients. Radiother Oncol 2012; 104: 317–23. doi: 10.1016/j.radonc.2012.03.013 [DOI] [PubMed] [Google Scholar]
- 23.Yan D, Liang J. Expected treatment dose construction and adaptive inverse planning optimization: implementation for offline head and neck cancer adaptive radiotherapy. Med Phys 2013; 40: 021719. doi: 10.1118/1.4788659 [DOI] [PubMed] [Google Scholar]
- 24.Truong MT, Saito N, Ozonoff A, Wang J, Lee R, Qureshi MM, et al. Prediction of locoregional control in head and neck squamous cell carcinoma with serial CT perfusion during radiotherapy. AJNR Am J Neuroradiol 2011; 32: 1195–201. doi: 10.3174/ajnr.A2501 [DOI] [PMC free article] [PubMed] [Google Scholar]
- 25.Cao Y, Popovtzer A, Li D, Chepeha DB, Moyer JS, Prince ME, et al. Early prediction of outcome in advanced head-and-neck cancer based on tumor blood volume alterations during therapy: a prospective study. Int J Radiat Oncol Biol Phys 2008; 72: 1287–90. doi: 10.1016/j.ijrobp.2008.08.024 [DOI] [PMC free article] [PubMed] [Google Scholar]
- 26.Chikui T, Kitamoto E, Kawano S, Sugiura T, Obara M, Simonetti AW, et al. Pharmacokinetic analysis based on dynamic contrast-enhanced MRI for evaluating tumor response to preoperative therapy for oral cancer. J Magn Reson Imaging 2012; 36: 589–97. doi: 10.1002/jmri.23704 [DOI] [PubMed] [Google Scholar]
- 27.Heo MS, Lee SC, Lee SS, Choi HM, Choi SC, Park TW. Quantitative analysis of normal major salivary glands using computed tomography. Oral Surg Oral Med Oral Pathol Oral Radiol Endod 2001; 92: 240–4. doi: 10.1067/moe.2001.114756 [DOI] [PubMed] [Google Scholar]
- 28.Konings AW, Coppes RP, Vissink A. On the mechanism of salivary gland radiosensitivity. Int J Radiat Oncol Biol Phys 2005; 62: 1187–92. doi: 10.1016/j.ijrobp.2004.12.051 [DOI] [PubMed] [Google Scholar]
- 29.Stephens LC, Ang KK, Schultheiss TE, King GK, Brock WA, Peters LJ. Target cell and mode of radiation injury in rhesus salivary glands. Radiother Oncol 1986; 7: 165–74. doi: 10.1016/S0167-8140(86)80096-2 [DOI] [PubMed] [Google Scholar]
- 30.Westerly DC, Schefter TE, Kavanagh BD, Chao E, Lucas D, Flynn RT, et al. High-dose MVCT image guidance for stereotactic body radiation therapy. Med Phys 2012; 39: 4812–19. doi: 10.1118/1.4736416 [DOI] [PubMed] [Google Scholar]
- 31.Sheng K, Gou S, Wu J, Qi SX. Denoised and texture enhanced MVCT to improve soft tissue conspicuity. Med Phys 2014; 41: 101916. doi: 10.1118/1.4894714 [DOI] [PubMed] [Google Scholar]
- 32.Yadav P, Tolakanahalli R, Rong Y, Paliwal BR. The effect and stability of MVCT images on adaptive TomoTherapy. J Appl Clin Med Phys 2010; 11: 3229. doi: 10.1120/jacmp.v11i4.3229 [DOI] [PMC free article] [PubMed] [Google Scholar]
- 33.Pukala J, Meeks SL, Bova FJ, Langen KM. The effect of temporal HU variations on the uncertainty of dose recalculations performed on MVCT images. Phys Med Biol 2011; 56: 7829–41. doi: 10.1088/0031-9155/56/24/010 [DOI] [PubMed] [Google Scholar]
- 34.Xu S, Wang S, Wu Z, Xie C, Dai X, Xia T, et al. Reliability and stability assessment of megavoltage CT (MVCT) images for dose calculation. IFBME Proceeding. Vol 39. Berlin, Heidelburg, Germany: Springer; 2013. pp. 1176–79. doi: 10.1007/978-3-642-29305-4_308 [DOI] [Google Scholar]
- 35.Feng M, Yang C, Chen X, Xu S, Moraru I, Lang J, et al. Computed tomography number changes observed during computed tomography-guided radiation therapy for head and neck cancer. Int J Radiat Oncol Biol Phys 2015; 91: 1041–7. doi: 10.1016/j.ijrobp.2014.12.057 [DOI] [PubMed] [Google Scholar]


