Abstract
Adrenocortical adenoma is the most common adrenal tumour. This lesion is frequently encountered on cross-sectional imaging that has been performed for unrelated reasons. Adrenal adenoma manifests various imaging features on CT, MRI and positron emission tomography/CT. The learning objectives of this review are to describe the imaging findings of adrenocortical adenoma, to compare the sensitivities of different imaging modalities for adenoma characterization and to introduce differential diagnoses.
INTRODUCTION
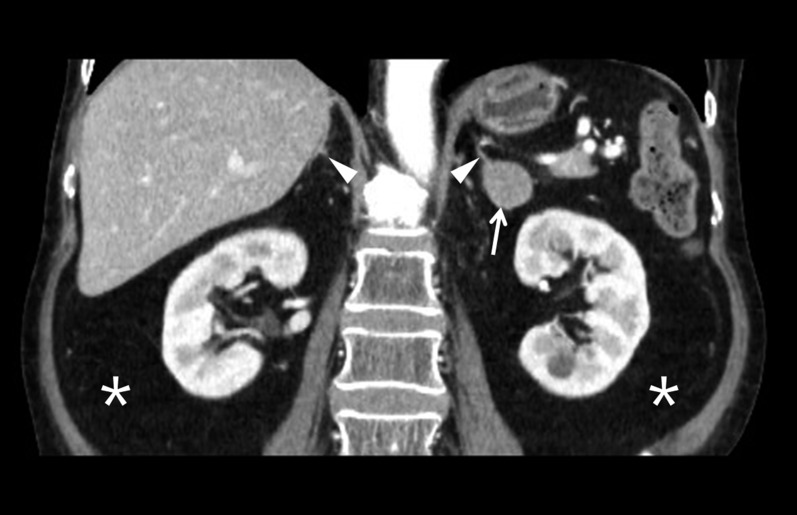
Adrenocortical adenoma is the most common adrenal tumour both in patients having a history of extra-adrenal malignancy and in patients who do not have such a history.1 Because the majority of adenomas are non-functioning, most of these lesions are detected incidentally on routine imaging that has been performed for unrelated reasons.2 The prevalence of adrenal adenoma is reported to be related to age; the frequency of unsuspected adenoma is 0.14% in patients aged 20–29 years and 7% in those older than 70 years.1 Although CT does not allow functioning adenomas to be differentiated from non-functioning adenomas, the presence of ipsilateral or contralateral adrenocortical atrophy is strongly suggestive of a functioning adenoma that has resulted in Cushing’s syndrome (Figure 1). The adrenal cortical thinning is secondary to excessive production of cortisol, suppressing pituitary adrenocorticotropic hormone secretion.3
Figure 1.
A 58-year-old female with Cushing’s syndrome. Contrast-enhanced coronal CT image showing a left adrenal adenoma (arrow). Adrenocortical atrophy (arrowhead) is seen owing to excessive production of cortisol. The asterisks show a huge amount of fat, resulting from Cushing’s syndrome, the so-called adrenal Cushing’s.
Adrenal imaging has helped radiologists and clinicians to differentiate adenomas from non-adenomas in patients with an incidental adrenal mass. Because almost all adenomas can be characterized using imaging alone, the number of adrenal mass biopsies has been reduced dramatically.4 Subsequent advancements in adrenal imaging have led to reduced costs or morbidity from adrenal biopsies and surgeries. For cases with imaging features that are suggestive of adrenal adenoma, the lesion is simply followed with cross-sectional imaging to determine if there has been any change in size. However, recent investigations have revealed that the true accuracy of imaging modalities for adenoma characterization is lower than has been reported previously because of many false-positive and false-negative lesions.5–12 Therefore, the diagnostic accuracy of imaging modalities should be re-evaluated in order to plan management strategies.
The learning objectives of this review were to describe the imaging findings of adrenocortical adenoma, to compare the sensitivities of imaging modalities for adenoma characterization and to introduce differential diagnoses.
Unenhanced CT
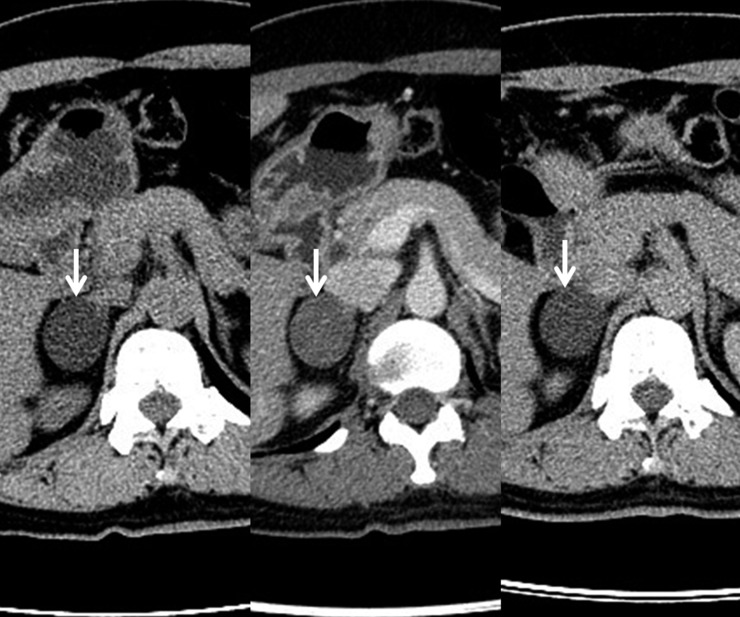
Unenhanced CT (UCT) is a useful imaging modality for characterizing lipid-rich adenomas which measure 10 HU or less (Table 1) (Figure 2). Using a threshold of 10 HU on UCT, the sensitivity and specificity for adenoma characterization are 71% and 98%, respectively.13 Histologically, adrenal adenoma contains abundant lipid in the cytoplasm, which appears relatively large and pale in comparison with the nucleus. This intracytoplasmic lipid leads to a decreased CT attenuation value in the adenoma;14 specifically, on UCT, an increase in the amount of intracytoplasmic lipid is associated with a decrease in the lesion attenuation value. The administration of a iodine contrast material is not necessary, as a result of a high specificity (98%)13 when an adrenal mass is measured 10 HU or less. However, washout CT should be performed if a lesion has hyperdense foci (>10 HU), excepting pure calcification or haemorrhage even when the other region measures 10 HU or less on UCT. Coexisting non-adenoma may be detected if a lesion is heterogeneous on UCT.9,15,16
Table 1.
Qualitative and quantitative features for adenoma characterization
| Imaging modalities | Imaging features for adenoma characterization |
|
|---|---|---|
| Qualitative | Quantitative | |
| 120-kVp UCT | Hypodense mass | ≤10 HU |
| UCT histogram | NA | >10% negative pixel |
| Dual-energy UCT | Reduced attenuation at low-kVp UCT | NA |
| Dual-energy virtual UCT | Hypodense mass | ≤10 HU |
| CSI | Signal drop at opposed phase | ASR < 0.71 and SII > 16.5% |
| DWI | Slightly hyperintense signal intensity | Higher ADC values than cortical carcinoma |
| DCI | Early wash in and washout | NA |
| Washout CT (adrenal protocol CT) | Early wash in and washout | APW ≥ 50% (10-min DCT) |
| APW ≥ 60% (15-min DCT) | ||
| RPW ≥ 40% (both DCTs) | ||
| Multiphase CT other than adrenal protocol CT | Early wash in and washout | RPW ≥ 40% |
| FDG PET/CT | Iso and low FDG uptake compared with liver | NA |
ADC, apparent diffusion coefficient; APW, absolute percentage washout; ASR, adrenal-to-spleen ratio; CSI, chemical-shift imaging; DCI, dynamic contrast-enhanced imaging; DCT, delayed enhanced CT; DWI, diffusion-weighted imaging; FDG, fludeoxyglucose; NA, not applicable; PET, positron emission tomography; RPW, relative percentage washout; SII, signal intensity index; UCT, unenhanced CT.
Figure 2.
A 44-year-old female with a lipid-rich adenoma. A right adrenal adenoma (arrow) measuring −16 HU on unenhanced (left sided) CT image. The lesion measures 42 HU and −4.5 HU on 1-min (middle) and 15-min (right sided) CT images after injection of the contrast material. The absolute and relative percentage washouts are calculated as 79% and 110%, respectively.
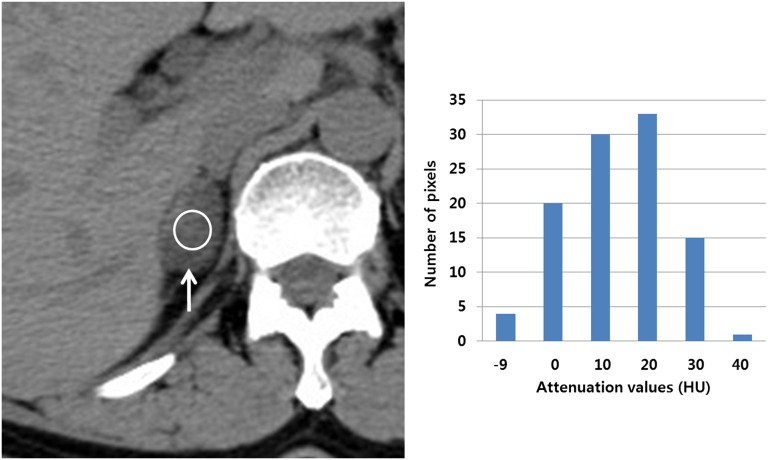
Analyses of the UCT histogram can provide a higher sensitivity than lesion attenuation measurement on UCT (Figure 3). Several investigations have shown that a threshold of >10% negative pixel presence achieves 84–91% sensitivity and 100% specificity for adenoma characterization17–19 (Table 1). Although histogram analysis requires additional time and labour, it is useful for the evaluation of adrenal masses in patients who have decreased renal function or hypersensitivity to iodine contrast materials. No washout CT or histological confirmation is necessary, but follow-up imaging is sufficient to manage an adrenal mass in these patients, if the lesion is diagnosed as adenoma with UCT histogram analysis.
Figure 3.
Histogram analysis in a 48-year-old female with a lipid-poor adenoma. Unenhanced CT (UCT) image showing a right adrenal mass (arrow) in which a region of interest (ROI) (circle) is present measuring 15.1 HU. The lesion is not consistent with the adenoma on UCT. Bar graph showing that the lesion contains approximately 23% negative pixels within the ROI. The following pixel statistics include the total pixel count, 103; pixel range, −9 to 40 HU; average, 15.1 HU; and standard deviation, 10.5 HU. However, the lesion does not contain any negative pixels on contrast-enhanced CT images (not shown). Therefore, UCT histogram analysis alone can characterize the adenoma without the necessity of washout CT scans.
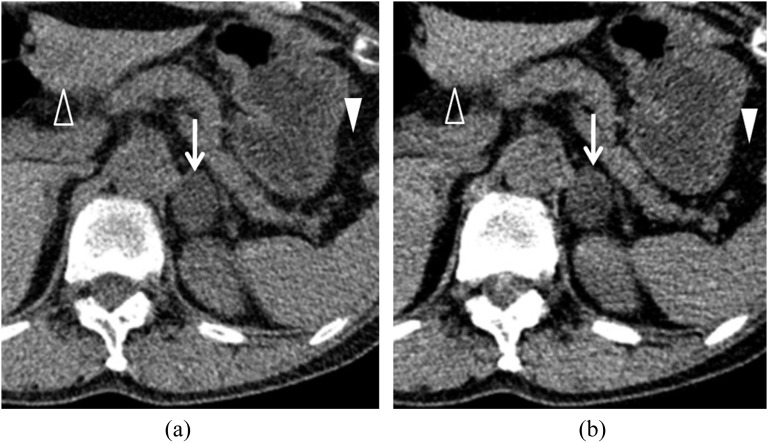
Dual-energy CT using low peak kilovoltage (kVp) and high kVp can be used to obtain two kinds of UCT scans: one that is true and another that is virtual. For true dual-energy UCT, lesion attenuation values decrease in 50% of adenomas on 80-kVp UCT, as compared with those on 140-kVp UCT20 (Figure 4) (Table 1). In contrast, lesion attenuation values increase in all non-adenomas on 80-kVp UCT, as compared with those on 140-kVp UCT. However, the sensitivity of dual-energy true UCT is only 50%, while that of 120-kVp UCT is 71%. Therefore, dual-energy true UCT is inferior to 120-kVp UCT in terms of adenoma characterization.13,20
Figure 4.
Dual-energy unenhanced CT (UCT) in a 66-year-old female with an adenoma. (a) Unenhanced 140-kVp CT image showing a left adrenal mass (arrow) that is measuring 11 HU. A solid arrowhead indicates the fat tissue within the gastrosplenic ligament. An open arrowhead indicates left hepatic parenchyma. (b) Unenhanced 80-kVp CT image showing that the lesion (arrow) attenuation value has decreased to −7 HU. The gastrosplenic fat attenuation (solid arrowhead) is decreasing, while the left hepatic parenchyma (open arrowhead) attenuation is increasing.
Dual-energy UCT also can be obtained from the raw data of contrast-enhanced CT by means of the iodine-subtraction technique.21 Theoretically, contrast-enhanced dual-energy CT does not require true UCT, because it is possible to obtain virtual UCT images22 (Figure 5). Additional radiation exposure and medical cost can be avoided in patients with adrenal gland masses, when true UCT is not performed. However, virtual UCT (39–61%) is inferior to 120-kVp UCT (71%) in terms of its sensitivity for adenoma characterization, with a threshold of 10 HU or less.23 Virtual UCT may miss a substantial number of lipid-rich adenomas that could be diagnosed on 120-kVp UCT. As compared with virtual UCT that has been created from early, enhanced dual-energy CT, virtual UCT that has been created from delayed enhanced dual-energy CT provides higher sensitivity for the characterization of lipid-rich adenoma.23
Figure 5.
Virtual unenhanced CT (UCT) in a 59-year-old male with a lipid-rich adenoma. Portal-phase dual-energy CT image (left sided) showing that a left adrenal mass (arrow) is present measuring 72 HU. Virtual UCT image (right side) from the raw data of the dual-energy CT image showing that the lesion (arrow) is measuring 6 HU.
Because of these differences, dual-energy CT at low kVp and high kVp may lead to different attenuation measurements and other results, as does virtual UCT. Similarly, a new potential problem is presented by the use of recent radiation dose-modulation software, based on changes in the kVp. For the same reasons that have been mentioned previously, such software should not be used when it is necessary to rely on attenuation measurements.
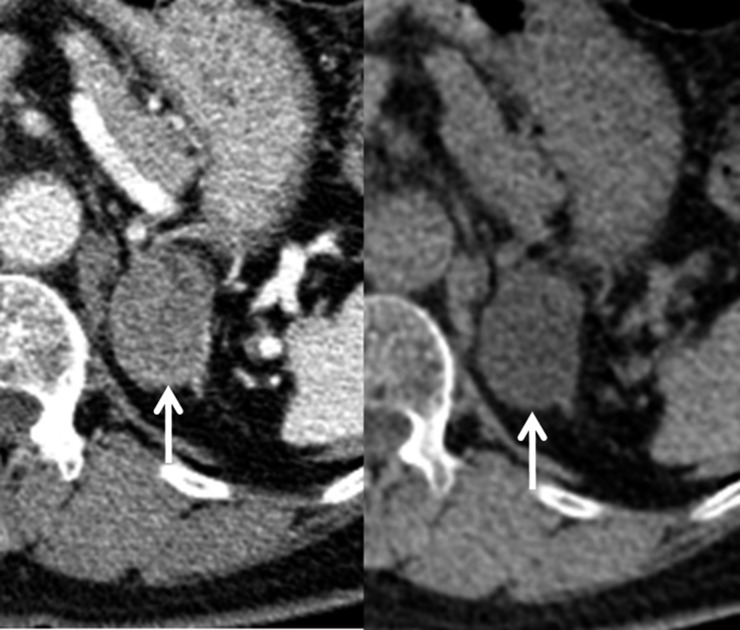
Several reports have described on adenoma-mimicking false-positive lesions that measure 10 HU or less on UCT.5,9,11,15,16,24 These lesions include adrenal hyperplasia,5,11 adenoma with coexisting non-adenoma9,15,16 and pheochromocytoma.24 In resemblance with adrenal adenoma, adrenal hyperplasia is composed of abundant lipid-rich adrenocortical cells.25 This histological finding may lead to a decreased attenuation value of adrenal hyperplasia on UCT11 (Figure 6). Accordingly, nodular hyperplasia and multiple adenomas frequently pose dilemmas to radiologists, clinicians or pathologists when imaging diagnosis, treatment planning or histologic diagnosis are determined. Malignant tumours may metastasize to pre-existing adrenal adenomas.9,15,16 On UCT, an adenoma region appears hypodense, while a metastatic region appears hyperdense. Therefore, when a value of >10 HU is measured for one region and another region is consistent with a lipid-rich adenoma, additional examinations are still necessary to completely exclude the possibility of metastasis in oncologic patients. Such imaging examinations include washout CT, positron emission tomography/CT (PET/CT) or follow-up imaging.9,15,16
Figure 6.
Macronodular hyperplasia a 49-year-old male with hyperplasia. (a) Left adrenal hyperplasia (arrow) is present measuring 8 HU on unenhanced (left sided) CT image. The lesion (arrow) is measuring 95 HU and 29 HU on 1-min (middle) and 15-min (right sided) CT images after the injection of the contrast material, respectively. The absolute and relative percentage washouts are calculated as 76% and 69%, respectively. (b) In-phase MR image (left sided) showing that left macronodular hyperplasia (arrow) is as hyperintense as the spleen (asterisk). In contrast, opposed-phase MR image (right sided) showing that the lesion (arrow) is hypointense compared with the spleen (asterisk). Adrenal-to-spleen ratio and signal intensity index are calculated as 0.25 and 50%, respectively.
MRI
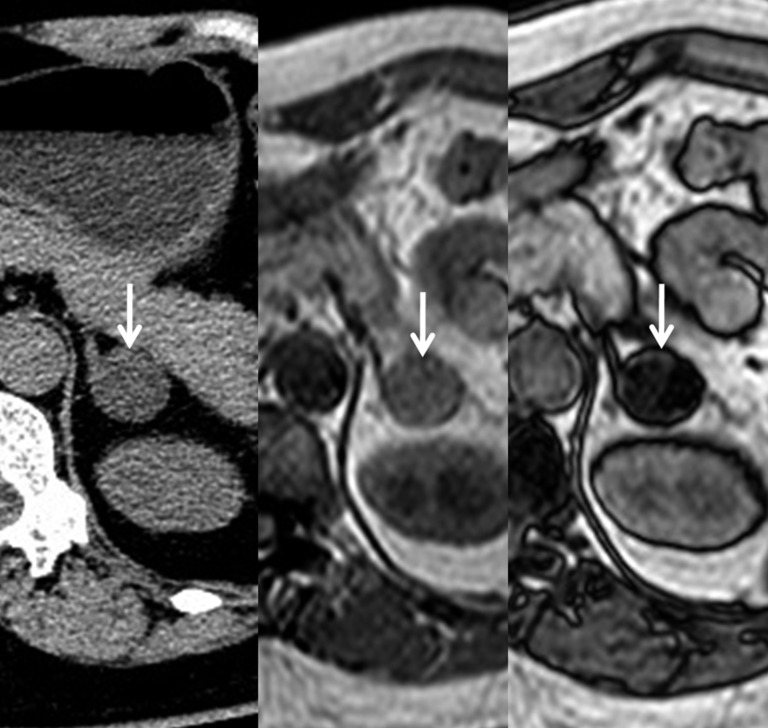
Chemical-shift imaging (CSI) is an excellent MRI sequence for characterizing adenomas with abundant intracytoplasmic lipid.14 Many adenomas are hyperintense on in-phase imaging and hypointense on oppose-phase imaging because of the frequency difference between lipid and water.26 Many lipid-rich adenomas can be characterized on CSI by visual assessment alone27,28 (Figure 7). However, quantitative assessment is more accurate than visual assessment for characterizing adenomas which measure >10 HU on UCT29 (Figure 8). Therefore, CSI is superior to UCT for adenoma characterization. Reportedly, the use of CSI with a threshold of 20% for the signal intensity index (SII) results in a higher sensitivity than is provided by a CT histogram analysis.30 However, more investigation is necessary to compare these two modalities for adenoma characterization.
Figure 7.
Chemical-shift imaging in a 57-year-old female with a lipid-rich adenoma. Unenhanced CT image (left sided) showing a right adrenal mass (arrow) which is measuring 5 HU, suggesting a lipid-rich adenoma. In-phase MR image (middle) showing that the lesion (arrow) is homogeneously hyperintense and the opposed-phase MR image (right side) is showing that it (arrow) is homogeneously hypointense, also suggesting a lipid-rich adenoma. These MR findings do not require quantitative analysis but visual assessment alone.
Figure 8.
A 43-year-old male with a lipid-poor adenoma. (a) Unenhanced (left side) CT image showing that a right adrenal mass (arrow) is present measuring 14 HU. The lesion (arrow) is measuring 63 HU and 19 HU on 1-min (middle) and 15-min (right side) contrast-enhanced CT images after the injection of the contrast material, respectively. The absolute and relative percentage washouts are calculated as 89% and 69%, respectively. These findings are consistent with a lipid-poor adenoma. (b) The right adrenal mass (arrow) is slightly hyperintense on the in-phase MR image (left side), while the lesion (arrow) contains hypointense foci on the opposed-phase MR image (right side). Adrenal-to-spleen ratio is calculated as 0.68, suggesting an adenoma.
The adrenal-to-spleen ratio (ASR) and SII are commonly used as quantitative MR parameters.31–34 ASR is calculated as (SIOP of adrenal mass/SIOP of spleen)/(SIIP of adrenal mass/SIIP of spleen). SII is calculated as (SIIP of adrenal mass − SIOP of adrenal mass) × 100/SIIP of adrenal mass. SIOP and SIIP indicate the signal intensity on the opposed-phase image and in-phase image, respectively. For the diagnosis of adenoma, ASR is <0.71 or SII is >16.5%7,35–37 (Table 1). SII is more accurate than ASR for adenoma characterization.7,37 CSI sensitivity for adenoma is as high as 100%, if the lesion attenuation value is 20 HU or less on UCT.37 Therefore, when attenuation values between 10 and 20 HU are obtained for an adrenal adenoma, CSI alone can correctly characterize the lesion without relying on washout CT. CSI is very helpful for detecting adenoma in patients with decreased renal function. However, the sensitivity decreases, if the adenoma measures >20 HU on UCT.37 Therefore, CSI is inferior to washout CT in characterizing lipid-poor adenoma.7,36,37
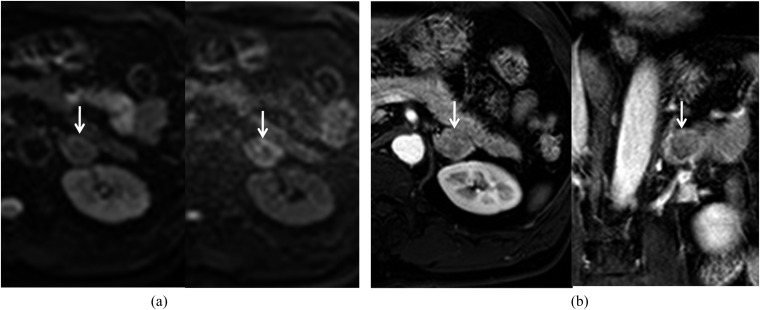
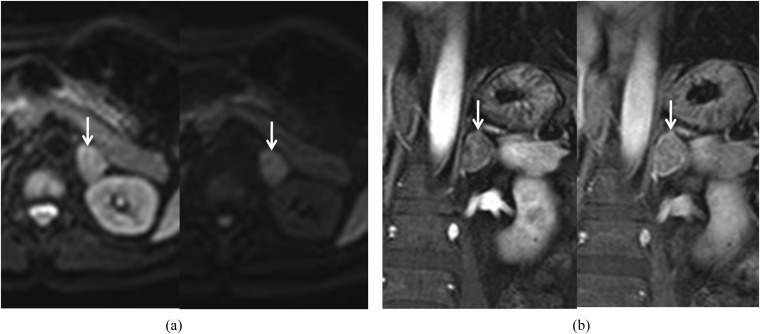
Diffusion-weighted imaging (DWI) has been used in the evaluation of various abdominal lesions. This MR technique can depict malignant lesions with high tissue contrast against a generally suppressed background signal (Figures 9 and 10). Lesion characterization is based on diffusion effects using apparent diffusion coefficient (ADC) measurements, which are employed to assess the mobility of water molecules.38 Generally, ADC values are lower for malignant lesions than for benign lesions because increased cellularity leads to diffusion restriction (Table 1). However, DWI is not useful for differentiating adenoma and non-adenoma because there is a significant overlap between these two lesions in terms of ADC values.39–41 Therefore, CSI is superior to DWI in the characterization of adenoma.
Figure 9.
Diffusion-weighted and dynamic contrast-enhanced images in a 60-year-old male with an adenoma. (a) Diffusion-weighted images (left side for b = 0 s mm−2 and right side for b = 800 s mm−2) showing that a left adrenal mass (arrow) is mixed with high and low signal intensities. (b) Early contrast-enhanced axial image (left side) showing that the lesion (arrow) is homogeneously enhanced, while the delayed contrast-enhanced coronal image (right side) is showing that the lesion's (arrow) signal intensity is decreasing.
Figure 10.
Diffusion-weighted and dynamic contrast-enhanced images in a 59-year-old male with adrenocortical carcinoma. (a) Diffusion-weighted images (left side for b = 0 s mm−2 and right side for b = 800 s mm−2) showing that a left adrenal mass (arrow) is homogeneously hyperintense owing to diffusion restriction. (b) Early contrast-enhanced coronal image (left side) showing that the lesion (arrow) is mildly enhanced, while the delayed contrast-enhanced coronal image (right side) is demonstrating the persistent enhancement of the lesion (arrow).
Dynamic contrast-enhanced imaging (DCI) is a useful modality for differentiating adenoma from malignant lesions42–44 (Table 1). Most adenomas show early homogeneous enhancement on the arterial phase and early washout on the venous phase42–44 (Figure 9). In contrast, most malignant lesions show poor enhancement on the arterial phase and heterogeneous or peripheral enhancement on the venous phase42–44 (Figure 10). Although DCI alone is not more sensitive than CSI for the characterization of adenoma, it is useful for diagnosing adenoma which is not characterized by CSI.43,44 However, the use of DCI in patients with impaired renal function is limited by nephrogenic systemic fibrosis.
MR spectroscopy (MRS) reportedly has the potential to differentiate adenoma from non-adenoma based on the analysis of the choline-to-creatinine ratio.45 However, MRS is not performed widely because its spectral quality is insufficient to draw reliable conclusions.46 Moreover, MRS scan and post-processing are time consuming.
Great care should be taken when evaluating adrenal masses using CSI because of the potential presence of lipid- or fat-containing non-adenomas such as hyperplasia35 (Figure 6), small adrenocortical carcinoma,10 metastasis to lipid-rich adenoma,9 metastatic lesions from renal-cell carcinoma,47 hepatocellular carcinoma and liposarcoma. Lipid-poor adenoma may present diffusion restriction, as if it were a malignant non-adenoma.41 Small hypervascular non-adenoma may show early wash in and washout of contrast-material on DCI.43,44
Washout CT
Another characteristic CT finding of adrenal adenoma is the early wash in and washout of the contrast material48–51 (Figures 2 and 8). Therefore, two-phase (early and delayed) contrast-enhanced CT scans are required to characterize an adenoma which measures >10 HU on UCT (Figure 8). Early contrast-enhanced CT (ECT) scanning is performed 60 s after the administration of the contrast material, and delayed contrast-enhanced CT (DCT) scanning is performed 10 min48 or 15 min49–51 after the administration of the contrast material. Absolute percentage washout (APW) and relative percentage washout (RPW) are calculated using lesion attenuation values on UCT, ECT and DCT as follows: APW = [ECT (HU) − DCT (HU)] × 100/[ECT (HU) − UCT (HU)]. RPW = [ECT (HU) − DCT (HU)] × 100/ECT (HU).49 The thresholds of APW and RPW for an adenoma are 60% and 40%, respectively, for 15-min DCT49,51 and 50% and 40% for 10-min DCT, respectively (Table 1).35 RPW is more accurate than APW, and 15-min DCT is more accurate than 10-min DCT for diagnosing an adrenal adenoma. When an adenoma has a measured value of less than 0 HU on UCT images, RPW is higher than APW (Figure 2). The attenuation value of an adenoma becomes lower on UCT and the APW also decreases. Therefore, it is not uncommon for APW to be below 60% in lipid-rich adenoma.
The CT sensitivity for adenoma may vary according to the lesion size. As adenoma size increases, lesion heterogeneity may also increase.12 When a lesion size measures <3 cm, almost all adenomas can be confidently diagnosed using adrenal CT protocols. However, when a lesion size measures 3 cm or larger, CT sensitivity decreases so markedly that a substantial number of large adenomas cannot be differentiated from adenocarcinomas.10
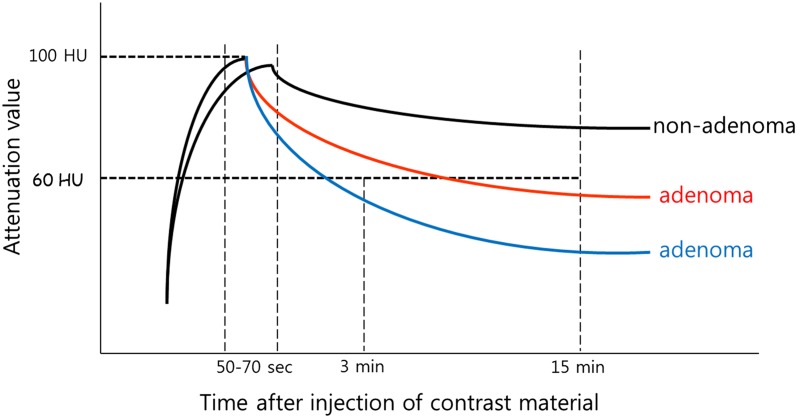
Multiphasic contrast-enhanced CT scans are frequently performed to evaluate hepatic, biliary and pancreatic tumours. Thus, RPW can be calculated using two lesion attenuation values that are obtained from any two contrast-enhanced CT scans52 (Table 1). Some adenomas can show earlier washout of the contrast material than is seen for typical adenomas, and these lesions do not require a 10-min or 15-min DCT scan (Figure 11). As a result, when the calculated RPW is >40% on multiphase CT scans, additional adrenal CT protocols are not necessary because the lesion can be confidently diagnosed as an adenoma (Figure 12). Therefore, lesion attenuation values should be measured repeatedly at multiphasic CT scans such that RPW should be calculated correctly.
Figure 11.
Time–attenuation curves of adenoma and non-adenoma. Most adenomas (middle) show an early wash-in and washout time–intensity curve (middle) so that these lesions require delayed enhanced CT in order to differentiate from non-adenomas (upper). However, some adenomas (lower) show an earlier wash-in and washout time–intensity curve, and these lesions do not require 10-min or 15-min delay contrast-enhanced CT scans. Multiphasic CT alone has the potential to characterize these adenomas because of high relative percentage washout (≥40%).
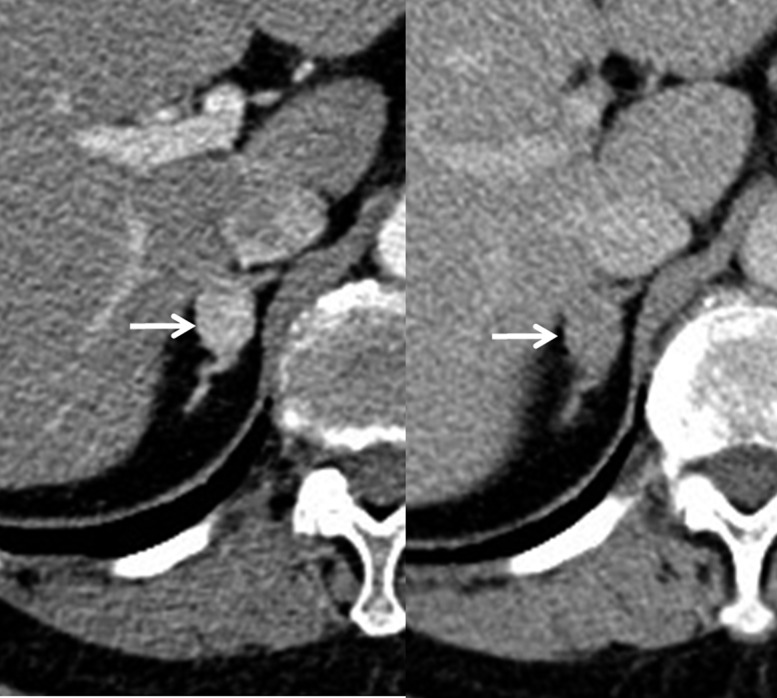
Figure 12.
Renal CT angiography in a 77-year-old female with hypertension. A right adrenal mass (arrow) is present measuring 146 HU and 77 HU on 1-min (left side) and 3-min (right side) contrast-enhanced CT images after the injection of the contrast material. The relative percentage washout is calculated as 47%, which is consistent with the adenoma. These CT scans were obtained as renal CT arteriography protocols for evaluating renal artery stenosis. Therefore, the patient does not require additional adrenal protocol CT scans in order to determine whether or not the lesion is an adenoma.
Adrenal CT protocols require three-phase CT scans, and thereby lead to an increased radiation dose. Adrenal incidentaloma can be detected in oncologic patients who undergo single-phase contrast-enhanced CT scan following surgery, chemotherapy or radiation therapy. If this CT scan can be performed with dual-energy sources, virtual UCT can be reconstructed from a raw data set that is derived from contrast-enhanced CT (Figure 5). A substantial number of lipid-rich adenomas can be diagnosed on virtual UCT, even though its sensitivity is inferior to that of true UCT.22,23 In this situation, using dual-energy CT can avoid the application of additional CT scans for further investigations of adrenal incidentaloma.
Many false positives may show adenoma-like enhancement. These lesions include hyperplasia5,11 (Figure 6), pheochromocytoma6,53–55 and hypervascular metastasis.8 Pheochromocytoma is a hypervascular adrenal tumour that frequently shows strong enhancement on ECT56 (Figure 13). Degeneration is uncommon in small pheochromocytomas, in which lesion enhancement is homogeneous.5,6 In addition, some pheochromocytomas can be encountered as incidentalomas because subclinical signs and symptoms are not uncommon.57 Hypervascular metastasis from renal-cell carcinoma or hepatocellular carcinoma shows adenoma-like enhancement.8 Therefore, it is not easy to differentiate adenoma from metastasis in patients with renal-cell carcinoma or hepatocellular carcinoma. Follow-up CT is recommended to determine whether the size of an adrenal lesion is stable.
Figure 13.
An adenoma-mimicking pheochromocytoma in a 40-year-old male. Unenhanced (left sided) CT image showing that a left adrenal mass (arrow) is measuring 40 HU. The lesion is measuring 120 HU and 70 HU on 1-min (middle) and 15-min (right sided) contrast-enhanced CT images. The absolute and relative percentage washouts are calculated as 63% and 42%, respectively. However, the histologic diagnosis was confirmed as pheochromocytoma after adrenalectomy.
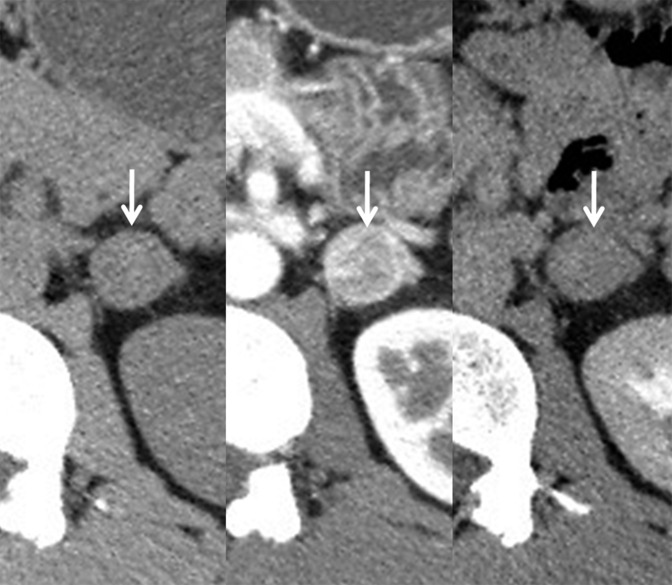
Almost all adenomas show peak enhancement around 1 min after the injection of the contrast material. If the peak enhancement occurs prior to or after 1 min, the lesion is likely to be diagnosed as a non-adenoma because of decreases in APW and RPW. Such cases are clinically regarded as false-negative lesions, although their incidence is not known (Figure 14).
Figure 14.
Atypical adenoma in a 71-year-old male. A right adrenal mass (arrow) is measured as 62 HU, 75 HU and 42 HU on 1-min (left sided), 3-min (middle) and 15-min (right sided) contrast-enhanced CT images after intravenous injection of the contrast material. The relative percentage washout is calculated as 32% with the lesion attenuation value on the 1-min CT image suggesting non-adenoma. However, relative percentage washout has increased to 44% with the lesion attenuation value on 3-min CT image suggesting adenoma.
Positron emission tomography/CT
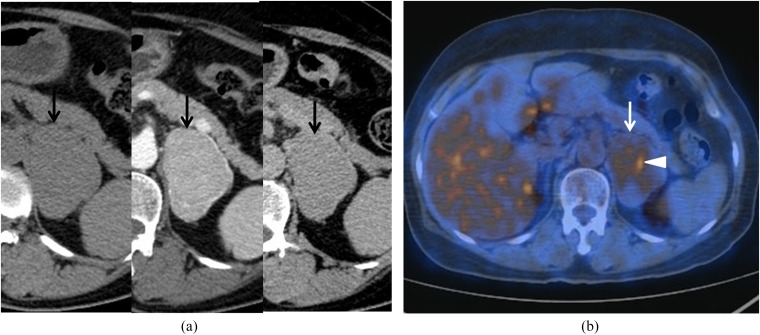
Fuorine-18-fludeoxyglucose (18F-FDG) PET/CT was originally developed to differentiate benign from malignant lesions and not to characterize adenoma. Visual assessment is practically accepted as a method of determining whether a lesion is malignant.9,58–61 In quantitative analyses of standardized uptake values, there is some overlap between adenoma and malignant lesions.58 The FDG uptake of a benign lesion is lower than that of liver parenchyma; conversely, the FDG uptake of a malignant lesion is equal to or higher than that of liver parenchyma.60 Some studies have reported that 18F-FDG PET achieves an excellent accuracy for differentiating benign and malignant lesions.60–63 However, in patients with a history of extra-adrenal malignancy, PET/CT is not superior to washout CT for discriminating adenoma from metastasis, when an adrenal mass showing lower FDG uptake than the liver is considered a benign lesion.9,59 The FDG uptakes of some adenomas are equal to or higher than those of liver parenchyma. These adenomas are accepted as the most common false-positive lesions9,58 (Figure 15). These lesions comprise approximately 5% of all adenomas.64 When adrenal masses showing only higher FDG uptake than the liver are considered to be malignant lesions, PET/CT achieves a higher accuracy for metastasis than washout CT9 (Table 1). Therefore, the PET/CT criteria for a malignant lesion should be changed to improve diagnostic accuracy. In oncologic patients, the combination of PET/CT and washout CT achieves higher accuracy for the characterization of metastasis than either PET/CT or washout CT.9
Figure 15.
Fluorine-18-fludeoxyglucose positron emission tomography/CT (18F-FDG PET/CT) in a 61-year-old female with an adenoma. (a) Unenhanced (left sided) CT image showing that a 6-cm left adrenal mass (arrow) is present measuring 42 HU. The lesion (arrow) is measuring 151 HU and 66 HU on 1-min (middle) and 15-min (right sided) contrast-enhanced CT images, respectively. The absolute and relative percentage washouts are calculated as 78% and 56%, respectively. These findings are consistent with an adenoma. The patient was under staging work-up after rectal cancer was detected. (b) The axial fusion image of 18F-FDG PET/CT shows a hypermetabolic focus (arrowhead) within the lesion (arrow). This finding may suggest the possibility of a focal metastasis or adenocarcinoma. However, the histologic diagnosis confirmed adenoma after adrenalectomy.
Summary
UCT can characterize most of the adenomas. CT histogram analysis can offer better sensitivity for characterizing adenoma than UCT. Dual-energy UCT provides characteristic findings that suggest adenoma, but the sensitivity is inferior to that of 120-kVp UCT.
CSI is superior to UCT, but inferior to washout CT, in terms of adenoma characterization. Still, CSI is not inferior to washout CT for the diagnosis of adenoma that measures <20 HU on UCT. Currently, DWI, DCI and MRS are not in common use because these MRI techniques offer poor sensitivity for characterizing adenoma.
As compared with other imaging modalities, washout CT provides higher accuracy for characterizing adenoma. Dual-energy washout CT may increase the radiation dose to patients with an adenoma that can be diagnosed with 120-kVp UCT alone. Virtual UCT needs some technical improvements to be equivalent to true UCT.
Because an adenoma is the most common false-positive lesion for metastasis, 18F-FDG PET/CT can improve the accuracy of metastatic lesion detection when an adrenal mass showing a higher FDG uptake than liver parenchyma is considered as a metastasis.
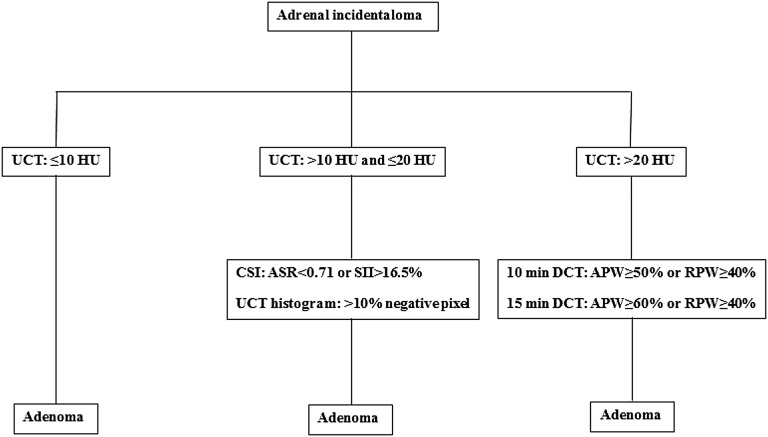
Quantitative parameters of UCT, CSI and washout CT are quite useful for imaging algorithm to characterize adenoma (Figure 16). However, we should know that many false-positive or false-negative lesions may decrease the adrenal imaging accuracy for adenoma characterization. These lesions should be considered whenever adrenal masses are evaluated on UCT, CSI washout CT and PET/CT.
Figure 16.
Imaging algorithm using quantitative parameters for adenoma characterization. ASR, adrenal-to-spleen ratio; APW, absolute percentage washout; CSI, chemical-shift imaging; DCT, delayed contrast-enhanced CT; RPW, relative percentage washout; SII, signal intensity index; UCT, unenhanced CT.
CONCLUSION
Various imaging techniques can characterize adenoma, which is the most common adrenal tumour. Familiarity with each imaging feature of adrenal adenoma can help to avoid additional examinations, interventions and costs for adenoma characterization.
Contributor Information
Jung Jae Park, Email: jungjaesmc.park@samsung.com.
Byung Kwan Park, Email: rapark@skku.edu, bk1436.park@samsung.com.
Chan Kyo Kim, Email: chankyo.kim@samsung.com.
REFERENCES
- 1.Kloos RT, Gross MD, Francis IR, Korobkin M, Shapiro B. Incidentally discovered adrenal masses. Endocr Rev 1995; 16: 460–84. doi: 10.1210/edrv-16-4-460 [DOI] [PubMed] [Google Scholar]
- 2.Bovio S, Cataldi A, Reimondo G, Sperone P, Novello S, Berruti A, et al. Prevalence of adrenal incidentaloma in a contemporary computerized tomography series. J Endocrinol Invest 2006; 29: 298–302. doi: 10.1007/BF03344099 [DOI] [PubMed] [Google Scholar]
- 3.Reznek RH, Armstrong P. The adrenal gland. Clin Endocrinol (Oxf) 1994; 40: 561–76. doi: 10.1111/j.1365-2265.1994.tb03006.x [DOI] [PubMed] [Google Scholar]
- 4.Paulsen SD, Nghiem HV, Korobkin M, Caoili EM, Higgins EJ. Changing role of imaging-guided percutaneous biopsy of adrenal masses: evaluation of 50 adrenal biopsies. AJR Am J Roentgenol 2004; 182: 1033–7. doi: 10.2214/ajr.182.4.1821033 [DOI] [PubMed] [Google Scholar]
- 5.Park BK, Kim B, Ko K, Jeong SY, Kwon GY. Adrenal masses falsely diagnosed as adenomas on unenhanced and delayed contrast-enhanced computed tomography: pathological correlation. Eur Radiol 2006; 16: 642–7. doi: 10.1007/s00330-005-0017-0 [DOI] [PubMed] [Google Scholar]
- 6.Park BK, Kim CK, Kwon GY, Kim JH. Re-evaluation of pheochromocytomas on delayed contrast-enhanced CT: washout enhancement and other imaging features. Eur Radiol 2007; 17: 2804–9. doi: 10.1007/s00330-007-0695-x [DOI] [PubMed] [Google Scholar]
- 7.Park BK, Kim CK, Kim B, Lee JH. Comparison of delayed enhanced CT and chemical shift MR for evaluating hyperattenuating incidental adrenal masses. Radiology 2007; 243: 760–5. doi: 10.1148/radiol.2433051978 [DOI] [PubMed] [Google Scholar]
- 8.Choi YA, Kim CK, Park BK, Kim B. Evaluation of adrenal metastases from renal cell carcinoma and hepatocellular carcinoma: use of delayed contrast-enhanced CT. Radiology 2013; 266: 514–20. doi: 10.1148/radiol.12120110 [DOI] [PubMed] [Google Scholar]
- 9.Park SY, Park BK, Kim CK. The value of adding (18)F-FDG PET/CT to adrenal protocol CT for characterizing adrenal metastasis (>/= 10 mm) in oncologic patients. AJR Am J Roentgenol 2014; 202: W153–60. doi: 10.2214/AJR.13.10873 [DOI] [PubMed] [Google Scholar]
- 10.Park SY, Park BK, Park JJ, Kim CK. CT sensitivities for large (>/=3 cm) adrenal adenoma and cortical carcinoma. Abdom Imaging 2015; 40: 310–7. doi: 10.1007/s00261-014-0202-1 [DOI] [PubMed] [Google Scholar]
- 11.Park SY, Park BK, Park JJ, Kim CK. Differentiation of adrenal hyperplasia from adenoma by use of CT densitometry and percentage washout. AJR Am J Roentgenol 2016; 206: 106–12. doi: 10.2214/AJR.15.14558 [DOI] [PubMed] [Google Scholar]
- 12.Park SY, Park BK, Park JJ, Kim CK. CT sensitivity for adrenal adenoma according to lesion size. Abdom Imaging 2015; 40: 3152–60. doi: 10.1007/s00261-015-0521-x [DOI] [PubMed] [Google Scholar]
- 13.Boland GW, Lee MJ, Gazelle GS, Halpern EF, McNicholas MM, Mueller PR. Characterization of adrenal masses using unenhanced CT: an analysis of the CT literature. AJR Am J Roentgenol 1998; 171: 201–4. doi: 10.2214/ajr.171.1.9648789 [DOI] [PubMed] [Google Scholar]
- 14.Korobkin M, Giordano TJ, Brodeur FJ, Francis IR, Siegelman ES, Quint LE, et al. Adrenal adenomas: relationship between histologic lipid and CT and MR findings. Radiology 1996; 200: 743–7. doi: 10.1148/radiology.200.3.8756925 [DOI] [PubMed] [Google Scholar]
- 15.Katabathina VS, Flaherty E, Kaza R, Ojili V, Chintapalli KN, Prasad SR. Adrenal collision tumors and their mimics: multimodality imaging findings. Cancer Imaging 2013; 13: 602–10. doi: 10.1102/1470-7330.2013.0053 [DOI] [PMC free article] [PubMed] [Google Scholar]
- 16.Untch BR, Shia J, Downey RJ, Carrasquillo JA, Panicek DM, Strong VE. Imaging and management of a small cell lung cancer metastasis/adrenal adenoma collision tumor: a case report and review of the literature. World J Surg Oncol 2014; 12: 45. doi: 10.1186/1477-7819-12-45 [DOI] [PMC free article] [PubMed] [Google Scholar]
- 17.Ho LM, Paulson EK, Brady MJ, Wong TZ, Schindera ST. Lipid-poor adenomas on unenhanced CT: does histogram analysis increase sensitivity compared with a mean attenuation threshold? AJR Am J Roentgenol 2008; 191: 234–8. doi: 10.2214/AJR.07.3150 [DOI] [PubMed] [Google Scholar]
- 18.Halefoglu AM, Yasar A, Bas N, Ozel A, Erturk SM, Basak M. Comparison of computed tomography histogram analysis and chemical-shift magnetic resonance imaging for adrenal mass characterization. Acta Radiol 2009; 50: 1071–9. doi: 10.3109/02841850903207170 [DOI] [PubMed] [Google Scholar]
- 19.Halefoglu AM, Bas N, Yasar A, Basak M. Differentiation of adrenal adenomas from nonadenomas using CT histogram analysis method: a prospective study. Eur J Radiol 2010; 73: 643–51. doi: 10.1016/j.ejrad.2008.12.010 [DOI] [PubMed] [Google Scholar]
- 20.Gupta RT, Ho LM, Marin D, Boll DT, Barnhart HX, Nelson RC. Dual-energy CT for characterization of adrenal nodules: initial experience. AJR Am J Roentgenol 2010; 194: 1479–83. doi: 10.2214/AJR.09.3476 [DOI] [PubMed] [Google Scholar]
- 21.Graser A, Johnson TR, Chandarana H, Macari M. Dual energy CT: preliminary observations and potential clinical applications in the abdomen. Eur Radiol 2009; 19: 13–23. doi: 10.1007/s00330-008-1122-7 [DOI] [PubMed] [Google Scholar]
- 22.Helck A, Hummel N, Meinel FG, Johnson T, Nikolaou K, Graser A. Can single-phase dual-energy CT reliably identify adrenal adenomas? Eur Radiol 2014; 24: 1636–42. doi: 10.1007/s00330-014-3192-z [DOI] [PubMed] [Google Scholar]
- 23.Kim YK, Park BK, Kim CK, Park SY. Adenoma characterization: adrenal protocol with dual-energy CT. Radiology 2013; 267: 155–63. doi: 10.1148/radiol.12112735 [DOI] [PubMed] [Google Scholar]
- 24.Blake MA, Krishnamoorthy SK, Boland GW, Sweeney AT, Pitman MB, Harisinghani M, et al. Low-density pheochromocytoma on CT: a mimicker of adrenal adenoma. AJR Am J Roentgenol 2003; 181: 1663–8. doi: 10.2214/ajr.181.6.1811663 [DOI] [PubMed] [Google Scholar]
- 25.Maritra A. The endocrine system. In: Kumar V, Abbas A, Fausto N, Aster J, eds. Robbins and Cotran pathologic basis of disease. 8th edn. Philadelphia, PA: Saunders Elsevier; 2010. pp. 1159–61. [Google Scholar]
- 26.Hood MN, Ho VB, Smirniotopoulos JG, Szumowski J. Chemical shift: the artifact and clinical tool revisited. Radiographics 1999; 19: 357–71. doi: 10.1148/radiographics.19.2.g99mr07357 [DOI] [PubMed] [Google Scholar]
- 27.Mitchell DG, Crovello M, Matteucci T, Petersen RO, Miettinen MM. Benign adrenocortical masses: diagnosis with chemical shift MR imaging. Radiology 1992; 185: 345–51. doi: 10.1148/radiology.185.2.1410337 [DOI] [PubMed] [Google Scholar]
- 28.Korobkin M, Lombardi TJ, Aisen AM, Francis IR, Quint LE, Dunnick NR, et al. Characterization of adrenal masses with chemical shift and gadolinium-enhanced MR imaging. Radiology 1995; 197: 411–18. doi: 10.1148/radiology.197.2.7480685 [DOI] [PubMed] [Google Scholar]
- 29.Israel GM, Korobkin M, Wang C, Hecht EN, Krinsky GA. Comparison of unenhanced CT and chemical shift MRI in evaluating lipid-rich adrenal adenomas. AJR Am J Roentgenol 2004; 183: 215–19. doi: 10.2214/ajr.183.1.1830215 [DOI] [PubMed] [Google Scholar]
- 30.Jhaveri KS, Wong F, Ghai S, Haider MA. Comparison of CT histogram analysis and chemical shift MRI in the characterization of indeterminate adrenal nodules. AJR Am J Roentgenol 2006; 187: 1303–8. doi: 10.2214/AJR.05.1022 [DOI] [PubMed] [Google Scholar]
- 31.Mayo-Smith WW, Lee MJ, McNicholas MM, Hahn PF, Boland GW, Saini S. Characterization of adrenal masses (< 5 cm) by use of chemical shift MR imaging: observer performance versus quantitative measures. AJR Am J Roentgenol 1995; 165: 91–5. doi: 10.2214/ajr.165.1.7785642 [DOI] [PubMed] [Google Scholar]
- 32.Schwartz LH, Panicek DM, Koutcher JA, Brown KT, Getrajdman GI, Heelan RT, et al. Adrenal masses in patients with malignancy: prospective comparison of echo-planar, fast spin-echo, and chemical shift MR imaging. Radiology 1995; 197: 421–5. doi: 10.1148/radiology.197.2.7480686 [DOI] [PubMed] [Google Scholar]
- 33.Tsushima Y, Ishizaka H, Matsumoto M. Adrenal masses: differentiation with chemical shift, fast low-angle shot MR imaging. Radiology 1993; 186: 705–9. doi: 10.1148/radiology.186.3.8430178 [DOI] [PubMed] [Google Scholar]
- 34.Fujiyoshi F, Nakajo M, Fukukura Y, Tsuchimochi S. Characterization of adrenal tumors by chemical shift fast low-angle shot MR imaging: comparison of four methods of quantitative evaluation. AJR Am J Roentgenol 2003; 180: 1649–57. doi: 10.2214/ajr.180.6.1801649 [DOI] [PubMed] [Google Scholar]
- 35.Park BK, Sim JS. Adrenal gland. In: Kim SH, ed. Radiology illustrated uroradiology. 2nd edn. Berlin, Germany: Springer; 2012. pp. 1119–53. [Google Scholar]
- 36.Koo HJ, Choi HJ, Kim HJ, Kim SO, Cho KS. The value of 15-minute delayed contrast-enhanced CT to differentiate hyperattenuating adrenal masses compared with chemical shift MR imaging. Eur Radiol 2014; 24: 1410–20. doi: 10.1007/s00330-013-3084-7 [DOI] [PubMed] [Google Scholar]
- 37.Seo JM, Park BK, Park SY, Kim CK. Characterization of lipid-poor adrenal adenoma: chemical-shift MRI and washout CT. AJR Am J Roentgenol 2014; 202: 1043–50. doi: 10.2214/AJR.13.11389 [DOI] [PubMed] [Google Scholar]
- 38.Ciçekçi M, Onur MR, Aydin AM, Gül Y, Ozkan Y, Akpolat N, et al. The role of apparent diffusion coefficient values in differentiation between adrenal masses. Clin Imaging 2014; 38: 148–53. doi: 10.1016/j.clinimag.2013.11.003 [DOI] [PubMed] [Google Scholar]
- 39.Halefoglu AM, Altun I, Disli C, Ulusay SM, Ozel BD, Basak M. A prospective study on the utility of diffusion-weighted and quantitative chemical-shift magnetic resonance imaging in the distinction of adrenal adenomas and metastases. J Comput Assist Tomogr 2012; 36: 367–74. doi: 10.1097/RCT.0b013e3182597613 [DOI] [PubMed] [Google Scholar]
- 40.Koh DM, Collins DJ. Diffusion-weighted MRI in the body: applications and challenges in oncology. AJR Am J Roentgenol 2007; 188: 1622–35. doi: 10.2214/AJR.06.1403 [DOI] [PubMed] [Google Scholar]
- 41.Miller FH, Wang Y, McCarthy RJ, Yaghmai V, Merrick L, Larson A, et al. Utility of diffusion-weighted MRI in characterization of adrenal lesions. AJR Am J Roentgenol 2010; 194: W179–85. doi: 10.2214/AJR.09.2891 [DOI] [PubMed] [Google Scholar]
- 42.Chung JJ, Semelka RC, Martin DR. Adrenal adenomas: characteristic postgadolinium capillary blush on dynamic MR imaging. J Magn Reson Imaging 2001; 13: 242–8. doi: [DOI] [PubMed] [Google Scholar]
- 43.Inan N, Arslan A, Akansel G, Anik Y, Balci NC, Demirci A. Dynamic contrast enhanced MRI in the differential diagnosis of adrenal adenomas and malignant adrenal masses. Eur J Radiol 2008; 65: 154–62. doi: 10.1016/j.ejrad.2007.03.012 [DOI] [PubMed] [Google Scholar]
- 44.Rodacki K, Ramalho M, Dale BM, Battisti S, de Campos RO, Giardino A, et al. Combined chemical shift imaging with early dynamic serial gadolinium-enhanced MRI in the characterization of adrenal lesions. AJR Am J Roentgenol 2014; 203: 99–106. doi: 10.2214/AJR.13.11731 [DOI] [PubMed] [Google Scholar]
- 45.Faria JF, Goldman SM, Szejnfeld J, Melo H, Kater C, Kenney P, et al. Adrenal masses: characterization with in vivo proton MR spectroscopy—initial experience. Radiology 2007; 245: 788–97. doi: 10.1148/radiol.2453061854 [DOI] [PubMed] [Google Scholar]
- 46.Boesch C, Vermathen P, Kreis R. Insufficient spectral quality to draw conclusions. Radiology 2009; 250: 955–6; author reply 955–6; discussion 956. doi: 10.1148/radiol.2503081276 [DOI] [PubMed] [Google Scholar]
- 47.Woo S, Cho JY, Kim SY, Kim SH. Adrenal adenoma and metastasis from clear cell renal cell carcinoma: can they be differentiated using standard MR techniques? Acta Radiol 2014; 55: 1120–8. doi: 10.1177/0284185113512301 [DOI] [PubMed] [Google Scholar]
- 48.Szolar DH, Kammerhuber FH. Adrenal adenomas and nonadenomas: assessment of washout at delayed contrast-enhanced CT. Radiology 1998; 207: 369–75. doi: 10.1148/radiology.207.2.9577483 [DOI] [PubMed] [Google Scholar]
- 49.Caoili EM, Korobkin M, Francis IR, Cohan RH, Dunnick NR. Delayed enhanced CT of lipid-poor adrenal adenomas. AJR Am J Roentgenol 2000; 175: 1411–5. doi: 10.2214/ajr.175.5.1751411 [DOI] [PubMed] [Google Scholar]
- 50.Pena CS, Boland GW, Hahn PF, Lee MJ, Mueller PR. Characterization of indeterminate (lipid-poor) adrenal masses: use of washout characteristics at contrast-enhanced CT. Radiology 2000; 217: 798–802. [DOI] [PubMed] [Google Scholar]
- 51.Caoili EM, Korobkin M, Francis IR, Cohan RH, Platt JF, Dunnick NR, et al. Adrenal masses: characterization with combined unenhanced and delayed enhanced CT. Radiology 2002; 222: 629–33. doi: 10.1148/radiol.2223010766 [DOI] [PubMed] [Google Scholar]
- 52.Park BK, Kim CK, Kim B. Adrenal incidentaloma detected on triphasic helical CT: evaluation with modified relative percentage of enhancement washout values. Br J Radiol 2008; 81: 526–30. doi: 10.1259/bjr/21470134 [DOI] [PubMed] [Google Scholar]
- 53.Yoon JK, Remer EM, Herts BR. Incidental pheochromocytoma mimicking adrenal adenoma because of rapid contrast enhancement loss. AJR Am J Roentgenol 2006; 187: 1309–11. doi: 10.2214/AJR.05.0492 [DOI] [PubMed] [Google Scholar]
- 54.Johnson PT, Horton KM, Fishman EK. Adrenal mass imaging with multidetector CT: pathologic conditions, pearls, and pitfalls. Radiographics 2009; 29: 1333–51. doi: 10.1148/rg.295095027 [DOI] [PubMed] [Google Scholar]
- 55.Patel J, Davenport MS, Cohan RH, Caoili EM. Can established CT attenuation and washout criteria for adrenal adenoma accurately exclude pheochromocytoma? AJR Am J Roentgenol 2013; 201: 122–7. doi: 10.2214/AJR.12.9620 [DOI] [PubMed] [Google Scholar]
- 56.Northcutt BG, Raman SP, Long C, Oshmyansky AR, Siegelman SS, Fishman EK, et al. MDCT of adrenal masses: can dual-phase enhancement patterns be used to differentiate adenoma and pheochromocytoma? AJR Am J Roentgenol 2013; 201: 834–9. doi: 10.2214/AJR.12.9753 [DOI] [PubMed] [Google Scholar]
- 57.Cook DM, Loriaux DL. The incidental adrenal mass. Am J Med 1996; 101: 88–94. doi: 10.1016/S0002-9343(96)00082-4 [DOI] [PubMed] [Google Scholar]
- 58.Boland GW, Blake MA, Holalkere NS, Hahn PF. PET/CT for the characterization of adrenal masses in patients with cancer: qualitative versus quantitative accuracy in 150 consecutive patients. AJR Am J Roentgenol 2009; 192: 956–62. doi: 10.2214/AJR.08.1431 [DOI] [PubMed] [Google Scholar]
- 59.Park BK, Kim CK, Kim B, Choi JY. Comparison of delayed enhanced CT and 18F-FDG PET/CT in the evaluation of adrenal masses in oncology patients. J Comput Assist Tomogr 2007; 31: 550–6. doi: 10.1097/rct.0b013e31802fa8e1 [DOI] [PubMed] [Google Scholar]
- 60.Yun M, Kim W, Alnafisi N, Lacorte L, Jang S, Alavi A. 18F-FDG PET in characterizing adrenal lesions detected on CT or MRI. J Nucl Med 2001; 42: 1795–9. [PubMed] [Google Scholar]
- 61.Maurea S, Mainolfi C, Bazzicalupo L, Panico MR, Imparato C, Alfano B, et al. Imaging of adrenal tumors using FDG PET: comparison of benign and malignant lesions. AJR Am J Roentgenol 1999; 173: 25–9. doi: 10.2214/ajr.173.1.10397094 [DOI] [PubMed] [Google Scholar]
- 62.Boland GW, Goldberg MA, Lee MJ, Mayo-Smith WW, Dixon J, McNicholas MM, et al. Indeterminate adrenal mass in patients with cancer: evaluation at PET with 2-[F-18]-fluoro-2-deoxy-D-glucose. Radiology 1995; 194: 131–4. doi: 10.1148/radiology.194.1.7997539 [DOI] [PubMed] [Google Scholar]
- 63.Erasmus JJ, Patz EF, Jr, McAdams HP, Murray JG, Herndon J, Coleman RE, et al. Evaluation of adrenal masses in patients with bronchogenic carcinoma using 18F-fluorodeoxyglucose positron emission tomography. AJR Am J Roentgenol 1997; 168: 1357–60. doi: 10.2214/ajr.168.5.9129444 [DOI] [PubMed] [Google Scholar]
- 64.Chong S, Lee KS, Kim HY, Kim YK, Kim BT, Chung MJ, et al. Integrated PET-CT for the characterization of adrenal gland lesions in cancer patients: diagnostic efficacy and interpretation pitfalls. Radiographics 2006; 26: 1811–24; discussion 24–6. [DOI] [PubMed] [Google Scholar]


