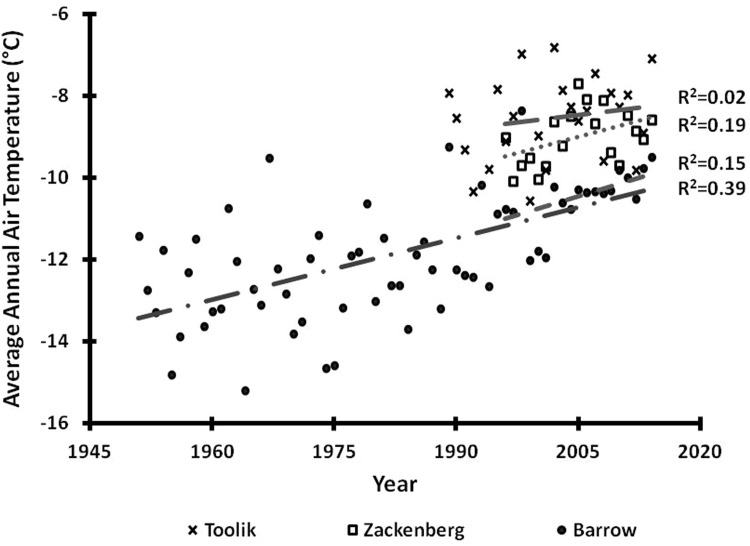
Fig. 2.
Annual mean Barrow SAT (surface air temperature, closed circles) for 1950–2014, annual mean Toolik SAT (x’s) for 1989-2014, and Zackenberg SAT (open squares) for 1996–2014. Also shown are the linear regressions for Barrow 1950–2014 (dashed dot line), Barrow 1996–2014 (short-dashed line), Toolik 1996–2014 (long-dashed line), and Zackenberg 1996–2014 (dotted line). Regression lines and coefficients are ordered from top to bottom as Toolik, Zackenberg, Barrow (1996–2014), and Barrow (1950–2014). Only the Barrow 1950–2014 and Zackenberg 1996–2014 linear regressions are significant (p < 0.01). Data from Alaska Climate Research Center (2015), Toolik LTER (http://dx.doi.org/10.6073/pasta/2f655c865f42136611b2605ae778d275), and Zackenberg (http://www.data.g-e-m.dk)

