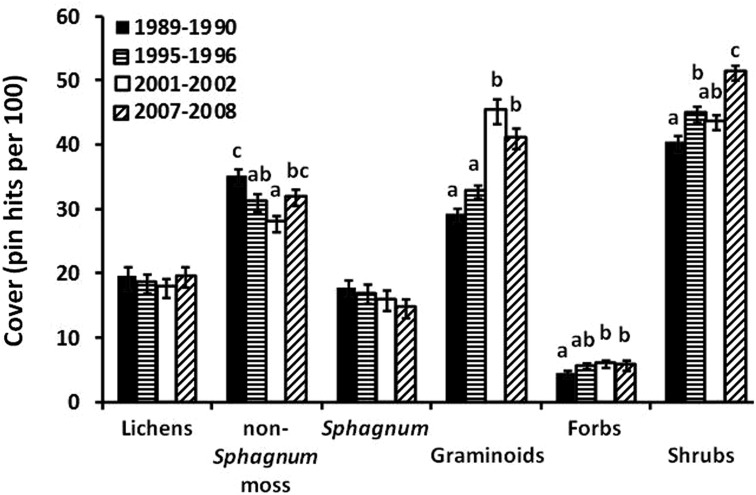
Fig. 8.
The number of hits per plot of different vegetation growth forms at the Imnavait Creek and nearby Toolik grids. There were a total of 156 plots each sampled four times from 1989 to 2008. The letters above the bars indicate significant differences while error bars represent standard errors. Statistical differences determined via MANOVA with Tukey’s B post hoc test to determine significant differences among years (p < 0.01). Figure redrawn from Shaver et al. (2014). Original data from Mercado-Díaz (2011)

