Abstract
The isocortex of primates is disproportionately expanded relative to many other mammals. Yet, little is known about what the expansion of the isocortex entails for differences in cellular composition and connectivity patterns in primates. Across the depth of the isocortex, neurons exhibit stereotypical patterns of projections. Upper layer neurons (i.e., layers II–IV) project within and across cortical areas whereas many lower layer pyramidal neurons (i.e., layers V–VI) favor connections to subcortical regions. To identify evolutionary changes in connectivity patterns, we quantified upper (i.e., layers II–IV) and lower (i.e., layers V–VI) layer neuron numbers in primates and other mammals such as rodents and carnivores. We also used MR tractography based on high-angular resolution diffusion imaging and diffusion spectrum imaging to compare anterior to posterior corticocortical tracts between primates and other mammals. We found that primates possess disproportionately more upper layer neurons as well as an expansion of anterior to posterior corticocortical tracts compared with other mammals. Taken together, these findings demonstrate that primates deviate from other mammals in exhibiting increased cross-cortical connectivity.
Keywords: cortex, evolution, connections, RRID:SCR_001905, RRID:SCR_002526, RRID:SCR_004817, RRID:SCR_012324
Graphical Abstract
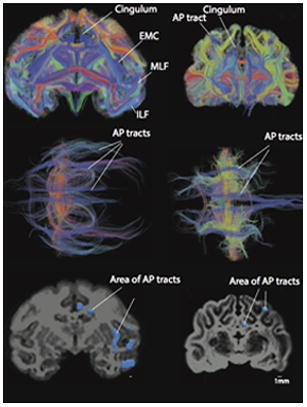
We combine diffusion MR imaging methods with neuron counts to compare cortical connectivity patterns between primate and other mammals. Our findings suggest that primates deviate from other studied mammals in exhibiting increased cross-cortical integration.
Introduction
Primates possess an expanded isocortex and more isocortical neurons compared to many other mammals, but the implications for cortical structure, connectivity patterns, and function remain poorly understood (Finlay and Darlington, 1995; Barton and Harvey, 2000; Herculano-Houzel, 2012). How connectivity patterns and cross-cortical integration evolved with the expansion of the primate isocortex is a fundamental question in evolutionary neuroscience.
Across the depth of the isocortex, neurons exhibit stereotypical and conserved projection patterns (Gilbert et al., 1975; Nudo and Masterton, 1990; Barbas, 1986). Generally, upper layer neurons (i.e., layers II–IV) form connections with other cortical neurons. Many lower layer pyramidal neurons (i.e., layers V–VI) form connections with subcortical structures (Gilbert et al., 1975; Nudo and Masterdon, 1990; Barbas, 1986), and some lower layer neurons project cross-cortically (Callaway, 1998; Kennedy and Bullier 1985; Sincich et al., 2010). Layer IV neurons are locally-projecting whereas layer III pyramidal neuron preferentially project over longer distances. Given that neurons generally exhibit conserved stereotypical patterns of projections, a greater number of upper layer neurons would suggest increased cross-cortical integration.
Comparing connectivity patterns between species has traditionally been challenging because differences arising from noninvasive methods (e.g., diffusion MR imaging) can be difficult to interpret (Jones et al., 2013) and tract-tracing methods can be problematic to quantitatively compare across species (Nudo and Masterton, 1990). For these reasons, the present study combines stereological counts of neuron numbers across cortical layers with comparative analyses of diffusion MRI tractography to assess whether primates exhibit evidence of increased intracortical connectivity relative to other mammals.
In the present study, we collected data on upper layer (i.e., layers II–IV) and lower layer neuron (i.e., layers V–VI) numbers of primate and nonprimate species. Many layer IV neurons project locally whereas many layer II–III neurons form synapses with other cortical neurons. A comparative analysis of layer II–IV neuron numbers yields insights into evolutionary changes in cortical neuron numbers that modulate incoming (e.g., thalamocortical input) and cross-cortical information (Frost and Caviness, 1980). We also assessed evolutionary changes in long-range cross-cortical connectivity patterns between primate and nonprimate species with the use of high angular resolution diffusion and diffusion spectrum MR tractography. Our analyses show that primates possess disproportionately more isocortical neurons, more upper layer neurons and increased long-range projecting intracortical tracts coursing across the anterior-posterior axis compared with other mammals. Collectively, these findings demonstrate that primates possess evidence of increased cross-cortical integration relative to other studied mammals.
Materials and Methods
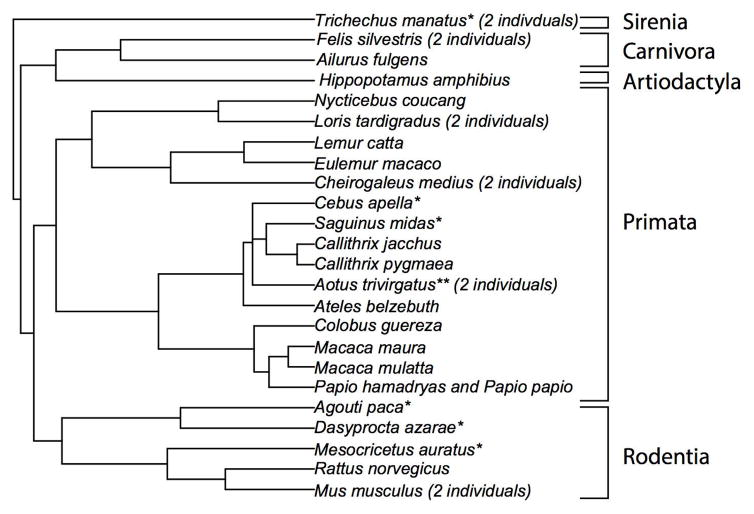
The brains of many of the animals used for the present study were collected opportunistically at necropsy from zoos and biomedical facilities. No animals were sacrificed for the purpose of this research. We include stereological data on upper and lower layer neuron numbers for 31 individuals, consisting of 24 species used for phylogenetically-controlled analyses (i.e., 16 primate species and 9 nonprimate mammalian species (e.g., rodents, carnivores; Figure 1; Table 1, 2). This data-set includes novel stereological data of 23 individuals as well as previously published data of six species collected by the same author (Charvet et al., 2015, 2016; Figure 1). Some specimens had been perfusion-fixed with 4% paraformaldehyde (i.e., mice, rat, cat, macaque) while other individuals were immersion-fixed in 10% formalin.
Figure 1.
Phylogeny of species used in analyses for comparison of upper and lower layer neuron numbers. The selected species span 5 mammalian orders (i.e., Sirenia, Carrnivora, Artiodactyla, Primates, Rodentia). Species names highlighted with an asterisk were used in previous studies. The number of individuals obtained per species is listed if more than one individual per species was selected. ** Stereological counts were obtained from one individual owl monkey from a previous study. An additional individual owl monkey was obtained for the present study.
Table 1.
Upper and lower layer neuron number values in millions across 25 mammalian species. Values are averaged across individuals if more than one individual was selected per species.
| Common name | Species | Upper layer neuron numbers x106 | Lower layer neuron numbers x106 |
|---|---|---|---|
| Paca | Agouti paca | 17.45 | 13.8 |
| Red panda | Ailurus fulgens | 151.46 | 93.31 |
| Owl monkey | Aotus trivirgatus | 135.78 | 59.24 |
| White-faced spider monkey | Ateles belzebuth | 586.77 | 208.55 |
| Marmoset | Callithrix jacchus | 80.94 | 41.47 |
| Pygmy marmoset | Callithrix pygmaea | 66.03 | 30.09 |
| Capuchin | Cebus apella | 363 | 145.98 |
| Fat-tailed dwarf lemur | Cheirogaleus medius | 12.18 | 6.73 |
| Mantled guereza | Colobus guereza | 849.21 | 367.95 |
| Agouti | Dasyprocta azarae | 15.86 | 13.14 |
| Blue-eyed black lemur | Eulemur macaco | 117 | 62.81 |
| Cat | Felis silvestris | 88.64 | 54.56 |
| River hippopotamus | Hippopotamus amphibious | 348.15 | 201.25 |
| Ring-tailed lemur | Lemur catta | 102.05 | 55.68 |
| Slender loris | Loris tardigradus | 58.34 | 30.41 |
| Moor Macaque | Macaca Maura | 964.69 | 508.13 |
| Rhesus macaque | Macaca mulatta | 910.86 | 394.95 |
| Hamster | Mesocricetus auratus | 2.2 | 2.42 |
| Wild-type mouse | Mus musculus | 3.07 | 3.16 |
| Sunda slow loris | Nycticebus coucang | 62.39 | 38.91 |
| Hamadryas baboon | Papio hamadryas | 1702.44 | 806.24 |
| Guinea baboon | Papio papio | 2060.84 | 645.10 |
| Rat | Rattus norvegicus | 8.69 | 9.52 |
| Red-handed tamarin | Saguinus midas | 82.89 | 30.05 |
| Manatee | Trichechus manatus | 114.50 | 81.00 |
Table 2.
Stereological information, age, and sex of the specimens selected in the present study.
| Common name | Species | Upper layer/lower layer neurons counted | Brain weight (g) | Age | Sex | Sections sampled | Section thickness (μm) | Optical disector (μm) |
|---|---|---|---|---|---|---|---|---|
| Red panda | Ailurus fulgens | 619/365 | 52.01 | 11y | M | 3 | 40 | 8 |
| White-faced spider monkey | Ateles belzebuth | 1,346/433 | 112.00 | 36 y | F | 3 | 40 | 8 |
| Pygmy marmoset | Callithirx pygmaea | 1,299/592 | 4.78 | 11.25y | F | 3 | 40 | 8 |
| Marmoset | Callithrix jacchus | 3,885/1,887 | 7.40 | 4y | M | 5 | 40 | 8 |
| Fat-tailed dwarf lemur | Cheirogaleus medius | 562/311 | 3.60 | 14y 2m | F | 6 | 40 | 8 |
| Fat-tailed dwarf lemur | Cheirogaleus medius | 1,061/551 | 3.30 | 13 y 7m | M | 5 | 40 | 8 |
| Mantled guereza | Colobus guereza | 1,151/482 | 83.90 | 15 y 9m | F | 5 | 40 | 8 |
| Agouti | Dasyprocta azarae | 453/413 | 14.87 | ? | M | 3 | 60 | 8 |
| Blue-eyed black lemur | Eulemur macaco flavifrons | 2,496/1,340 | 26.90 | 18 y 1m | F | 3 | 40 | 8 |
| Cat | Felis catus | 775/478 | 29.61 | ? | ? | 3 | 80 | 8 |
| Cat | Felis catus | 1,031/687 | 29.61 | ? | ? | 4 | 40 | 6 |
| River hippopotamus | Hippopotamus amphibious | 983/552 | 500.00 | ~60 y | M | 6 | 60 | 6 |
| Ring-tailed lemur | Lemur catta | 986/538 | 21.80 | 24.5 y | F | 5 | 40 | 8 |
| Slender loris | Loris tardigradus | 705/361 | 6.70 | 18y 4m | M | 4 | 40 | 8 |
| Slender loris | Loris tardigradus | 1,928/934 | 5.90 | 11y 10m | F | 3 | 40 | 8 |
| Moor Macaque | Macaca maura | 2,229/869 | 105.50 | 5 y | F | 3 | 40 | 8 |
| Rhesus macaque | Macaca mulatta | 2,225/931 | 103.08 | 7y 8m | F | 4 | 40 | 8 |
| Wild-type mouse | Mus musculus | 383/720 | 0.55 | ? | M | 3 | 30 | 6 |
| Wild-type mouse | Mus musculus | 903/679 | 0.55 | ? | M | 4 | 30 | 6 |
| Sunda slow loris | Nycticebus coucang | 944/539 | 13.60 | 13 y 11m | M | 3 | 40 | 8 |
| Hamadryas baboon | Papio hamadryas | 598/302 | 144.95 | 4 y 8m | F | 6 | 40 | 8 |
| Guinea baboon | Papio papio | 1,063/468 | 134.66 | 7y11m | F | 12 | 40 | 8 |
| Rat | Rattus norvegicus | 670/705 | 2.30 | 4y | F | 3 | 40 | 8 |
Postmortem intervals varied among brains that were immersion-fixed from immediately after death to 14 hours. Because of the differences in fixative procedures as a source of potential variation in tissue preservation quality, we did not use antibodies (e.g., an antibody against NeuN) to label neurons. Our preliminary analysis showed inconsistency in NeuN immunolabeling across species. We therefore selected the more consistent method of Nissl staining to identify cell somata for neuron quantification. Although the dataset presented in this study was constrained by availability, a comparative analysis of upper and lower layer neurons of these rare specimens provides a remarkable opportunity to identify evolutionary changes in upper layer neuron numbers across mammals.
For diffusion MR tractography, we selected a smaller sample of brains for comparative analyses of tracts than that used for stereology. The samples used for diffusion MR tractography were also chosen to include brains that varied in size. We selected 9 individuals, consisting of two mice, one rat, one cat, one marmoset, one rhesus macaque, one baboon, one human, as well as a hippopotamus. The sample included mice, rats, cats, and macaques because tract-tracers and lesion studies in these species provide the opportunity to validate findings obtained with diffusion MR tractography (Kuypers et al., 1965; Pandya and Kyupers, 1969; Miller and Vogt, 1984; Schmahmann et al., 2017; Schmahmann and Pandya, 2009; Kawamura and Otani, 1970; Kawamura, 1973a, b, c, Oh et al., 2014; Innocenti et al., 2016).
Some of the brains used for stereological cell counting and diffusion MR tractography were identical individuals (hippopotamus, baboon). In some cases, as in the mouse, the marmoset, and the cat, we obtained stereologic data and diffusion MR tractography for the same species but not the same individuals. This is because some brains had been discarded after they had been imaged or they had been used for different purposes. In some cases, sectioning the brains was not feasible as was the case for the human brain, which was obtained from a medical school and was not fixed for histology. We therefore did not obtain neuron counts for the human isocortex. The specimens used for diffusion MR imaging were young adults although precise age of these individuals was not recorded. No information related to age or sex was given for the human. Although we used different individuals for histology and diffusion MR tractography, our analyses focus on large differences between species rather than smaller individual differences.
Stereology
We quantified total upper layer (layers II–IV) and lower layer (layers V–VI) neuron numbers using the optical fractionator technique (Williams and Rakic, 1988; West et al., 1991). Upper layer neurons differ from lower layer neurons in their patterns of connectivity. Upper layer neurons project cross-cortically. Many lower layer neurons project subcortically and some lower layer neurons project cross-cortically (Sincich et al., 2010). Although we do not consider potential evolutionary changes in lower layer neuron numbers projecting cross-cortically, an increase in upper layer neuron numbers implies greater intra-cortical integration. Cross-species comparisons between upper and lower layer neurons do not distinguish short-range from long range projecting neurons.
We quantified upper layer (layers II–IV) and lower layer (layers V–VI) neuron numbers across primate and nonprimate species. All brains used for neuron counts were immersed in a graded series of sucrose solutions up to 30% for cryoprotection and sectioned coronally on a freezing sliding microtome at a thickness of 30–80 μm (Tables 1, 2). Serial sections of brains were Nissl-stained with a solution of 0.5% cresyl violet and coverslipped. Quantitative analyses of upper and lower layer neuron numbers were performed using a Zeiss Axioplan 2 photomicroscope equipped with a Ludl XY motorized stage (Ludl Electronics, Hawthorne, NY, USA), a Heidenhain z-axis encoder (Heidenhain, Schaumburg, IL, USA), an Optronics MicroFire color videocamera (Optronics, Goleta, CA, USA) and a computer was equipped with StereoInvestigator software, version 10 (MBF Bioscience, Williston, VT, USA, RRID:SCR_002526).
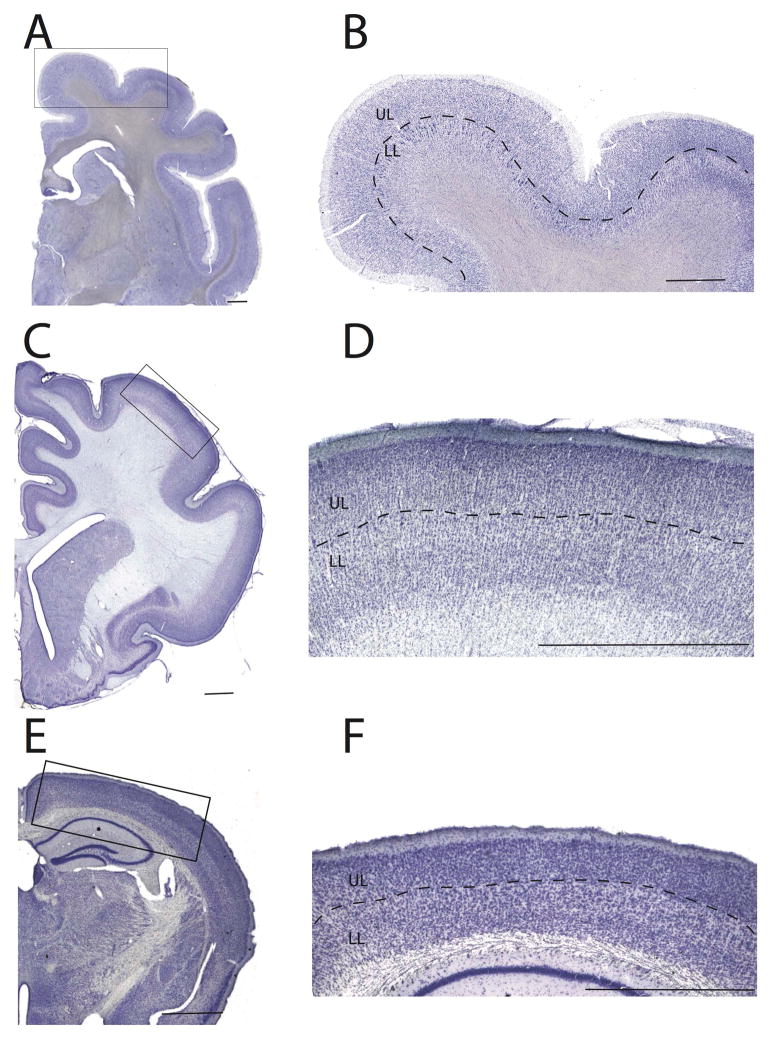
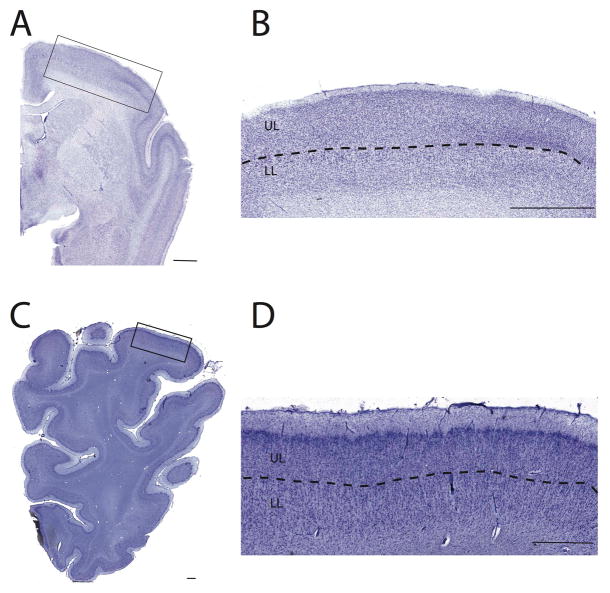
Upper and lower layers were delineated at low magnification (e.g., 2.5x and 4x objective lens) for each section such that variation in cytoarchitecture across the depth of the isocortex was evident. The isocortex does not include limbic structures such as the olfactory cortex and entorhinal cortex but it does include the cingulate cortex. Upper layers (i.e., layers II–IV) were delineated by the boundary between layers I and II as well as the boundary between layer IV and V. Lower layers were bounded between the white matter as well as the boundary between layer IV and V as had been done previously (Charvet et al., 2015, 2016). Layer IV neurons were defined as small ‘granular’ cells if present as defined cytoarchitecturally. We combined layers IV and II/III in our analysis because layer IV can be challenging to systematically distinguish from layers II–III across the cortex of many of the selected species. For instance, the hippopotamus does not exhibit a clear layer IV (Figure 2–4; Charvet et al., 2016, Butti et al., 2014). The presence of large cells in layer V was also used to define the boundary between upper and lower layers (Figure 2–4).
Figure 2.
Examples of delineations used to identify upper (UL) and lower layers (LL) in lemur (A, B), a cat (B, C), and a mouse (D, E). In some cases,, the boundary between upper and lower layers was distinguished by large cells located in the layer V. In cats, layer IV consists of stellate cells such that delineations were based on the presence of large cells in layer V as well as an increase in cell density in layer IV, when possible. In those cases, the presence of large cells in layer V was used to distinguish upper from lower layers. Scale bar: 1.5 mm.
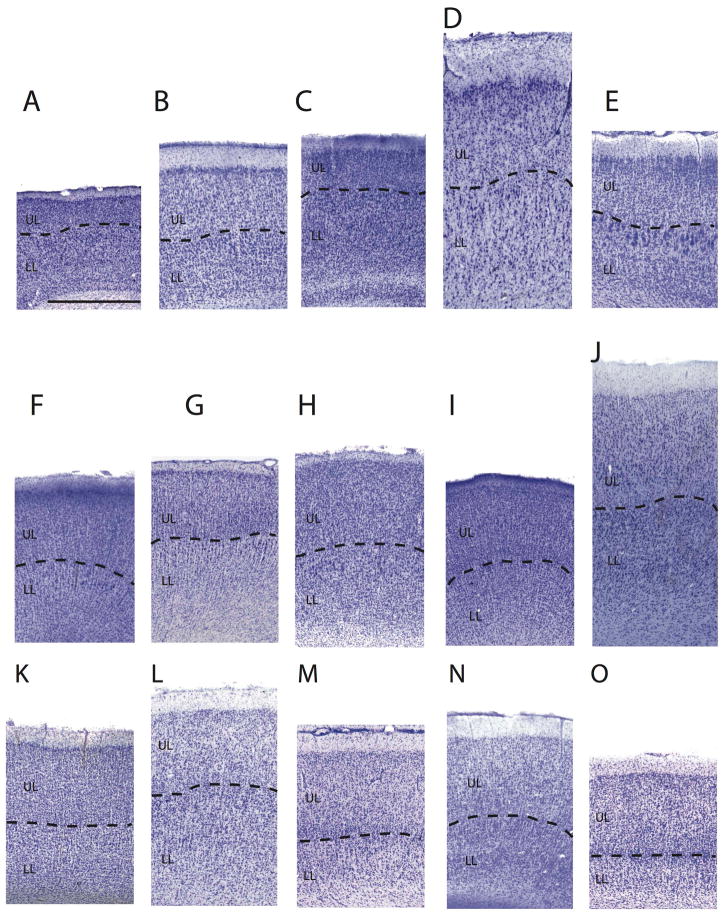
Figure 4.
Nissl-stained sections through the frontal cortex of a (A) mouse, (B) an agouti, (C) a rat, (D) a hippopotamus, (E) a red panda, (F) ring-tailed lemur, (G) a slender loris, (H) a marmoset (I) a moor macaque, (J) a hamadryas baboon, (K) a fat-tailed dwarf lemur, (L) a spider monkey (M) a mantled guereza, (N) a guinea baboon, and (O) a rhesus macaque. Boundaries show the delineations made between upper (UL) and lower layers (LL). Scale bar: 1 mm.
Upper and lower layer neuron counts were obtained with the use of the optical disector with a fractionator sampling method. We randomly selected, regularly spaced series of sections through the isocortex to quantify neuron numbers. We selected 3 to 12 equidistant sections (x̄ = 4.3 sections) across the isocortex for one hemisphere. The first section selected for neuron counts was randomly selected from among the most rostral or caudal set of sections. If the randomly selected section was damaged, we selected the most adjacent section. The selected sections encompass the rostral or anterior cortex and caudal or posterior cortex. We applied counting frames (40 × 40 μm) throughout upper and lower layers separately. In most cases, we used a disector height of 8 μm such that the thickness of the section was subsampled (Table 2) and yielded a guard zone of at least 5 μm at the bottom of the section. The distance between counting frames varied among brains that differed in size. Distance between counting frames ranged between 150 × 150 μm in small brains such as mice to 3000 × 3000 μm in large brains such as baboons. In general, we aimed to oversample neuron counts for each studied isocortex (Table 2). On average, we quantified 1,237 upper layer neurons and 659 lower layer neurons per individual. The sampling scheme yielded an average Gunderson coefficient of error of 0.001 for upper layers and 0.002 for lower layers (Gunderson, 1998). We measured the mounted thickness of tissue within upper and lower layers for each section sampled for neuron counts and averaged the shrunken thickness across sampled sites (Carlo and Stevens, 2011).
Neurons were distinguished from other cells by having a pale cytoplasmic soma and a dense nucleus in comparison with glial cells, which are smaller and circular. Endothelial cells are distinguishable from neuronal or glial cells by their elongate shape in contrast to neurons, which are either circular or pyramidal. We applied this definition systematically across upper and lower layers and across species. These definitions follow that of previous studies that utilized Nissl-stained sections to quantify neuron numbers across layers (Charvet et al., 2015; 2016). Our quantitative analysis of upper and lower layer neurons does not distinguish interneurons from pyramidal neurons.
We include previous published data on total upper and lower layer neuron numbers, obtained by the same author (Charvet et al., 2015, 2016). To ensure that the reported values from previous studies fall within the range of those found in the present study, we also quantified upper and lower layer neuron numbers in an agouti (Dasyprocta azarae), which had been used in a previous study (Charvet et al., 2015). We found that total isocortical neuron counts of the agouti in the present study (29.16 million neurons) are very similar to those reported previously (28.85 million neurons, Charvet et al., 2015). Further, we found that total unilateral isocortical neuron numbers average 1.30 billion neurons in the rhesus macaque (Macaca mulatta) and that these values are highly similar to that reported previously with the use of the optical disector method for the same species (i.e., 1.35 billion neurons, Christensen et al., 2007). These observations demonstrate that our estimates are highly similar to estimates reported by others.
Diffusion MR scanning procedures
Ex vivo brains were scanned to identify species differences in corticocortical connectivity patterns. The brains of young adults from each species were placed in Fomblin solution (Ausimont, Thorofare, NJ) prior to being scanned. Our comparative analysis of tracts includes two mice, one rat, one cat (postnatal day 100), one marmoset, one rhesus macaque, one baboon, one hippopotamus and a human (Figure 5–9). We imaged very small brains (e.g., marmoset; brain weight = 7 g) as well as very large brains (human; brain weight = 1300 g). The wide range of variation in brain size used in the present study required the use of different scanners and scanning procedures (Neggers et al., 2015). Diffusion imaging of postmortem tissue is a challenge with the use of conventional diffusion-weighted spin echo acquisitions in large post-mortem brains. For large brains that cannot fit into most scanners equipped with high-performance small-bore gradients, we used clinical scanners with custom-made MR coils.
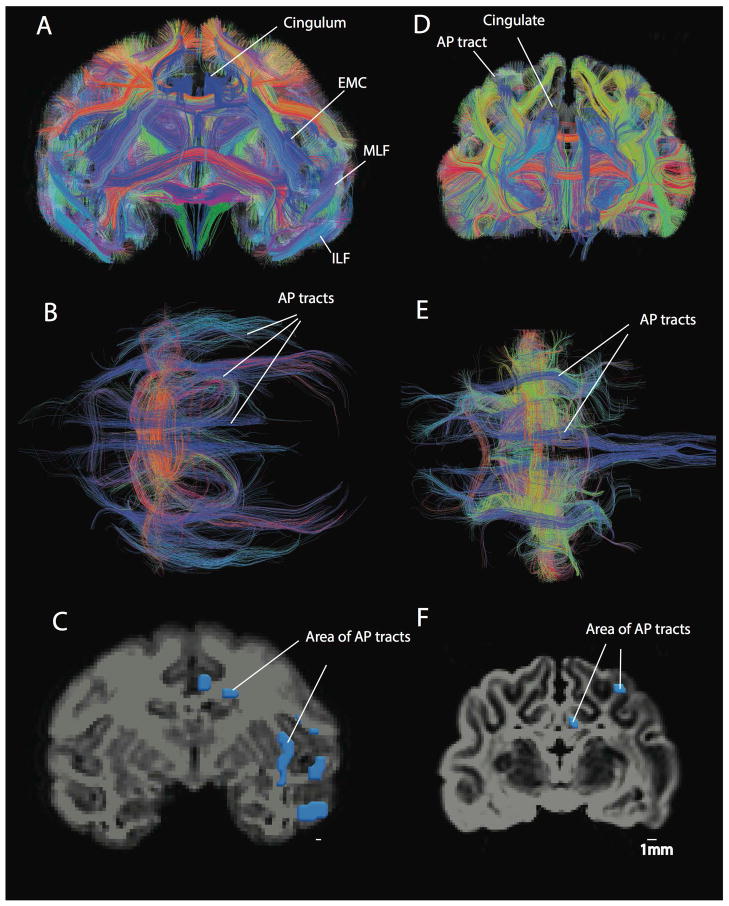
Figure 5.
Anterior-posterior corticocortical tracts in a macaque (A–C) and a cat (D–F). A number of anterior-posterior corticocortical tracts such as the inferior longitudinal fasciculus (ILF), the middle longitudinal fasciculus (MLF), the extreme capsule fibers (EMC) as well as the cingulum are observed within the white matter of the macaque isocortex. This is evident from coronal (A) and axial views (B). In contrast, a coronal (D) and an axial view (E) show that the cat possesses very few anterior-posterior cortical tracts. Regions of interest were used to measure the area of anterior-posterior corticocortical tracts in the macaque (C) and cat (F). The area of anterior-posterior cortical tracts was measured in a coronal section anterior/rostral to or at the level of the lateral geniculate nucleus. Anterior-posterior tracts are in blue. Tracts coursing lateral to medial are in red and tracts coursing across the dorsal-ventral axis are in yellow. Scale bar: 1mm.
Figure 9.
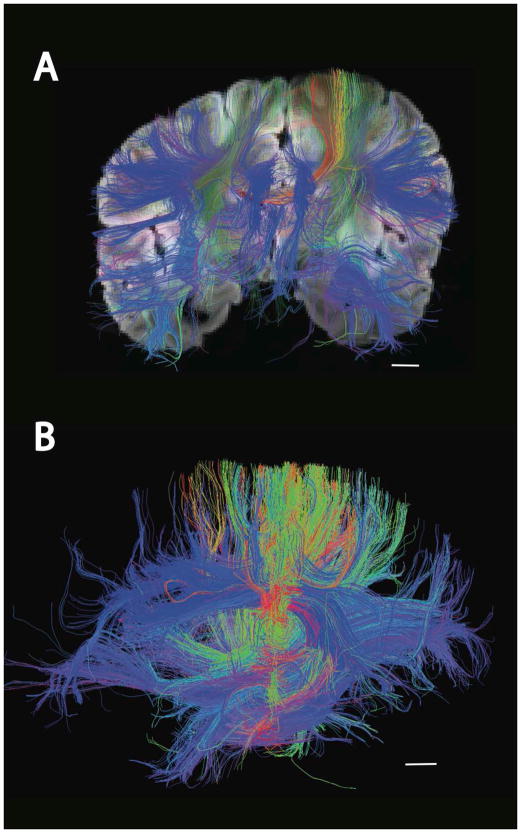
The human cortical white matter is characterized by a large number of anterior-posterior cortical tracts, which are visible from a coronal plane (A) as well as from lateral perspective (B). Scale bar: 10 mm.
Brains of a human, a hippopotamus, and a baboon were scanned in a 3T clinical Siemens scanner at the MGH Martinos Center for Biomedical Imaging Core Facility Martinos center (RRID:SCR_012324). We selected a steady-state free precession sequence with a repetition time (TR) of approximately 38 ms and an echo time (TE) of approximately 25 ms for diffusion acquisition (McNab et al., 2009). Forty-four diffusion-weighted images and four non diffusion-weighted images were acquired for each brain. Although the ideal number of directions is debatable for diffusion MR tractography, previous analyses suggest a minimum of 30 directions is necessary for accurate tract reconstruction (Jones et al., 2013). Brains of the human and baboon were imaged at an isotropic resolution of 1 mm3 and the brain of the hippopotamus was imaged at a resolution of 1.2 mm3.
Marmoset, mice, and rat brains were scanned in a 4.7 T Bruker Biospec MR system with a high-performance gradient and a radio-frequency coil that best fit the small brains at the MGH Martinos Center for Biomedical Imaging Core Facility Martinos center (RRID:SCR_012324). The pulse sequence used for diffusion acquisition was a 3D diffusion-weighted spin-echo echo-planar imaging sequence, TR/TE = 1000/40 ms. Sixty diffusion-weighted measurements and one non diffusion-weighted measurement were acquired, corresponding to a cubic lattice in Q-space at b = 4000 s/mm2 with δ = 12.0 ms, Δ = 24.2 ms. Spatial resolution was 0.14 × 0.11 × 0.17 mm for the mouse, 0.14 × 0.13 × 0.16 mm for the rat, and 0.23 × 0.25 × 0.28 mm for the marmoset.
To assess possible species differences in corticocortical tracts between primates and other mammals, we also included diffusion spectrum imaging (DSI; 27) scans of a cat brain at post-natal day 100 and a rhesus macaque brain (Figure 5). We had originally placed a rhesus macaque as well as brains of different species of similar size in the clinical scanner but DSI scans taken at a small-bore system yielded results that were much more similar to those reported by tract-tracing studies (Schmahmann et al., 2007; Kawamura and Otani, 1970, 1973a,b,c). We selected the DSI scans for these species. The parameters for the diffusion scan were identical to those described previously for the macaque and the cat (Takahashi et al., 2010, 2011). Briefly, the pulse sequence was a 3D diffusion-weighted spin-echo echo-planar imaging sequence with a repetition time of 1000 ms and echo time of 40 ms. Five hundred and fourteen diffusion-weighted measurements were acquired with a maximum radius b = 4 × 10⁴ s/mm2, with δ = 12.0 ms and Δ = 24.2 ms.
Diffusion MR tractography
Diffusion data were processed with Diffusion Toolkit (www.trackvis.org; RRID:SCR_004817). The HARDI and DSI reconstruction of streamline tract counts allows for multiple diffusion directions for each voxel. HARDI and DSI allow streamline tracts to continue in multiple directions at sites where tracks intersect. This approach is therefore theoretically superior at resolving crossing fibers than a tensor model. We used a FACT (fiber assessment by continuous tracking) algorithm to reconstruct streamline tracts. No fractional anisotropy threshold was applied in reconstructing tracts as done in other studies (Schmahmann et al., 2007; Takahashi et al., 2010, 2011). Tracking was terminated when the angle between 2 consecutive orientation vectors was greater than a given threshold (e.g., 45°). A 30–50° threshold was judged to be most representative of tracks in the examined species. Determining the ideal angular threshold within a tract is not clear, especially in species in which conventional tract-tracing studies are sparse or non-existent (e.g., hippopotamus). Different angle thresholds may be most suited for different types of tracts and for different species. Alterations in tracking parameters have the potential to influence a multitude of tracts within the entire brain. In selecting parameters, we carefully inspected tract-tracing studies in species such as cats, macaque monkeys, and mice (Kuypers et al., 1965; Pandya and Kuypers, 1969; Miller and Vogt, 1984; Schmahmann et al., 2007; Schmahmann and Pandya, 2009; Kawamura and Otani, 1970; Kawamura, 1973a,b,c; Oh et al., 2014). TrackVis (http://trackvis.org; RRID:SCR_004817) was used to visualize, and quantify anterior to posterior corticocortical tracts.
Tract selection and quantification
The aim of the present study was to identify whether primates exhibit evidence of increased intracortical connectivity. We focused on corticocortical tracts coursing across the anterior-posterior direction within the white matter of the cerebral cortex because these anterior to posterior pathways intra-connect the cerebral cortex (Schmahman et al., 2007; Kawamura and Otani, 1970; Kawamura, 1973a,b,c, d 2009; Oh et al., 2014). Tracts connecting cortical with subcortical regions (e.g., corticospinal tract, thalamocortical tracts) are oriented across the dorsal-ventral direction (Takahashi al., 2011; Glickstein et al., 1967). The directionality of tracts can therefore be used to identify projection patterns of long-range projecting neurons. We specifically chose not to identify the precise termination patterns of these anterior to posterior tracts because diffusion MR tractography can have difficulty resolving the precise terminations of tracts (Reveley et al., 2015). Although tracts coursing across the medial to lateral direction should project intra-cortically, we here do not focus on medial to lateral cortical tracts because those tracts appeared more error prone across diffusion MR scans. We focus on anterior to posterior cortical tracts, which only represent a subset of tracts that form long-range intra-cortical connections.
We identified tracts coursing anterior to posterior within the white matter of the isocortex from a single coronal plane. A coronal plane was examined at the level of, or rostral/anterior to, the lateral geniculate nucleus in the examined species. We avoided regions posterior or caudal to the lateral geniculate nucleus because the optic radiation courses across the anterior to posterior axis in primates and may be misinterpreted as a corticocortical tract coursing across the anterior to posterior axis. We drew a region of interest (ROI) through a single coronal section of the white matter to measure the area occupied by these corticocortical tracts aligned along the anterior-posterior axis. We did not include anterior to posterior cortical tracts coursing through the lateral limbic regions such as the olfactory cortex in these analyses because we are here concerned with the evolution of the isocortical connections. Although these anterior to posterior corticocortical tracts are not strictly homologous across species, such an analysis is instrumental in identifying whether primates exhibit more anterior-posterior cortical tracts compared with nonprimate mammals.
Statistical analyses
Species may be similar to each other because of shared ancestry. We therefore used phylogenetically controlled statistics to assess differences in neuron numbers, upper and lower layer neuron numbers between primates and other mammals. To assess whether primates deviate from other mammals in the number of total isocortical neuron numbers, upper and lower layer numbers, we used phylogeny generalized least squares (PGLS) to obtain phylogenetically controlled regressions of total isocortical neuron numbers, upper and lower layer neuron numbers versus brain size across 24 mammalian species. To identify differences between primates and nonprimate mammals, we obtained residuals derived for primates and other mammals from these PGLS regressions. We then performed t-tests to assess significant differences between primates and other mammals.
To assess whether the area of anterior to posterior cortical tracts is expanded in primates versus other mammals, we used PGLS regression of the area of anterior to posterior cortical tracts versus total isocortical neuron numbers and upper layer neuron numbers across a smaller sample of primate and non-primate species.
The phylogeny, which includes branch lengths for the species was taken from Bininda-Emonds et al. (Bininda-Emonds et al., 2007). The phylogeny used in the present study is shown in Figure 1. Regression parameters were found by maximum likelihood estimates and statistical analyses were performed with the R programming language (RRID:SCR_001905) and the software package ape.
Although we gathered stereological data in a total of 25 species (Figure 1, Table 1, 2), we only use 24 species for cross-species comparison of upper and lower layer neuron numbers. For PGLS analyses, the hamadryas baboon and the guinea baboon were averaged because only one species of baboon was listed in the phylogeny used for cross-species comparisons (Bininda-Emonds et al., 2007). For cross-species comparisons of upper and lower layer neurons, all brain weights were measured for the same individual with the exception of the cat. Brain weight data for the cat was obtained from a previous study (Bronson, 1979). Finally, the wildcat (Felis silvestris) was used in placed of the domestic cat (Felis catus) because Felis catus was not listed in the phylogeny used for phylogenetically controlled regressions.
Results
Scaling of isocortical neuron numbers across species
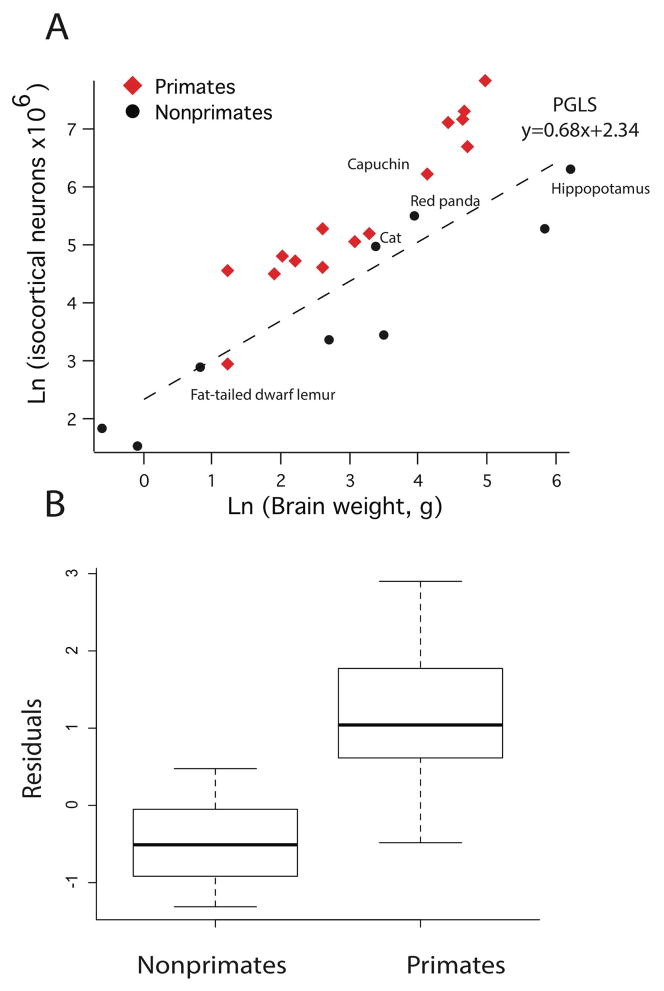
A comparative analysis of isocortical neuron numbers (i.e., upper and lower layer neuron numbers) versus brain weight across 24 mammalian species shows that primates possess proportionately more isocortical neurons per brain weight compared to nonprimates of similar overall brain size. As is evident in figure 10A, all primates with the exception of the fat-tailed dwarf lemur (n=2) possess more isocortical neurons per brain weight compared with nonprimate mammals when controlled for brain weight. For instance, the capuchin and the hippopotamus contain similar total isocortical neuron numbers but the hippopotamus brain (brain weight= 500 g) is more than five times larger than that of the capuchin brain (brain weight = 60 g). The number of isocortical neurons in carnivores (i.e., cat, red panda) is similar though slightly less than that observed in primates of similar overall brain size.
Figure 10.
A) The natural-log values of total isocortical neuron numbers are regressed against the natural-log values of brain weight (g) across 24 mammalian species. B) Box-plots of residuals derived from the phylogenetically-controlled linear regression of isocortical neuron numbers versus brain mass (g) show that primates contain more isocortical neurons per brain mass than nonprimate mammals.
To address whether primates possess significantly more isocortical neurons per brain mass compared with nonprimate mammals, we performed a linear regression of the natural-log values of isocortical neuron numbers against the natural-log values of brain weight across 24 mammalian species and extracted residuals (Figure 10A). All phylogenetically controlled analyses are of averaged values for species if samples per species are greater than 1 (Figure 1). Such an analysis shows that brain size predicts isocortical neuron numbers (adjusted R2 = 0.76; y = 0. 68x + 2.34; λ = 1) and that the residuals of primates (x̄ = 1.09; SE = 0.19; n = 15) are significantly greater compared with those of nonprimate mammals (x̄ = −0.39; SE= 0.20; n =9; t = −5.76, p < 0.05; 2.485×10⁻⁵; n = 24; Figure 10B). These findings demonstrate that primates contain disproportionately more isocortical neurons per brain mass compared to nonprimate mammals selected in our analysis.
Scaling of upper layer neuron numbers across species
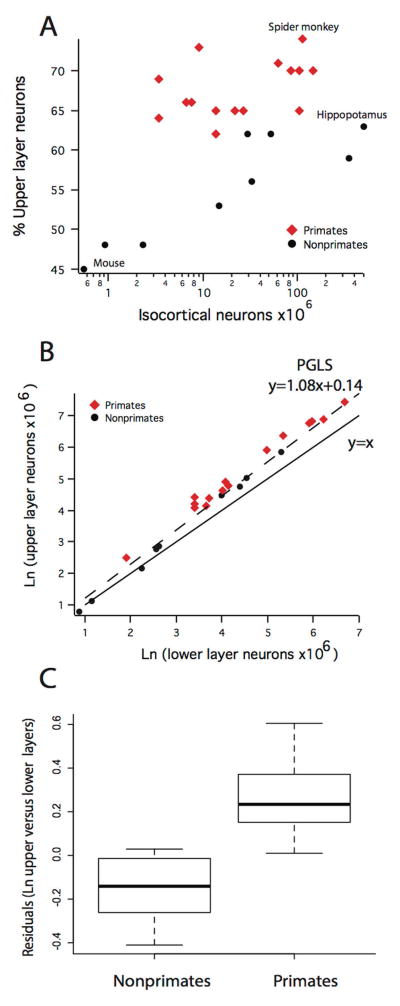
We quantified upper and lower layer neuron numbers separately to determine whether upper layer neuron numbers expand with a positive allometry compared to lower layer neuron numbers. Examples of delineations of upper and lower layer neurons are shown in Figures 2–4. In small rodent brains, such as mice, upper layer neuron numbers account for less than 50% of the total isocortical population (Fig. 11A). By contrast, in some of the largest primate brains such as a spider monkey and nonprimate brains such as the hippopotamus analyzed, upper layer neuron numbers account for 73% and 65% of isocortical neurons, respectively (Fig. 11A). A phylogenetically controlled linear regression of the natural-log values of upper layer neuron versus lower layer neuron numbers across the 24 studied mammals shows that upper layer neurons increase with a slope greater than 1 (slope: 1.08; SE = 0.03) relative to the natural-log values of lower layer neuron numbers (y = 1.08x + 0.14; adjusted R2 = 0.98; n=24; λ = 0.86; Figure 11B). These findings demonstrate that upper layer neuron numbers expand with a positive allometry such that upper layer neuron numbers become disproportionately more numerous relative to lower layer neuron numbers as overall isocortical neuron numbers increase. Given that primates possess more isocortical neuron numbers per brain mass compared with other studied mammals, primates also possess more upper layer neurons compared with nonprimate mammals of similar brain size.
Figure 11.
A) Upper layer neuron numbers relative to total isocortical neuron numbers are regressed against isocortical neuron numbers in primates and nonprimate mammals. These data show that primates possess proportionately more upper layer neurons compared with nonprimate mammals. B) Natural-log values of upper layer neuron numbers versus the natural-log values of lower layer neuron numbers across the studied 24 mammalian species. Upper layer neuron numbers expand with a positive allometry relative to lower layer neuron numbers. (C) Residuals derived from the phylogenetically controlled regression of upper versus lower layer neuron numbers across 24 mammalian species show that primates possess disproportionately more upper layer neurons than nonprimate species.
Primates have more upper layer neurons compared with other mammals
As is evident in Figure 11A, all examined primate species (i.e., strepsirrhines, New World monkeys, Old World monkeys) have proportionately more upper layer neuron numbers than nonprimate mammals when total isocortical neuron numbers are accounted for. The number of upper layer neurons relative to total isocortical neuron numbers range between 61 to 73% in primates. In contrast, the proportion of upper layer neurons to total isocortical neurons in nonprimate mammals ranges between 42 to 63% such that nonprimates have proportionately fewer upper layer neurons compared with primates.
To address whether primates exhibit significantly more upper layer neurons compared with nonprimate mammals when controlled for lower layer neuron numbers, we extracted residuals from the phylogenetically controlled linear regression of the natural-log values of upper layer neuron numbers versus the natural-log values of lower layer neuron numbers across our samples of 24 studied primate and nonprimate species (Figure 11B, C). We found that the residuals of primates (x̄ = 0.26; SE = 0.04; n = 15) were significantly greater compared with the residuals (x̄ = −0.15; SE = 0.05; n = 9) obtained for nonprimate mammals (t = −6.33; p < 0.01, p= 5.313×10⁻⁶; Figure 11C). These findings demonstrate that primates contain disproportionately more upper layer neurons compared to nonprimate mammalian species after controlling for lower layer neuron numbers.
Primates have more anterior to posterior corticocortical tracts compared with other mammals
In comparing corticocortical tracts across species, we chose not to identify the precise termination patterns of tracts because diffusion MR tractography may not fully resolve the precise terminations of tracts. Instead, we focused on tracts coursing across the anterior-posterior axis within the white matter of the cerebral cortex because these tracts are highly likely to intra-connect the cerebral cortex.
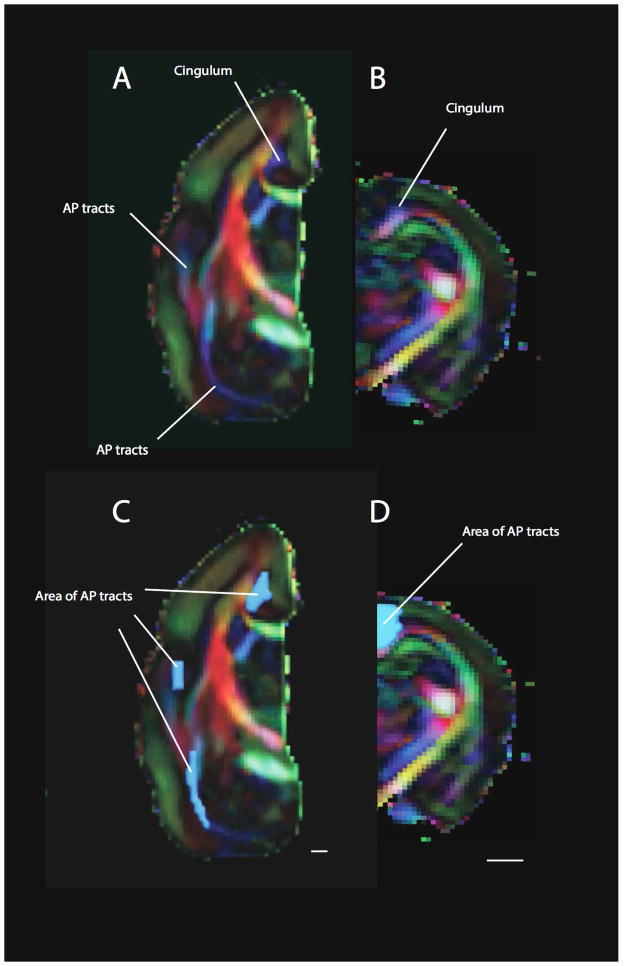
We quantified the area of corticocortical tracts coursing across the anterior-posterior direction in a coronal plane through the white matter of primates and nonprimate species (Figs. 5–9). We selected a smaller sample of species for comparative analyses of diffusion MR tractography. Primates exhibit a number of distinct and identifiable anterior-posterior corticocortical tracts but nonprimate mammals exhibit fewer of these anterior to posterior cortical tracts. For instance, the rhesus macaque exhibits many anterior-posterior tracts such as the inferior longitudinal fasciculus, the middle longitudinal fasciculus, and the extreme capsule (Fig. 5A–C). In contrast, the cat exhibits only two anterior-posterior cortical tracts coursing through the white matter (Fig. 5D–F). Other non-human primates such as the marmoset and the baboon are similar to the rhesus macaque in exhibiting a number of anterior-posterior corticocortical tracts distributed throughout the white matter (Figs. 6–7). The elevated number of anterior to posterior corticocortical tracts observed in the marmoset, the rhesus macaque and the baboon stand in contrast with those observed in nonprimate mammals such as rat, mice, cat, and hippopotamus, which only exhibit one or two anterior-posterior corticocortical tracts (Figs. 5–9).
Figure 6.
FA maps can also highlight differences in connectivity patterns between primates and rodents. The FA color maps show vectors aligned along the anterior to posterior axis in blue, vectors aligned along the right to left direction in green and vectors aligned along the top to bottom axis in red. Tracts coursing across the anterior to posterior axis are in blue. A) A number of tracts within the white matter of the cortex course across the anterior to posterior axis (shown in blue) in the marmoset. This is in contrast with the rat (B), where a very small area within the cortical white matter is blue, which represent anterior to posterior cortical tracts. Areas of anterior-posterior corticocortical tracts measured in the white matter of the marmoset (C) and rat (D) are shown. Scale bar: 1mm.
Figure 7.
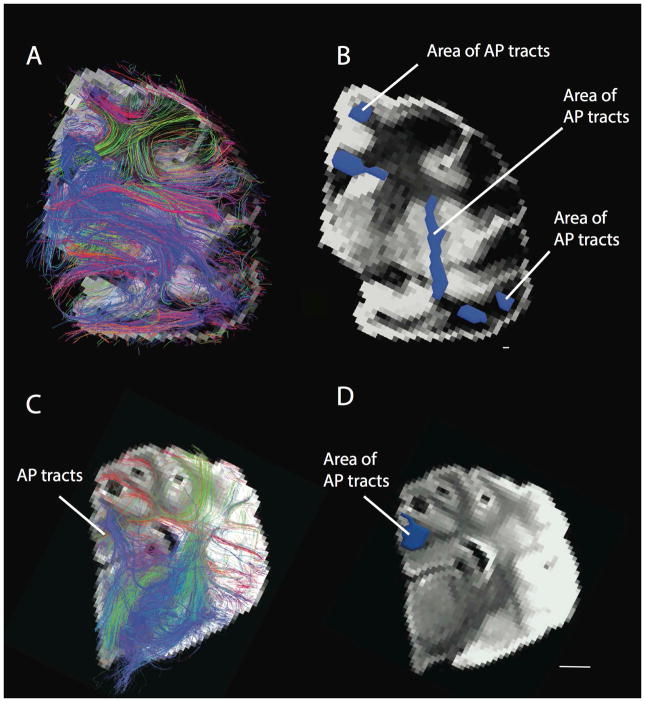
Anterior-posterior corticocortical tracts in the baboon (A, B) and a hippopotamus (E, F). The baboon exhibits a number of anterior to posterior cortical tracts distributed throughout the white matter of the isocortex. Regions of interest were used to measure the area of anterior to posterior corticocortical tracts in the baboon (B) and hippopotamus (F). Whereas the baboon exhibits a number of anterior to posterior corticocortical tracts, anterior-posterior tracts were only observed medially within the white matter (i.e., the cingulum) of the hippopotamus. Anterior-posterior tracts within the limbic system were not included in this analysis because we are focused on the evolution of the isocortex. Anterior-posterior (AP) tracts are in blue. Scale bar in A–B: 1mm; Scale bar in C–D: 10mm.
The observed differences in the number of anterior to posterior cortical tracts between primates and nonprimates are not simply because the selected primates have larger brains compared with nonprimate mammals. Brain weights of nonprimate mammals used for the diffusion MR tractography varied between 0.55 to 500 g (average brain weight= 133 g). Brains of nonhuman primate species ranged between 7 to 180 grams (average brain weight= 93.66 g). Although the brain weights of nonprimate mammals is on average greater than that of primate species in our sample, the area of anterior to posterior cortical tracts of primates (x̄ = 52.4; SE = 12.54; n = 3) is more than four times greater relative to that observed in nonprimates (x̄ = 11.52; SE = 3.53; n = 4). We illustrate further that primates possess a disproportionately larger area of anterior to posterior cortical tracts compared with nonprimate mammals when adjusted for brain size. We observe that the area of anterior to posterior cortical tracts in marmoset (28.59 mm2) is roughly twice as large as that of the hippopotamus (13.18 mm2) despite the brain of the marmoset being more than 50 times smaller than that of the hippopotamus (Table 3). As another example, the area of anterior to posterior cortical tracts in the marmoset (28.59 mm2) is larger than that of the cat (20.37 mm2) despite the marmoset’s brain being smaller than that of the cat (Table 3). Taken together, these observations imply that primates exhibit more anterior-posterior corticocortical tracts than nonprimates for a given brain size.
Table 3.
Area of AP (anterior to posterior) cortical tracts measured in the study.
| Common name | Species name | Area of AP cortical tracts |
|---|---|---|
| Marmoset | Callithrix jacchus | 28.59 |
| Cat | Felis catus | 20.37 |
| River hippopotamus | Hippopotamus amphibious | 13.18 |
| Human | Homo sapiens | 395.88 |
| Rhesus macaque | Macaca mulatta | 57.64 |
| Wild-type mouse | Mus musculus | 3.54 |
| Wild-type mouse | Mus musculus | 3.77 |
| Baboon | Papio papio | 71.09 |
| Rat | Rattus norvegicus | 8.88 |
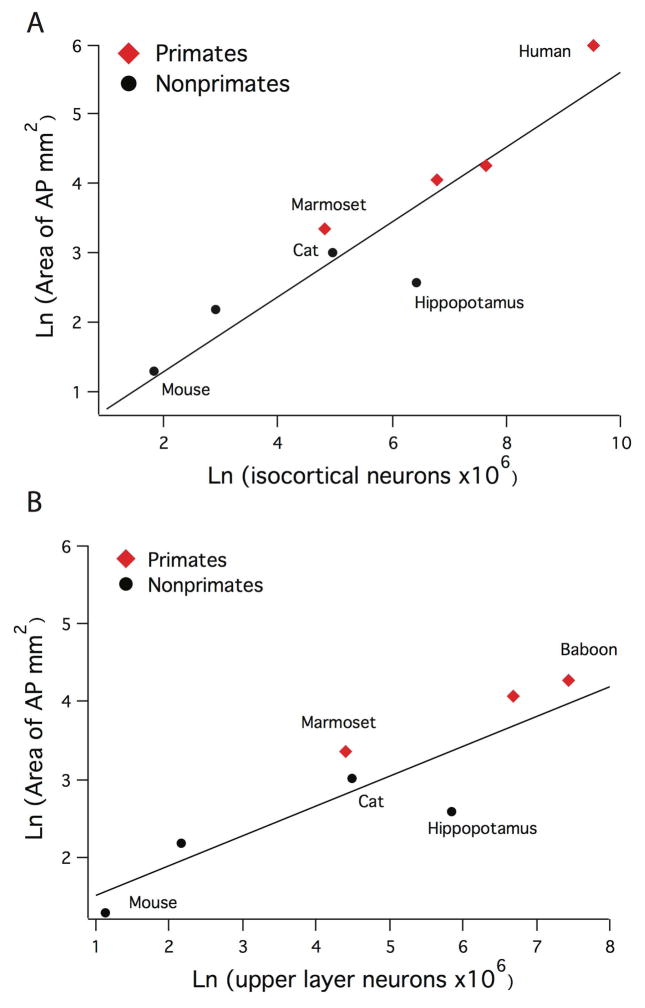
We investigated whether overall isocortical neuron numbers predict the area of anterior-posterior cortical tracts across the examined species such that we could include humans in our comparative analysis. We used previously reported data on isocortical neuron numbers for humans, which were obtained with the optical disector method (Braendgaard et al., 1990). A phylogenetically controlled regression of the natural-log values of the area of anterior-posterior cortical tracts against the natural-log values of isocortical neuron numbers significantly covary (adjusted R2 = 0.80) across the studied 8 mammalian species (Figure 12A). Humans possess more isocortical neurons than any of the examined species and the greatest area of anterior to posterior cortical tracts of any of the examined species. Whether humans depart from the expected allometry derived for nonhuman mammals is difficult to determine given our sample size.
Figure 12.
A) The area of anterior-posterior tracts scale with total isocortical neuron numbers across 8 mammalian species. The human appears to exhibit disproportionately more anterior-posterior corticocortical tracts but our small sample of brains, ranging between 0.5 and 500 g, makes it difficult to conclusively determine whether the large-brained human deviates from the expected allometry of other mammals. B) The area of upper layer neuron numbers scale with upper layer neuron numbers across the studied 7 mammalian species.
To assess whether anterior-posterior cortical tracts become amplified as a function of upper layer neuron numbers, we performed a phylogenetically controlled regression of the natural-log values of the area of anterior-posterior cortical tracts against the natural-log values of upper layer neuron numbers across 7 non-human mammalian species (Fig. 12B; Table 3). This analysis shows that upper layer neurons predict the area of anterior-posterior cortical tracts across the studied mammalian species (adjusted R2 = 0.66). Overall, the findings from the present study demonstrate that the area of anterior-posterior tracts scale with isocortical and upper layer neuron numbers across the studied mammals. Primates possess more isocortical neurons per brain mass, disproportionately more upper layer neurons and thus more anterior-posterior cortical tract compared with nonprimate mammals.
Discussion
The data obtained from the present study highlights that the primate isocortex differs from other mammals in possessing proportionately more tracts in primates versus non-primates, which suggests that primates possess increased cortico-cortical connectivity relative to other studied mammals. This conclusion is supported by the observation that primates possess disproportionately more upper layer neurons and a greater area of anterior to posterior long-range projecting corticocortical tracts compared with other studied mammals. Below, we discuss the limitations of the present study, the study’s implications for the developmental processes that account for the finding that upper layer number numbers are disproportionately expanded in primates.
Limitations
The different scanning procedures used to compare corticocortical tracts may possibly introduce methodological variation in reconstructing tracts across species. For these reasons, we focus on corticocortical tracts that course across the anterior-posterior axis and we do not consider their precise terminations. The anterior to posterior corticocortical tracts we observed with the use of diffusion MRI scans are highly consistent with previous tract-tracing studies. For example, tract-tracing and lesion studies of macaques have reported a number of anterior-posterior cortical tracts coursing through the white matter of the isocortex (e.g., the superior, middle, and inferior longitudinal fasciculi, and the arcuate fasciculus, Schmahmann et al., 2007; Schmahmann and Pandya, 2009). Previous reports also showed that nonprimate mammals, such as cats and mice exhibit few anterior to posterior cortical tracts (Kawamura and Otani, 1970; Kawamura, 1973a,b,c). For instance, Kawamura, 1973a,b,c reported two anterior to posterior cortical tracts in the cat and his descriptions of cross-cortical connectivity patterns are highly similar to that observed in our DSI tractography of the cat brain. Cross-species comparisons of anterior to posterior cortical tracts only measure a subset of corticocortical tracts and do not capture corticocortical tracts coursing across the medial to lateral direction. The present study only focuses on anterior to posterior cortical tracts because these tracts were highly consistent with previous tract-tracer studies.
We quantify upper layer neuron numbers to assess evolutionary changes in cortical connectivity patterns between primates and other mammals. One caveat of the conclusion drawn from this analysis is that it does not consider potential evolutionary changes in cortical connectivity patterns of lower layer neuron numbers, some of which form projections with other cortical neurons (e.g., callosal, corticocortical, and feedback projections; Barbas, 1986; Hof et al., 1995). The number of lower layer neurons projecting cross-cortically is not known, yet many lower layer neurons project cross-cortically (Kennedy and Bullier, 1985; Hattox and Nelson, 2007; Sincich et al, 2010; Glickfeld et al., 2013). The present study does not consider possible evolutionary changes in cross-cortically projecting lower layer neurons between primates and other mammals. Nonetheless, despite these limitations it is noteworthy that both methods point to the conclusion that primates deviate from other mammals in possessing increased cross-cortical integration.
Expansion of upper layer neuron numbers in primates and its developmental implications
The isocortex of primates is disproportionately expanded and contains more isocortical neurons relative to many other mammals (Barton and Harvey, 2000; Charvet et al., 2015; Zeng et al., 2012; Striedter, 2005). The finding that a broad range of primate species including strepsirrhines, New World monkeys, and Old World monkeys exhibit disproportionately more upper layer neurons compared with other studied taxa, such as rodents, implies that the expansion of upper layer neurons occurred early in primate evolution.
The disproportionate expansion of isocortical neuron numbers, and in particular upper layer neurons is concomitant with selective delays in isocortical neurogenesis during development in primates relative to rodents (Clancy et al., 2001; Rakic, 2002; Workman et al., 2013). Primates lengthen the period of upper layer neurogenesis compared with rodents. Prolonging isocortical neurogenesis and specifically upper layer neurogenesis entails that progenitor cells that give rise to upper layer neurons undergo increased rounds of cell divisions (Finlay et al., 1998; Rakic, 2002; Smart et al., 2002; Workman et al., 2013; Cahalane et al., 2014), which should serve to produce an expansion of upper layer neurons in the adult primate isocortex (Finlay and Darlington, 1995; Charvet et al., 2015; Rakic, 2002; Workman et al., 2013; Finlay et al., 1998; Smart et al., 2002; Cahalane et al., 2014; Dehay et al., 2015). The present study confirms the prediction that selective delays in upper layer neurogenesis serve to produce a disproportionate expansion of upper layer neurons. The study further shows that the consequence of prolonging isocortical neurogenesis is that the primate isocortex possesses increased cross-cortical connectivity and anterior to posterior cross-cortical integration relative to a number of other mammals.
Figure 3.
Examples of delineations used to identify upper (UL) and lower layers (LL) in a pygmy marmoset (A, B), a hippopotamus (B, C). There is extensive variation in layer IV such that the presence of layer V neurons was used to distinguish upper versus lower layer neurons. In the motor cortex, upper and lower layers were distinguished by large cells located in layer V. Within other regions, such as the primary somatosensory cortex, upper layers were distinguished by the presence of granular cells located in layer IV. In some species such as the hippopotamus, layer IV was difficult to identify. The presence of large cells in layer V was used to distinguish upper from lower layers. Scale bar: 1.5 mm.
Figure 8.
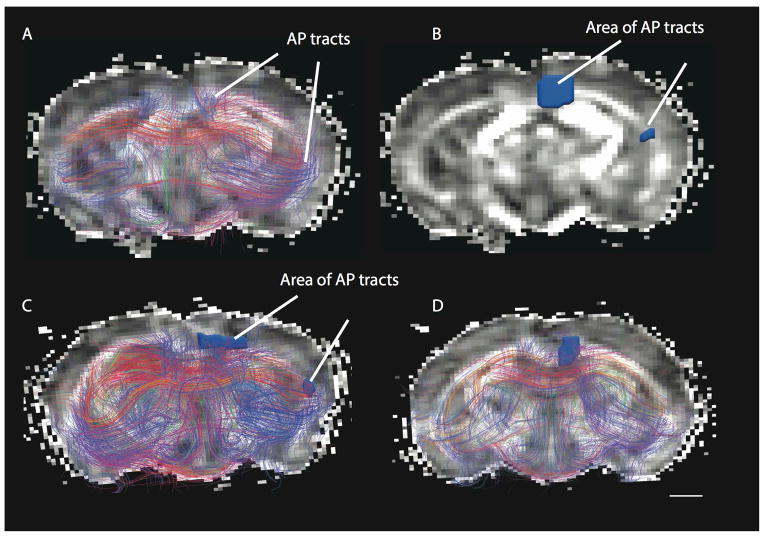
Representative anterior-posterior cortical tracts in two mice specimens (A–B) and (C). Anterior-posterior (AP) tracts are in blue. Background coronal planes are fractional anisotropy images. Scale bar: 1 mm.
Acknowledgments
Funding
Grant sponsor: National Institutes of Health; Grant numbers R01 HD078561, R21 HD069001, and R03 NS091587 to E.T. Grant sponsor: the James S. McDonnell Foundation: Grant numbers# 220020293 to C.C.S).
We thank Drs. Shyam Srinivasan and Charles Stevens for kindly lending histological material. We also thank Lindsey Vedder, Cheryl Stimpson, Adrien Meguerditchian, Young Do Kim, Drs. Kebreten Manaye Guangping Dai and Ruopeng Wang for technical assistance, advice, and specimens.
Role of authors
All authors had full access to all the data in the study and take responsibility for the integrity of the data and the accuracy of the data analysis. Study concept and design: CJC; Acquisition of data: CJC, ET, AJVDK; Analysis and interpretation of data: CJC; Drafting of the manuscript: CJC; Statistical analysis: CJC; Obtained funding: CCS; PRH; Administrative, technical, and material support: MAR; PRH, AJVDK, CCS, ET. All authors critically read and contributed to the writing of the manuscript.
Footnotes
Literature cited
- Barbas H. Pattern in the laminar origin of corticocortical connections. J Comp Neurol. 1986;252:415–422. doi: 10.1002/cne.902520310. [DOI] [PubMed] [Google Scholar]
- Barton RA, Harvey PH. Mosaic evolution of brain structure in mammals. Nature. 2000;405:1055–1058. doi: 10.1038/35016580. [DOI] [PubMed] [Google Scholar]
- Bininda-Emonds OR, et al. The delayed rise of present-day mammals. Nature. 2007;446:507–12. doi: 10.1038/nature05634. [DOI] [PubMed] [Google Scholar]
- Butti C, et al. The cerebral cortex of the pygmy hippopotamus, Hexaprotodon liberiensis (Cetartiodactyla, Hippopotamidae): MRI, cytoarchitecture, and neuronal morphology. Anat Rec. 2014;297:670–700. doi: 10.1002/ar.22875. [DOI] [PubMed] [Google Scholar]
- Braendgaard H, Evans SM, Howard CV, Gundersen HJG. The total number of neurons in the human neocortex unbiasedly estimated using optical disectors. J Microsc. 1990;157:285–304. doi: 10.1111/j.1365-2818.1990.tb02967.x. [DOI] [PubMed] [Google Scholar]
- Bronson RT. Brain Weight-Body Weight scaling in breeds of dogs and cats. Brain Behav Evol. 1979;16:227–236. doi: 10.1159/000121839. [DOI] [PubMed] [Google Scholar]
- Cahalane DJ, Charvet CJ, Finlay BL. Modeling local and cross-species neuron number variations in the cerebral cortex as arising from a common mechanism. Proc Natl Acad Sci USA. 2014;111:17642–17647. doi: 10.1073/pnas.1409271111. [DOI] [PMC free article] [PubMed] [Google Scholar]
- Carlo CN, Stevens CF. Analysis of differential shrinkage in frozen brain sections and its implications for the use of guard zones in stereology. J Comp Neurol. 2011;519:2803–10. doi: 10.1002/cne.22652. [DOI] [PubMed] [Google Scholar]
- Callaway EM. Local circuits in primary visual cortex of the macaque monkey. Annu Rev Neurosci. 1998;21:47–74. doi: 10.1146/annurev.neuro.21.1.47. [DOI] [PubMed] [Google Scholar]
- Charvet CJ, Cahalane DJ, Finlay BL. Systematic, cross-cortex variation in neuron numbers in rodents and primates. Cereb Cortex. 2015;25:147–160. doi: 10.1093/cercor/bht214. [DOI] [PMC free article] [PubMed] [Google Scholar]
- Charvet CJ, Reep RL, Finlay BL. Evolution of cytoarchitectural landscapes in the mammalian isocortex: Sirenians (Trichechus manatus) in comparison with other mammals. J Comp Neurol. 2016;524:772–82. doi: 10.1002/cne.23864. [DOI] [PMC free article] [PubMed] [Google Scholar]
- Christensen JR, et al. Neocortical and hippocampal neuron and glial cell numbers in the rhesus monkey. Anat Rec. 2007;290:330–40. doi: 10.1002/ar.20504. [DOI] [PubMed] [Google Scholar]
- Clancy B, Darlington RB, Finlay BL. Translating developmental time across mammalian species. Neuroscience. 2001;105:7–17. doi: 10.1016/s0306-4522(01)00171-3. [DOI] [PubMed] [Google Scholar]
- Dehay C, Kennedy H, Kosik KS. The outer subventricular zone and primate- specific cortical complexification. Neuron. 2015;85:683–94. doi: 10.1016/j.neuron.2014.12.060. [DOI] [PubMed] [Google Scholar]
- Finlay BL, Darlington RB. Linked regularities in the development and evolution of mammalian brains. Science. 1995;268:1578–1584. doi: 10.1126/science.7777856. [DOI] [PubMed] [Google Scholar]
- Finlay BL, Hersman MN, Darlington RB. Patterns of vertebrate neurogenesis and the paths of vertebrate evolution. Brain Behav Evol. 1998;52:232–42. doi: 10.1159/000006566. [DOI] [PubMed] [Google Scholar]
- Frost DO, Caviness VS. Radial organization of thalamic projections to the neocortex in the mouse. J Comp Neurol. 1980;194:369–393. doi: 10.1002/cne.901940206. [DOI] [PubMed] [Google Scholar]
- Gilbert CD, Kelly JP. The projections of cells in different layers of the cat’s visual cortex. J Comp Neurol. 1975;163:81–105. doi: 10.1002/cne.901630106. [DOI] [PubMed] [Google Scholar]
- Glickfeld LL, Andermann ML, Bonin V, Reid RC. Cortico-cortical projections in mouse visual cortex are functionally target specific. Nature Neurosci. 2013;16:219–226. doi: 10.1038/nn.3300. [DOI] [PMC free article] [PubMed] [Google Scholar]
- Glickstein M, King RA, Miller J, Berkley M. Cortical projections from the dorsal lateral geniculate nucleus of cats. J Comp Neurol. 1967;130:55–75. doi: 10.1002/cne.901300104. [DOI] [PubMed] [Google Scholar]
- Glaser EM, Wilson PD. The coefficient of error of optical fractionator population size estimates: a computer simulation comparing three estimators. J Microsc. 1998;192:163–171. doi: 10.1046/j.1365-2818.1998.00417.x. [DOI] [PubMed] [Google Scholar]
- Hattox AM, Nelson SB. Layer V neurons in mouse cortex projecting to different targets have distinct physiological properties. J Neurophysiol. 2007;98:3330–40. doi: 10.1152/jn.00397.2007. [DOI] [PubMed] [Google Scholar]
- Herculano-Houzel S. Neuronal scaling rules for primate brains: the primate advantage. Prog Brain Res. 2012;195:325–40. doi: 10.1016/B978-0-444-53860-4.00015-5. [DOI] [PubMed] [Google Scholar]
- Hof PR, Nimchinsky EA, Morrison JH. Neurochemical phenotype of corticocortical connections in the macaque monkey: Quantitative analysis of a subset of neurofilament protein-immunoreactive projection neurons in frontal, parietal, temporal, and cingulate cortices. J Comp Neurol. 1995;362:109–133. doi: 10.1002/cne.903620107. [DOI] [PubMed] [Google Scholar]
- Innocenti GM, Dyrby TB, Andersen KW, Rouiller EM, Caminiti R. The Crossed Projection to the Striatum in Two Species of Monkey and in Humans: Behavioral and Evolutionary Significance. Cereb Cortex. 2016 doi: 10.1093/cercor/bhw161. In Press. [DOI] [PubMed] [Google Scholar]
- Jones DK, Knösche TR, Turner R. White matter integrity, fiber count, and other fallacies: the do’s and don’ts of diffusion MRI. Neuroimage. 2013;73:239–254. doi: 10.1016/j.neuroimage.2012.06.081. [DOI] [PubMed] [Google Scholar]
- Kawamura K. Corticocortical fiber connections of the cat cerebrum. III. The occipital region. Brain Res. 1973a;51:41–60. doi: 10.1016/0006-8993(73)90364-8. [DOI] [PubMed] [Google Scholar]
- Kawamura K. Corticocortical fiber connections of the cat cerebrum. I. The temporal region. Brain Res. 1973b;51:1–21. doi: 10.1016/0006-8993(73)90362-4. [DOI] [PubMed] [Google Scholar]
- Kawamura K. Corticocortical fiber connections of the cat cerebrum. II. The parietal region. Brain Res. 1973c;51:23–40. doi: 10.1016/0006-8993(73)90363-6. [DOI] [PubMed] [Google Scholar]
- Kawamura K, Otani K. Corticocortical fiber connections in the cat cerebrum: the frontal region. J Comp Neurol. 1970;139:423–448. doi: 10.1002/cne.901390404. [DOI] [PubMed] [Google Scholar]
- Kennedy H, Bullier J. A double-labeling investigation of the afferent connectivity to cortical areas V1 and V2 of the macaque monkey. J Neurosci. 1985;10:2815–30. doi: 10.1523/JNEUROSCI.05-10-02815.1985. [DOI] [PMC free article] [PubMed] [Google Scholar]
- Kuypers HG, Szwarcbart MK, Mishkin M, Rosvold HE. Occipitotemporal corticocortical connections in the rhesus monkey. Exp Neurol. 1965;11:245–262. doi: 10.1016/0014-4886(65)90016-6. [DOI] [PubMed] [Google Scholar]
- McNab JA, Jbabdi S, Deoni SC, Douaud G, Behrens TE, Miller KL. High resolution diffusion-weighted imaging in fixed human brain using diffusion-weighted steady state free precession. Neuroimage. 2009;46:775–785. doi: 10.1016/j.neuroimage.2009.01.008. [DOI] [PubMed] [Google Scholar]
- Miller MW, Vogt BA. Direct connections of rat visual cortex with sensory, motor, and association cortices. J Comp Neurol. 1984;226:184–202. doi: 10.1002/cne.902260204. [DOI] [PubMed] [Google Scholar]
- Neggers SF, Zandbelt BB, Schall MS, Schall JD. Comparative diffusion tractography of corticostriatal motor pathways reveals differences between humans and macaques. J Neurophysiol. 2015;113:2164–72. doi: 10.1152/jn.00569.2014. [DOI] [PMC free article] [PubMed] [Google Scholar]
- Nudo RJ, Masterton RB. Descending pathways to the spinal cord, III: Sites of origin of the corticospinal tract. J Comp Neurol. 1990;296:559–583. doi: 10.1002/cne.902960405. [DOI] [PubMed] [Google Scholar]
- Oh SW, Harris JA, Ng L, Winslow B, Cain N, Mihalas S, Wang Q, Lau C, Kuan L, Henry AM, Mortrud MT, Ouellette B, Nguyen TN, Sorensen SA, Slaughterbeck CR, Wakeman W, Li Y, Feng D, Ho A, Nicholas E, Hirokawa KE, Bohn P, Joines KM, Peng H, Hawrylycz MJ, Phillips JW, Hohmann JG, Wohnoutka P, Gerfen CR, Koch C, Bernard A, Dang C, Jones AR, Zeng H. A mesoscale connectome of the mouse brain. Nature. 2014;508:207–214. doi: 10.1038/nature13186. [DOI] [PMC free article] [PubMed] [Google Scholar]
- Pandya DN, Kuypers HG. Cortico-cortical connections in the rhesus monkey. Brain Res. 1969;13:13–36. doi: 10.1016/0006-8993(69)90141-3. [DOI] [PubMed] [Google Scholar]
- Rakic P. Pre and post-development of neurogenesis in primates. Clin Neurosci Res. 2002;2:29–32. [Google Scholar]
- Reveley C, et al. Superficial white matter fiber systems impede detection of long-range cortical connections in diffusion MR tractography. Proc Natl Acad Sci USA. 2015;112:E2820–8. doi: 10.1073/pnas.1418198112. [DOI] [PMC free article] [PubMed] [Google Scholar]
- Sincich LC, Jocson CM, Horton JC. V1 interpatch projections to v2 thick stripes and pale stripes. J Neurosci. 2010;30:6963–74. doi: 10.1523/JNEUROSCI.5506-09.2010. [DOI] [PMC free article] [PubMed] [Google Scholar]
- Schmahmann JD, Pandya DN, Wang R, Dai G, D’Arceuil HE, de Crespigny AJ, Wedeen VJ. Association fibre pathways of the brain: parallel observations from diffusion spectrum imaging and autoradiography. Brain. 2007;130:630–53. doi: 10.1093/brain/awl359. [DOI] [PubMed] [Google Scholar]
- Schmahmann JD, Pandya D. Fiber pathways of the brain. OUP; USA: 2009. [Google Scholar]
- Striedter GF. Principles of Brain Evolution. Sunderland: Sinauer Assoc; 2005. [Google Scholar]
- Smart IH, Dehay C, Giroud P, Berland M, Kennedy H. Unique morphological features of the proliferative zones and postmitotic compartments of the neural epithelium giving rise to striate and extrastriate cortex in the monkey. Cereb Cortex. 2002;12:37–53. doi: 10.1093/cercor/12.1.37. [DOI] [PMC free article] [PubMed] [Google Scholar]
- Takahashi E, et al. Development of cerebral fiber pathways in cats revealed by diffusion spectrum imaging. Neuroimage. 2010;49:1231–40. doi: 10.1016/j.neuroimage.2009.09.002. [DOI] [PMC free article] [PubMed] [Google Scholar]
- Takahashi E, et al. Developing neocortex organization and connectivity in cats revealed by direct correlation of diffusion tractography and histology. Cereb Cortex. 2011;21:200–11. doi: 10.1093/cercor/bhq084. [DOI] [PMC free article] [PubMed] [Google Scholar]
- Wedeen VJ, Hagmann P, Tseng WY, Reese TG, Weisskoff RM. Mapping complex tissue architecture with diffusion spectrum magnetic resonance imaging. Magn Reson Med. 2005;54:1377–86. doi: 10.1002/mrm.20642. [DOI] [PubMed] [Google Scholar]
- West MJ, Slomianka L, Gundersen HJ. Unbiased stereological estimation of the total number of neurons in the subdivisions of the rat hippocampus using the optical fractionator. Anat Rec. 1991;231:482–97. doi: 10.1002/ar.1092310411. [DOI] [PubMed] [Google Scholar]
- Williams RW, Rakic P. Three-dimensional counting: an accurate and direct Method to estimate numbers of cells in sectioned material. J Comp Neurol. 1988;278:344–52. doi: 10.1002/cne.902780305. [DOI] [PubMed] [Google Scholar]
- Williams RW, von Bartheld CS, Rosen GD. Counting cells in sectioned material: a suite of techniques, tools, and tips. Curr Protoc Neurosci. 2003;Chapter 1(Unit 1.11) doi: 10.1002/0471142301.ns0111s24. [DOI] [PubMed] [Google Scholar]
- Workman AD, Charvet CJ, Clancy B, Darlington RB, Finlay BL. Modeling transformations of neurodevelopmental sequences across mammalian species. J Neurosci. 2013;33:7368–83. doi: 10.1523/JNEUROSCI.5746-12.2013. [DOI] [PMC free article] [PubMed] [Google Scholar]
- Zeng H, et al. Large-scale cellular-resolution gene profiling in human neocortex reveals species-specific molecular signatures. Cell. 2012;149:483–496. doi: 10.1016/j.cell.2012.02.052. [DOI] [PMC free article] [PubMed] [Google Scholar]


