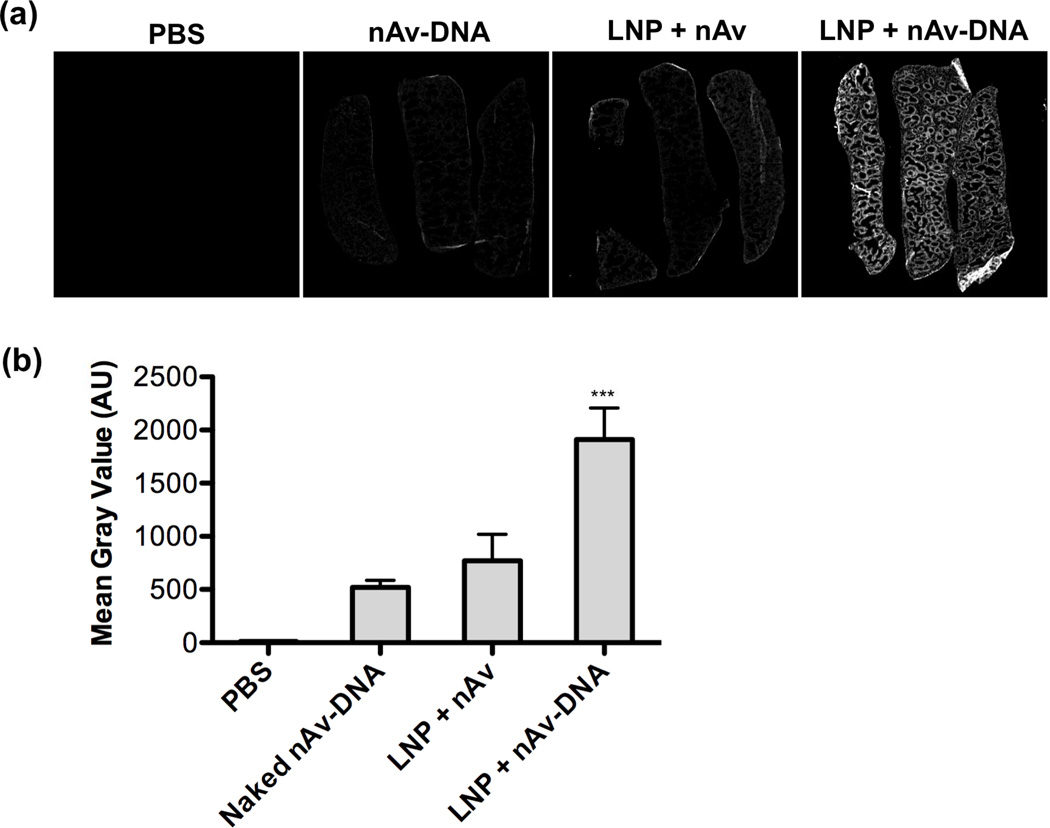
Figure 5.
(a) Near-infrared fluorescence scans of Cy5.5 signal in spleen sections harvested from mice 2 h after IV injection of the indicated Cy5.5-labeled nAv treatments. (b) Quantification of mean gray values of spleens for each group (n = 3). *** indicates p < 0.001 comparing LNP + nAv-DNA treatment to all other control treatments.

