Abstract
Introduction
Extended transrectal ultrasound-guided prostate biopsy is a state-of-the-art tool for prostate cancer detection. Nevertheless, approximately 1/3 of cancers are missed when using this method and repeat biopsy sessions are often required. The aim of this study was to investigate how sampling density (a compound variable reflecting the number of biopsy cores and prostate volume) impacts on detection rate in multiple repeat TRUS-biopsies.
Material and methods
A total of 1007 consecutive patients undergoing their 1st, 2nd, 3rd and any further repeat prostate biopsies were included. The relationship between sampling density and other clinical variables (age, prostate-specific antigen level, free/total PSA ratio, digital rectal examination, number of previous biopsies) and cancer detection rate were assessed by interaction analysis.
Results
There were 562 primary re-biopsies, 267 second re-biopsies and 178 third and further re-biopsies included in the study. Detection rate was 25.4%, 25.8% and 25.3%, respectively. Interaction of sampling density with age was demonstrated in patients undergoing their first repeat biopsy (but not further re-biopsies). No interaction was observed with other variables investigated.
Conclusions
A more extensive prostate sampling leads to a higher cancer detection rate on repeat prostate biopsies, as shown previously. However, this effect seems to be particularly pronounced in men younger than 65 years undergoing their first repeat prostate biopsy.
Keywords: biopsy, cancer detection, prostate cancer
INTRODUCTION
In 2012, a total of 416,700 men were diagnosed with prostate cancer (PC) in Europe [1] and 241,700 in the USA [2], making PC the second and first, respectively, most frequent malignancy in the male population. Transrectal ultrasound-guided (TRUS) biopsy of the prostate has been a state-of-the-art tool for PC detection since the 1990´s, but it still fails to detect approximately one third of cancers actually present and repeat biopsy sessions are often necessary [3].
The shift from a sextant biopsy scheme to the currently used extended biopsy templates of 10–12 cores was prompted by evidence that increasing the number of biopsy cores leads to a higher cancer detection rate (DR) [4]. Adjusting the number of cores according to prostate size was the idea behind the Vienna nomogram that suggested the optimal number of cores based on a patient´s age and prostate volume [5]. One prospective randomized study has, however, questioned the nomogram´s utility [6] and in the extended biopsy era, it is no longer in use. Authors of current nomograms for the prediction of a positive TRUS-biopsy result have reported that sampling density (SD) – a compound variable taking into account prostate volume and the number of cores sampled at biopsy – was an independent predictor of cancer on biopsy [7]. In their multivariate model, SD outperformed prostate volume in terms of cancer prediction, underlining the assumption that the extent of sampling impacts on the biopsy outcome when it is related to prostate size. However, the optimal SD value has not been defined and little is known about its performance in different patient subgroups.
The aim of this study was to investigate the relationship between SD and prostate cancer DR in repeat prostate biopsies.
MATERIAL AND METHODS
The present study is based on 1007 consecutive repeat prostate biopsies performed in two tertiary care academic institutions (Department of Urology, 1st Faculty of Medicine and General Teaching Hospital and Department of Urology, 2nd Faculty of Medicine and Motol University Hospital, both in Prague, Czech Republic) between November 2008 and September 2014. Relevant patient data was extracted from a prospectively maintained, institutional review board-approved database and included patient date of birth, date of TRUS-biopsy, number of previous biopsy sessions, pre-biopsy prostate specific antigen (PSA) level, percent free PSA (fPSA), presence of a suspect lesion on digital rectal examination (DRE) or TRUS, prostate volume and the number of cores sampled. Age and other variables of interest were calculated based on these data.
For the calculation of SD, the original formula used by Chun et al. in their reference article [7] was retained. SD was therefore calculated as prostate volume in millilitres divided by the number of biopsy cores.
All TRUS-biopsies included in the study were performed after at least one negative TRUS-biopsy in an effort to diagnose suspected PC. Indications were persistently elevated or rising PSA level and/or a suspect DRE. Repeat biopsies under PC active surveillance protocols were excluded from analysis. PSA values were adjusted for patients treated with 5α-reductase inhibitors for a period of six months or more. All biopsies were performed under local anaesthetic with 10 mL of 1% trimecaine and under antibiotic prophylaxis, using a bi-planar TRUS probe and sampling a minimum of 10–12 cores. The biopsy template always included the peripheral zone, apex and DRE positive or TRUS positive lesions. Sampling of the transition zone was at the attending physician's with a hyphen (OC, JH, IM, RS) discretion, as well as the total number of cores.
Statistical analysis
All biopsies were categorised into one of three groups: 1st re-biopsy after an initial negative prostate biopsy (group A); 2nd re-biopsy (group B); and group C, encompassing the third and any further re-biopsies. For demographic and clinical data, mean ± standard deviation or median and inter-quartile range were computed for continuous variables; frequency and percentage for categorical variables. Univariate analyses were performed within each group using t-test or Mann-Whitney test for continuous variables and chi-square test for categorical variables. Univariate and multivariate logistic models were created in order to identify predictive factors for prostate cancer detection. Clinically relevant factors, significance of factors explored in the univariate analysis and potential interactions were considered in the multivariate models. Effect estimates, significance levels and odds ratios (OR) were calculated, where applicable. Probability properties of the models were presented graphically.
Multivariate logistic regression model was constructed on variables commonly available before each biopsy (age, PSA, free/total PSA ratio, DRE) or determined by the attending urologist during the biopsy session (SD). Collinearity of all variables was explored and found to be negligible in multivariate analysis. For group A (1st re-biopsy), each variable was included in the model as a main effect and its interaction with SD. Only significant or borderline effects were kept in the final model. The resulting model structure was employed for groups B and C in order to facilitate comparison among the analysed models.
All tests were considered significant at the level of α = 0.05.
RESULTS
A total of 1007 repeat biopsies were included in the study. Of those, 562 were primary re-biopsies after an initial negative prostate biopsy; 267 were second re-biopsies and 178 were performed as third (n = 115), fourth (n = 33), fifth (n = 18) or further (n = 12) re-biopsy. The third and any further re-biopsies were considered as one group for the purpose of our analysis.
Demographic and clinical characteristics for each group are listed in Table 1. Patients presenting for their 3rd or any other re-biopsy were generally older, had higher PSA levels and larger prostate glands. PC detection rate was virtually identical on the 1st, 2nd or any further re-biopsy, but this was at the cost of more aggressive prostate sampling by both median number of cores and sampling density in groups B and C compared with group A.
Table 1.
Demographic and clinical variables of the study population
| Variable | Total n = 1007 |
1st re-biopsy n = 562 |
2nd re-biopsy n = 267 |
3rd+ re-biopsy n = 178 |
p |
|---|---|---|---|---|---|
| Age (years), mean ±StD median ≥65.0 >65.0 |
66.1 ±7.24 66.3 430 (42.7%) 577 (57.3%) |
65.7 ±7.72 65.8 260 (46.3%) 302 (53.7%) |
65.5 ±6.58 65.7 120 (44.9%) 147 (55.1%) |
68.3 ±6.14 68.2 50 (28.1%) 128 (71.9%) |
<0.01 |
| PSA (ng/mL), mean ±StD median ≤4.0 4.1-10.0 >10.0 |
9.56 ±6.84 7.65 102 (10.1%) 617 (61.3%) 288 (28.6%) |
8.49 ±5.80 7.05 75 (13.4%) 361 (64.2%) 126 (22.4%) |
9.16 ±5.68 7.70 19 (7.1%) 175 (65.6%) 73 (27.3%) |
13.57 ±9.53 9.95 8 (4.5%) 81 (45.5%) 89 (50.0%) |
<0.01 |
| f/t PSA (%), mean ±StD median |
15.6 ±6.7 15.0 |
16.1 ±6.9 15.4 |
15.3 ±6.4 14.9 |
14.6 ±6.4 13.5 |
0.04 |
| DRE positivity | 209 (20.8%) | 127 (22.6%) | 48 (18.0%) | 34 (19.1%) | 0.26 |
| Prostate volume (mL), mean± StD median <30 31-60 61-100 >100 |
51.7 ±27.4 47 231 (22.9%) 487 (48.4%) 230 (22.8%) 57 (5.7%) |
50.4 ±27.5 45 136 (24.3%) 271 (48.2%) 123 (21.9%) 30 (5.4%) |
52.1 ±26.4 48 59 (22.1%) 134 (50.2%) 58 (21.7%) 16 (6.0%) |
55.5 ±28.0 51 36 (20.2%) 82 (46.1%) 49 (27.5%) 11 (6.2%) |
0.02 |
| PSA density (ng), mean ±StD median |
0.23 ±0.24 0.17 |
0.21 ±0.24 0.15 |
0.22 ±0.18 0.17 |
0.31 ±0.29 0.20 |
<0.01 |
| TRUS positivity | 275 (27.3%) | 153 (27.3%) | 74 (27.8%) | 48 (27.1%) | 0.98 |
| No. of cores (median. IQR) | 12 (10-24) | 10 (10-12) | 21 (12-24) | 23 (12-24) | <0.01 |
| Sampling density mean ±StD median |
3.7 ±2.4 3.2 |
4.2 ±2.4 3.6 |
3.2 ±2.2 2.7 |
3.2 ±2.1 2.8 |
<0.01 |
| Detection rate | 256 (25.4%) | 145 (25.8%) | 66 (24.7%) | 45 (25.3%) | 0.94 |
StD – standard deviation, IQR – interquartile range, PSA – prostate specific antigen, F/T – free/total PSA ratio, DRE – digital rectal examination, TRUS – transrectal ultrasound
In the univariate model, all analysed parameters (age group, SD, DRE, F/T, and PSA) were found significant predictors of cancer on 1st re-biopsy and all were considered for multivariate models. In the multivariate model of cancer detection on 1st re-biopsy, all main effects remained significant except PSA. The only significant interaction of SD was found with age group (younger versus older than 65 years) and this interaction effect was kept in the final multivariate model. Summary of effect estimates of univariate and multivariate models are shown in Table 2.
Table 2.
Patient’s characteristics
| Variable | Group A | Group B | Group C | |||
|---|---|---|---|---|---|---|
| Estimate (OR) |
p | Estimate (OR) |
p | Estimate (OR) |
p | |
| Univariate models | ||||||
| Age 65+ | 0.489 (1.63) |
0.0137 | 0.136 (1.15) |
0.6354 | 0.507 (1.66) |
0.2262 |
| SD | -0.139 (0.87) |
0.0028 | -0.295 (0.74) |
0.0015 | -0.466 (0.63) |
0.0006 |
| DRE | 0.936 (2.55) |
<0.0001 | 1.214 (3.37) |
0.0003 | -0.117 (0.89) |
0.794 |
| F/T | -0.045 (0.96) |
0.0059 | -0.076 (0.93) |
0.0056 | -0.061 (0.94) |
0.0702 |
| PSA | 0.051 (1.05) |
0.0011 | 0.049 (1.05) |
0.0361 | 0.031 (1.03) |
0.0705 |
| Multivariate models | ||||||
| Age 65+ | -0.839 (NA) |
0.0833 | 0.368 (NA) |
0.5592 | -0.788 (NA) |
0.5407 |
| SD | -0.453 (NA) |
0.0001 | -0.151 (NA) |
0.3435 | -1.317 (NA) |
0.0426 |
| SD* Age 65+ | 0.388 (NA) |
0.0029 | -0.054 (NA) |
0.7805 | 0.862 (NA) |
0.1961 |
| DRE | 0.963 (2.62) |
0.0001 | 1.124 (3.08) |
0.0028 | -0.082 (0.92) |
0.8762 |
| F/T | -0.037 (0.96) |
0.0443 | -0.043 (0.96) |
0.1615 | -0.020 (0.98) |
0.5658 |
| PSA | 0.041 (1.04) |
0.0562 | 0.041 (1.04) |
0.1612 | 0.030 (1.03) |
0.1504 |
Intercepts not presented
OR – odds ratio, SD – sampling density, DRE – digital rectal examination, F/T – free/total PSA ratio, PSA – prostate specific antigen, NA – not applicable
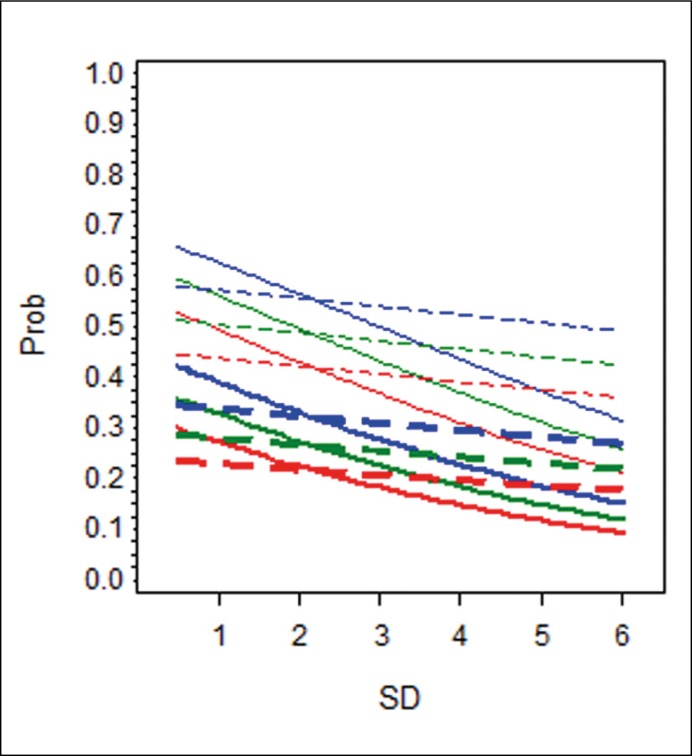
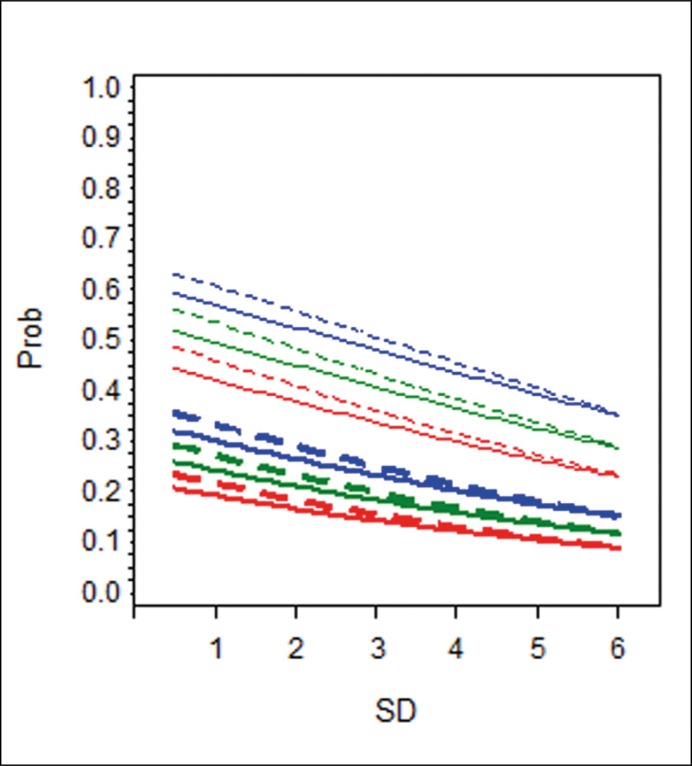
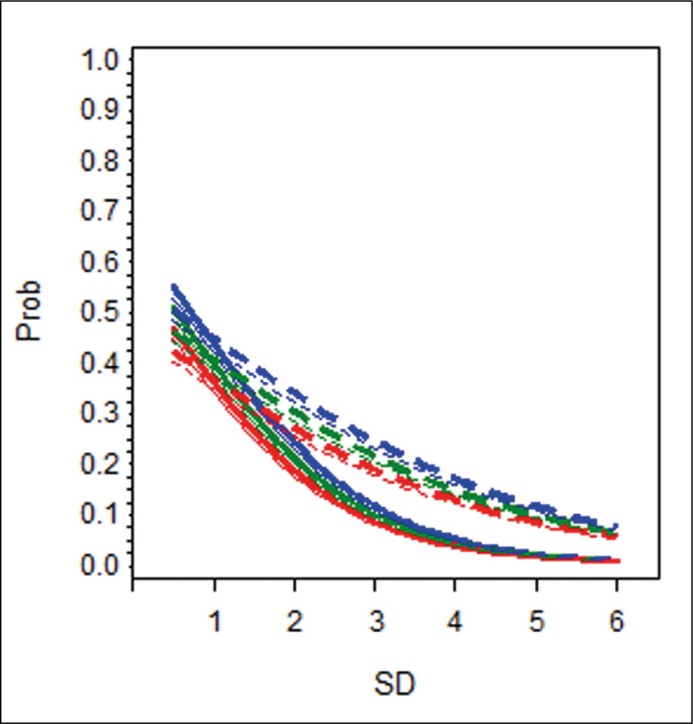
Because OR cannot be interpreted directly in a multivariate logistic model with interaction terms and in order to easily understand predictive properties of various factors, computed probabilities of PC detection in several hypothetical patients were related to SD and presented graphically (Figure 1A–C).
Figure 1A.
The effect of sampling density on the probability of PC detection in the 1st re-biopsy.
DISCUSSION
Inviting a patient with previous negative prostate biopsy for a re-biopsy is a difficult yet common dilemma in urological practice. Failure to detect a potentially life-threatening tumor must be weighed against the risk of biopsy-related complications, the rate of which is increasing [8], patient discomfort and associated costs within the healthcare system. Therefore, the search for a variable or a set of variables that would predict biopsy outcome has gained importance as well as popularity in the recent decade and several predicting tools [7, 9] have been developed to estimate the actual risk of PC in an individual patient before proceeding to a repeat prostate biopsy. Chun et al. evaluated sampling density in a multivariate logistic regression model including age, PSA level, fPSA, DRE and the number of previous negative biopsies. SD was found superior to prostate volume in PC prediction, when either SD or prostate volume was combined with the abovementioned factors [7]. Chun et al. were the first to incorporate SD into a predictive model for repeat TRUS-biopsies. SD defined as prostate volume divided by the number of cores is opposite to the common concept of density (amount in a unit volume), but given the already established concept, we retained the same definition in our study. However, it is important to keep in mind that increasing the number of biopsy cores, translates into decrease in SD nominal value, as defined here. Odds ratios reported by Chun et al. in their multivariate analysis for age, PSA, fPSA and SD are very similar to ours, which suggests both populations were comparable [7].
We have replicated the finding that SD is an independent predictor of cancer in multivariate analysis, although in group B, the trend did not attain statistical significance. We hypothesized that the performance of SD in the prediction of biopsy outcome may vary in different situations, i.e. with regard to patient age, PSA level, number of previous biopsies etc. To that purpose, interaction effects of SD with other clinical variables (age, PSA, F/T and DRE) were considered in models created for three separate groups of patients with respect to the number of previous biopsies (Figure 1A,B,C). Lower values of SD (indicating higher number of biopsy samples) were associated with higher cancer DR. This association varied with respect to patient age and the number of previous biopsies. In patients younger than 65 years undergoing their first repeat biopsy, increase in the number of biopsy samples was associated with a more pronounced improvement in DR than in older men (Figure 1A).
Figure 1B.
The effect of change in sampling density on the probability of PC detection in the 2nd re-biopsy. For explanation, see legend for Figure 1A. Prob – probability of a positive outcome on prostate biopsy; SD – sampling density.
Figure 1C.
The effect of change in sampling density on the probability of PC detection in the 3rd and further re-biopsies. For explanation, see legend for Figure 1A. Prob – probability of a positive outcome on prostate biopsy; SD – sampling density.
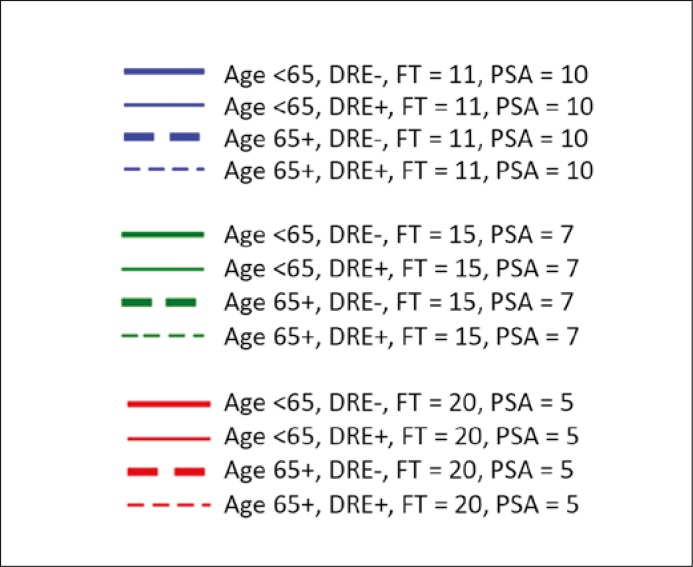
Hypothetical patients with PSA level of 10 ng/mL and F/T 11% (blue lines); PSA level of 7 ng/mL and F/T 15% (green lines); PSA level of 5 ng/mL and F/T 20% (red lines). The difference in slopes between the full and dotted lines of the same colour and thickness reflects the effect of age on the detection rate. Unit change in sampling density will increase/decrease the likelihood of cancer detection, but more so in a younger man than in his senior counterpart with otherwise the same characteristics.
This interaction of SD with age was significant in group A (1st re-biopsy) only. In practical terms, this means that more extensive sampling seems to be worthwhile at the first re-biopsy in younger patients where it may lead to higher cancer detection. Coincidentally, these are men most likely to benefit from radical treatment [13]. Positive DRE and lower F/T values were associated with a higher detection rate, as previously reported [7, 14], but showed no interaction with SD.
The DR of repeat prostate biopsies in our study was similar to or higher than previously reported [10, 11, 12]. It remained identical across groups A to C despite several previous reports showing that DR (as well as clinical significance of tumours) decrease with every repeated biopsy [15]. Our constant DR was at the cost of increased sampling in groups B and C, compared to group A, measured by both median number of cores and by sampling density. DR would have likely been less on the second and further re-biopsy, if the extent of sampling had been identical as in the first re-biopsy.
Main criticisms of the present study will revolve around its retrospective nature and the limitations resulting thereof, as well as its belatedness. Firstly, the lack of a critical appraisal of the initial biopsy must be noted. It has been shown that DR of the first repeat biopsy is 39% and 28% when performed after an initial sextant or extended biopsy, respectively [16]; on our cohort of patients, the extent of the initial negative biopsy could not be accounted for. Likewise, it may have been worthwhile to assess the presence of HGPIN or ASAP in the negative biopsies preceding those included in this analysis. This information was not available retrospectively. Relating the number of samples to the total prostate volume in the concept of SD may represent a source of bias, as large prostate glands owe their size to the hyperplastic transition zone, while most cancers arise in the thinned peripheral zone. The net result would be diminishing of the effect size of SD on PC detection, rather than overestimating it. Further validation of our results would require an independent analysis performed in a prospective manner on a different set of data, something hard to expect at present. A majority of patients now undergo multi-parametric magnetic resonance imaging as a prelude to their repeat biopsy and the combination of MRI and ultrasound targeting has been shown to improve the detection of clinically significant cancer [17]. However, this latest technology will not be available immediately on a large scale and its clinical effectiveness remains to be proven.
Repeat TRUS-biopsies expose patients to the risk of complications, bring them discomfort and represent an economic burden on the health care system. Studies are under way to improve diagnostic accuracy of prostate biopsies using sophisticated imaging or new tumour markers; however, until these are validated and possibly result in the change of current practice, adequate quality of the initial and first repeat biopsy cannot be overstated.
CONCLUSIONS
Our study is the first to our knowledge to investigate the impact of SD in a large population of patients undergoing repeat prostate biopsies. The data confirm previous knowledge that more extensive prostate sampling leads to a higher cancer DR on repeat prostate biopsies. However, this effect seems to be particularly pronounced in men younger than 65 years undergoing their first repeat prostate biopsy.
ACKNOWLEDGEMENTS
Many thanks to Alicia Skervin for her language review.
Supported by the project (Ministry of Health, Czech Republic) for conceptual development of research organization 00064203 (University Hospital Motol, Prague, Czech Republic).
CONFLICTS OF INTEREST
The authors declare no conflicts of interest.
References
- 1.Ferlay J, Steliarova-Foucher E, Lortet-Tieulent J, et al. Cancer incidence and mortality patterns in Europe: estimates for 40 countries in 2012. Eur J Cancer. 2013;49:1374–1403. doi: 10.1016/j.ejca.2012.12.027. [DOI] [PubMed] [Google Scholar]
- 2.Siegel R, Naishadham D, Jemal A. Cancer Statistics, 2012. CA Cancer J Clin. 2012;62:10–29. doi: 10.3322/caac.20138. [DOI] [PubMed] [Google Scholar]
- 3.Antoniewicz A, Zapała Ł, Borówka A, de Reijke TM. Biopsy of the prostate-the urge to search for a new standard. Cent European J Urol. 2010;63:166–175. [Google Scholar]
- 4.Eichler K, Hempel S, Wilby J, Myers L, Bachmann LM, Kleijnen J. Diagnostic value of systematic biopsy methods in the investigation of prostate cancer: a systematic review. J Urol. 2006;175:1605–1612. doi: 10.1016/S0022-5347(05)00957-2. [DOI] [PubMed] [Google Scholar]
- 5.Remzi M, Fong YK, Dobrovits M, et al. The Vienna nomogram: validation of a novel biopsy strategy defining the optimal number of cores based on patient age and total prostate volume. J Urol. 2005;174:1256–1260. doi: 10.1097/01.ju.0000173924.83392.cc. [DOI] [PubMed] [Google Scholar]
- 6.Lecuona A, Heyns CF. A prospective, randomized trial comparing the Vienna nomogram to an eight-core prostate biopsy protocol. BJU Int. 2011;108:204–208. doi: 10.1111/j.1464-410X.2010.09887.x. [DOI] [PubMed] [Google Scholar]
- 7.Chun FK-H, Briganti A, Graefen M, et al. Development and external validation of an extended repeat biopsy nomogram. J Urol. 2007;177:510–515. doi: 10.1016/j.juro.2006.09.025. [DOI] [PubMed] [Google Scholar]
- 8.Nam RK, Saskin R, Lee Y, et al. Increasing hospital admission rates for urological complications after transrectal ultrasound guided prostate biopsy. J Urol. 2013;189(1 Suppl):S12–17. doi: 10.1016/j.juro.2012.11.015. [DOI] [PubMed] [Google Scholar]
- 9.Lopez-Corona E, Ohori M, Scardino PT, Reuter VE, Gonen M, Kattan MW. A nomogram for predicting a positive repeat prostate biopsy in patients with a previous negative biopsy session. J Urol. 2003;170:1184–1188. doi: 10.1097/01.ju.0000087451.64657.fa. [DOI] [PubMed] [Google Scholar]
- 10.Kirby R, Fitzpatrick JM. Optimising repeat prostate biopsy decisions and procedures. BJU Int. 2012;109:1750–1754. doi: 10.1111/j.1464-410X.2011.10809.x. [DOI] [PubMed] [Google Scholar]
- 11.Zaytoun OM, Stephenson AJ, Fareed K, et al. When serial prostate biopsy is recommended: most cancers detected are clinically insignificant. BJU Int. 2012;110:987–992. doi: 10.1111/j.1464-410X.2012.10958.x. [DOI] [PubMed] [Google Scholar]
- 12.Tan N, Lane BR, Li J, Moussa AS, Soriano M, Jones JS. Prostate cancers diagnosed at repeat biopsy are smaller and less likely to be high grade. J Urol. 2008;180:1325–1329. doi: 10.1016/j.juro.2008.06.022. [DOI] [PubMed] [Google Scholar]
- 13.Bill-Axelson A, Holmberg L, Garmo H. Radical Prostatectomy or Watchful Waiting in Early Prostate Cancer. N J Engl J Med. 2014;370:932–342. doi: 10.1056/NEJMoa1311593. [DOI] [PMC free article] [PubMed] [Google Scholar]
- 14.Lee BH, Hernandez AV, Zaytoun O, Berglund RK, Gong MC, Jones JS. Utility of percent free PSA in repeat prostate biopsy. Urology. 2011;78:386–391. doi: 10.1016/j.urology.2011.04.023. [DOI] [PubMed] [Google Scholar]
- 15.Resnick MJ, Lee DJ, Magerfleisch L, et al. Repeat prostate biopsy and the incremental risk of clinically insignificant prostate cancer. Urology. 2011;77:548–552. doi: 10.1016/j.urology.2010.08.063. [DOI] [PubMed] [Google Scholar]
- 16.Presti JC. Repeat prostate biopsy- when, where, and how. Urol Oncol. 2009;27:312–314. doi: 10.1016/j.urolonc.2008.10.029. [DOI] [PubMed] [Google Scholar]
- 17.Salami SS, Ben-Levi E, Yaskiv O, et al. In patients with a previous negative prostate biopsy and a suspicious lesion on magnetic resonance imaging, is a 12-core biopsy still necessary in addition to a targeted biopsy? BJU Int. 2015;115:562–570. doi: 10.1111/bju.12938. [DOI] [PubMed] [Google Scholar]


