

Abstract
The present study was conducted to assess test-retest reproducibility of explosive strength measurements during single-joint isometric knee extension using the IsoMed 2000 dynamometer. Thirty-one physically active male subjects (mean age: 23.7 years) were measured on two occasions separated by 48–72 h. The intraclass correlation coefficient (ICC 2,1) and the coefficient of variation (CV) were calculated for (i) maximum torque (MVC), (ii) the peak rate of torque development (RTDpeak) as well as for (iii) the average rate of torque development (RTD) and the impulse taken at several predefined time intervals (0–30 to 0–300 ms); thereby explosive strength variables were derived in two conceptually different versions: on the one hand from the MVC-trial (version I), on the other hand from the trial showing the RTDpeak (version II). High ICC-values (0.80–0.99) and acceptable CV-values (1.9–8.7%) could be found for MVC as well as for the RTD and the impulse taken at time intervals of ≥100 ms, regardless of whether version I or II was used. In contrast, measurements of the RTDpeak as well as the RTD and the impulse taken during the very early contraction phase (i.e. RTD/impulse0–30ms and RTD/impulse0–50ms) showed clearly weaker reproducibility results (ICC: 0.53–0.84; CV: 7.3–16.4%) and gave rise to considerable doubts as to clinical usefulness, especially when derived using version I. However, if there is a need to measure explosive strength for earlier time intervals in practice, it is, in view of stronger reproducibility results, recommended to concentrate on measures derived from version II, which is based on the RTDpeak-trial.
Key words: explosive torque production, rate of torque development, impulse, knee extension, IsoMed 2000, test-retest reproducibility
Introduction
Several sport-specific activities such as boxing, sprint running, jumping or kicking a ball are characterized by a limited time to develop force (≈ 50–250 ms) (Kuitunen et al., 2002; Luhtanen and Komi, 1979; Weyand et al., 2000; Zatsiorsky, 1995), which is less than it takes to reach maximum force for most human muscles (≥ 300 ms) (Sukop and Nelson, 1974; Thorstensson et al., 1976; Zatsiorsky, 1995). This is also true for daily activities, such as stair climbing or preventing a fall after a sudden postural perturbation (Bassey et al., 1992; Fleming et al., 1991). Consequently, instead of maximum strength, the ability to achieve a rapid rise in muscle force in the early contraction phase – explosive strength – serves as the determining key factor in these situations.
In terms of performance diagnosis, a variety of tests for explosive strength have been used throughout the literature. Among other methods, explosive strength can be assessed as the peak rate of torque development (RTDpeak) or the average rate of torque development or the impulse after fixed periods of time intervals (e.g. RTD0–50ms) during rapid maximum isometric muscle contractions. Besides other discrepancies, existing studies differ with regard to the criterion trail (e.g. out of 5 testing trials) used for deriving explosive strength measurements. On the one hand (version I), explosive strength variables are derived from the MVC-trial (Aagaard et al., 2002; Andersen et al., 2010; Gruber et al., 2007; Jordan et al., 2015), on the other hand (version II) from the trial showing the RTDpeak (Hannah et al., 2012; Tillin et al., 2010). So far, there seems to be no agreement on what should be preferred.
Reproducibility of measurements plays a crucial role for any measurement and obviously can be a great help in choosing a methodology. Actually, both versions have already been used in corresponding reproducibility studies (Buckthorpe et al., 2012; Prieske et al., 2014). However, the different results found in these studies cannot be exclusively attributed to discrepancies in deriving explosive strength variables due to further methodological discrepancies, which go far beyond this (e.g. evaluation of different muscle groups, using different devices, etc.). Former research failed to provide a direct comparison.
The aim of the present study was to evaluate reproducibility for isometric explosive strength measurements. In line with most studies mentioned so far, measurements were taken during unilateral isometric knee extension. However, in contrast to former studies, in the present study explosive strength variables were derived in both of the aforementioned versions, i.e. from the MVC-trial as well as from the RTDpeak-trial, within one study in order to allow for a direct comparison. All testing was conducted using the IsoMed 2000 dynamometer, which is one of the most advanced dynamometers currently available on the market and had never been used in studies on reproducibility of lower extremity explosive strength measurements. The actual testing protocol chosen for evaluation was an integral part of the performance diagnosis administered at the Department of Sport Science and Kinesiology at the University of Salzburg and the Olympic Center Salzburg-Rif.
Material and Methods
A single-group repeated measure design was used to determine relative and absolute inter-session reproducibility for various measures of explosive strength performance during maximum isometric knee extension. Subjects participated in two identical sessions, 48–72 h apart. Based on results of pretests performed at our faculty on individuals of comparable characteristics, we estimated this time interval to be sufficient to avoid pre-fatigue resulting from the first session. Moreover, subjects were asked to maintain their physical activity level throughout the study protocol and to abstain from any vigorous physical activity for at least 48 h prior to each testing session. In order to control for possible effects of diurnal influences and inter-tester variability, all sessions were conducted during the same time of the day and by the same examiner. The study was carried out in line with the Declaration of Helsinki (World Medical Association Declaration of Helsinki, 2000) and approved by the local Ethics Committee (Department of Sport Science and Kinesiology, University of Salzburg).
Participants
A sample of 31 healthy male students of sports science (mean ± SD, age: 23.7 ± 2.1 years; body height: 176.2 ± 4.3 cm; body mass: 72.7 ± 6.4 kg) without known cardiovascular or lower extremity pathology volunteered to participate in the study. Twenty-six of them were right dominant, as determined by the preferred leg for kicking a ball. All subjects performed regular physical activities at least 3 h a week, including a minimum of 30 min of specific lower extremity maximum strength training (e.g. squats). Although subjects were familiar with strengthening the lower extremities, none of them had experience of isometric maximum or explosive strength testing prior to the study. Before entering the study, subjects received a comprehensive explanation of the experimental procedures and risks of the study, and written informed consent was obtained.
Instruments
Isometric torque was measured using an IsoMed 2000 dynamometer (D&R Ferstl GmbH, Hemau, Germany) combined with the manufacturer’s unilateral knee attachment. The dynamometer is available in two modes (B- and E-series), each including several versions. For the present study, the more powerful dynamometer version E750-560 was used. Extensive information on the structure and performance characteristics of available versions of the IsoMed 2000 dynamometer, including the version relevant for the present study, can be found elsewhere (Dirnberger et al., 2013) and should not be duplicated here. Prior to each session, the dynamometer was calibrated according to the specific guidelines outlined in the service manual.
Procedure
At the beginning of each session, participants completed a standardized general warm-up consisting of 5 min cycling at a submaximal intensity of 1.5 W/kgBW and a pedal rate of 70–75 rpm on a stationary ergometer (Heinz Kettler GmbH and Co. KG, Ense-Parsit, Germany). Immediately thereafter, subjects were asked to take off their shoes and then were seated on the dynamometer chair, with the seat back at an angle of 75° (0° = full hip extension in the lying position) and the proximal part of the calves touching the frontal edge of the seat. In order to minimize extraneous body movements, the shoulders, the chest, the hip and the right femur of the subjects were firmly secured to the chair by means of adjustable straps and belts. In addition, subjects were told to use the handgrips situated lateral to their hips during testing. The knee joint center, which was defined as the center of the lateral femoral epicondyle and which was localized by careful manual palpation, was then aligned to the dynamometer’s axis of rotation or, to be more precise, according to the suggestion of Blazevich et al. (2008) ≈ 2 cm anterior to the rotational axis of the dynamometer in order to ensure that the lateral condyle of the femur was in line during maximum efforts, when slight deformation of the chair, padding and soft tissue occurred. Using a strap, the resistance pad of the lever arm was attached ≈ 3 cm above the lateral malleolus in a position of 95° of knee flexion (0° = full knee extension). As we had observed a change in the knee angle of about 5° in pretests due to deformation of the shin pad, we considered these settings to be appropriate to represent an intended actual knee angle of 90° during maximum contraction. Picture 1 shows the final testing position as described above.
Figure 1.
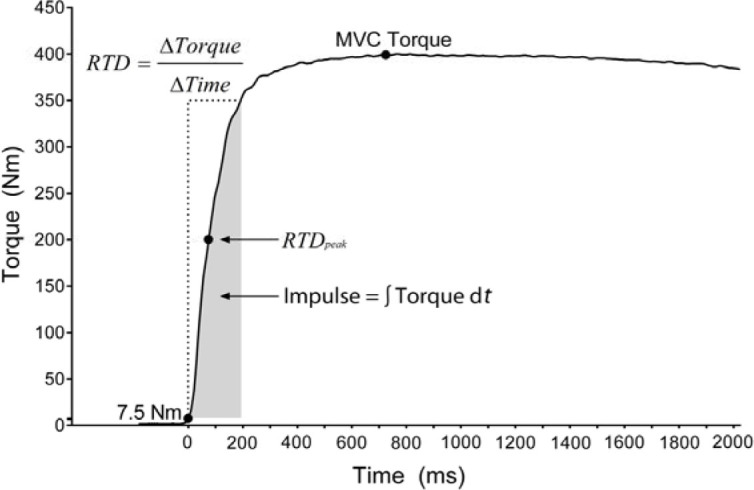
An example of a torque-time curve recorded during a trial of maximal isometric knee extension. Time 0 corresponds to the onset of the torque curve, which was determined when the torque exceeded a value of 7.5 Nm. MVC was defined as the highest torque value. RTDpeak was defined as the peak slope of the torque-curve. Average RTD and contractile impulse (here shown for 0–200 ms) were determined from the slope and the area under the torque-time curve at time intervals of 30, 50, 100, 200 and 300 ms, respectively, from the onset of contraction.
Picture 1.
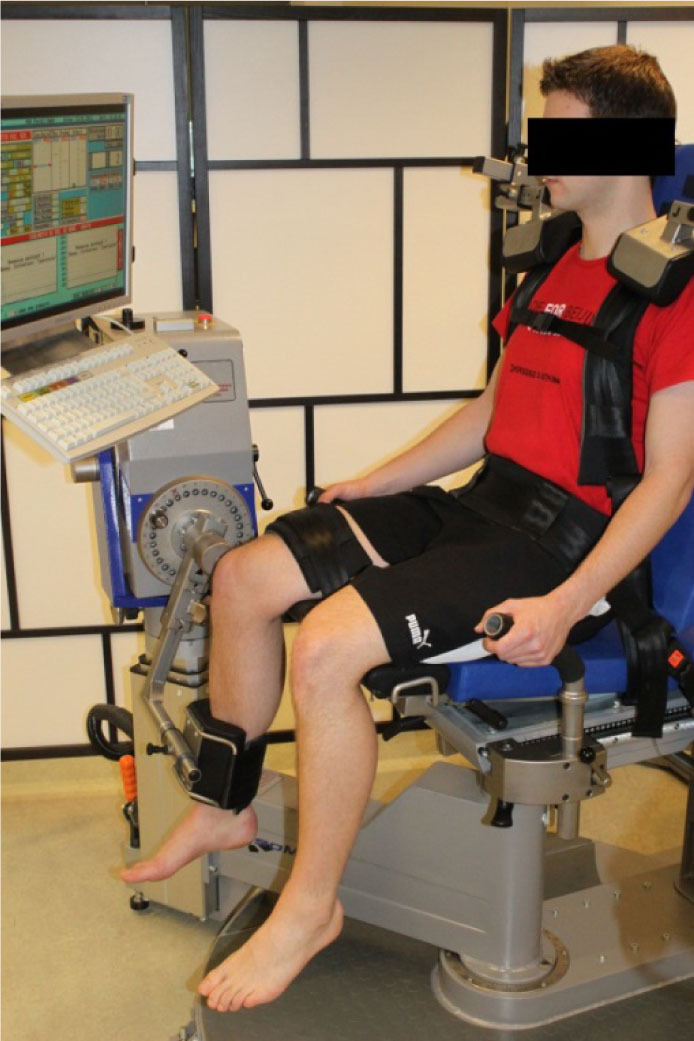
Testing position on the IsoMed 2000 dynamometer
In order to ensure setup-consistency for both visits, all individuals settings concerning subject fixation and dynamometer adjustment mentioned so far were documented during the first visit and maintained in the subsequent second visit.
Subjects were then informed about the structure of the test and told to extend the knee as explosively, fast and forcefully as possible against the shin pad for about 3 s in each of the actual testing trials without any pretension or preceding flexion countermovement. Fully aware of the testing task, they performed 3–4 submaximal practice trials, which were commented with regard to the testing task. Between the warm-up and testing there was a rest period of 2 min, which was used to announce the actual testing trials. Testing itself consisted of 4–5 trials at maximum effort, separated by 30 s rest periods. Single trials were introduced by repeating the specific instruction already mentioned above, followed by a verbal countdown. Throughout testing, additional standardized strong verbal encouragement and visual online feedback of the instantaneous dynamometer torque were provided in order to ensure maximum effort.
Analysis
Data provided by the device-integrated software application IsoMed Analyze (V.1.0.5.) were used for subsequent Matlab-analysis (version R2013a; The MathWorks Inc., Natick, Massachusetts, USA). These data were based on raw data sampled at 1000 Hz, which were smoothed using a digital fourth-order, zero-lag Butterworth filter with a cutoff frequency of 200 Hz and thereafter reduced to 200 Hz. All curves were manually corrected for baseline shifts.
Maximum voluntary contraction (MVC), defined as the maximum torque value throughout testing trials, served as the criterion measure for maximum strength performance. Variables related to explosive strength performance included: (i) the peak rate of torque development (RTDpeak), defined as the peak slope of the torque-time curve, (ii) the average rate of torque development at time intervals of 0–30, 0–50, 0– 100, 0–200 and 0–300 ms (RTD0–30ms to RTD0–300ms) relative to the onset of contraction as well as the impulse – i.e. the area under the torque-time curve (∫Torque dt) – at the same time intervals (impulse0–30ms to impulse0–300ms); thereby the onset of contraction was defined as the time point at which the toque curve exceeded the baseline torque by 7.5 Nm (Figure 1). RTD 0–30ms to RTD0–100ms was meant to describe explosive strength performance during the early contraction phase, while RTD0–200ms and RTD0–300ms were used for longer time intervals. As already mentioned above (introduction), explosive strength variables were derived in two versions: on the one hand from the MVC-trial (version I), on the other hand from the trial showing the RTDpeak (version II).
Descriptive statistics were calculated, including means and standard deviations for each session. The Kolmogorov-Smirnov test was applied and confirmed that all variables were normally distributed. Paired sample t-tests (bilateral) were used to detect systematic errors (e.g. learning effects) between the sessions as well as to test for significant within-session differences in variables between versions I and II.
Baumgartner (1989) and, subsequently, various other authors (Atkinson and Nevill, 1998; Dvir, 2004; Weir, 2005) differentiated between “relative” and “absolute” reproducibility. Relative reproducibility corresponds to the understanding of reproducibility as formulated in classical testing theory. It represents the proportion of variance in a set of scores that is due to true score variance (Weir, 2005) and is used as an indicator of the degree to which individuals maintain their position in a sample over repeated measurements (Atkinson and Nevill, 1998; Baumgartner, 1989; Dvir, 2004). In the present study, this type of reproducibility was evaluated using the intraclass correlation coefficient (ICC 2,1), a two-way random effects model with single-measures reproducibility in which variance over repeated measurements was considered (Shrout and Fleiss, 1979). As a general rule, we considered an ICC- value over 0.9 to be high, between 0.8 and 0.9 to be moderate and below 0.8 to be low and insufficient (Vincent and Weir, 2012). Absolute reproducibility represents the degree to which repeated measurements vary for individuals, thus concerning measurement agreement or precision (Atkinson and Nevill, 1998), and was calculated using the coefficient of variation (CV) according to the formula:
To interpret CV-values, for the present study an analytical goal of 10% or below was chosen as the indicator of acceptable reproducibility.
All statistics were performed using Microsoft Excel 2010 (Microsoft Corp., Redmond, Washington, USA) and SPSS V.20 (SPSS Inc., Chicago, Illinois, USA). Statistical significance was set at p ≤ 0.05.
Results
Paired sample t-tests revealed no significant difference (all p > 0.05) in any of the variables between the two testing sessions. However, for both sessions analysis revealed significantly higher mean values for RTD/impulse0–30ms and RTD/impulse0–50ms when derived from version II compared to version I. In terms of reproducibility, ICC- and CV-values of 0.99 and 1.9% were examined for MVC. ICC-values of 0.53–0.96 and 0.67–0.92 combined with CV-values of 3.4–16.4% and 4.1–13.4% could be found for MVC- (version I) and RTDpeak-based (version II) explosive strength variables, respectively.
In full detail, within-session group means and standard deviations for each variable as well as results for t-tests, between-session ICC-values and CV-values are shown in Tables 1 and 2.
Table 1.
Within-session group means and standard deviations as well as between-session relative (ICC) and absolute (CV) reproducibility statistics for measurement variables derived according to version I
| Mean ± SD | ICC | CV(%) | ||||
|---|---|---|---|---|---|---|
| T1 | T2 | |||||
| MVC(Nm) | 269.3 ± 57.7 | 269.9 ± 60.6 | 0.99 | 1.9 | ||
| VERSION I (based on MVC) | RTD | |||||
| RTDpeak | 2671.0 ± 620.0 | 2812.3 ± 862.3 | 0.57 | 12.8 | ||
| (Nm·s -1) | 0–30 | 1406.5 ± 461.2 | 1337.1 ± 405.2 | 0.62 | 14.2 | |
| 0–50 | 1692.8 ± 429.1 | 1665.4 ± 439.5 | 0.75 | 10.5 | ||
| 0–100 | 1637.7 ± 350.9 | 1588.2 ± 339.0 | 0.88 | 6.3 | ||
| 0–200 | 1158.9 ± 224.7 | 1133.2 ± 217.5 | 0.96 | 3.7 | ||
| 0–300 | 857.1 ± 167.7 | 839.7 ± 167.4 | 0.96 | 3.4 | ||
| impulse | ||||||
| (Nm·s) | 0–30 | 0.49 ± 0.18 | 0.45 ± 0.15 | 0.53 | 16.4 | |
| 0–50 | 1.77 ± 0.52 | 1.68 ± 0.50 | 0.66 | 13.9 | ||
| 0–100 | 8.03 ± 1.88 | 7.78 ± 1.87 | 0.80 | 8.7 | ||
| 0–200 | 28.37 ± 5.84 | 27.60 ± 5.62 | 0.90 | 5.5 | ||
| 0–300 | 52.81 ± 10.51 | 51.68 ± 9.88 | 0.94 | 4.4 | ||
SD: standard deviation; T: testing session; ICC: intraclass correlation coefficient; CV: coefficient of variability; MVC: maximum voluntary contraction; RTD: rate of torque development; RTDpeak: peak rate of torque development
Table 2.
Within-session group means and standard deviations, within session t-test results (version I vs. version II) as well as between-session relative (ICC) and absolute (CV) reproducibility statistics for measurement variables derived according to version II
| Mean ± SD | ICC | CV(%) | ||||
|---|---|---|---|---|---|---|
| T1 | T2 | |||||
| VERSION II (based on RTDpeak) | RTD | |||||
| RTDpeak | 3136.8 ± 890.1* | 3261.3 ± 881.0* | 0.67 | 10.7 | ||
| (Nm·s -1) | 0–30 | 1558.0 ± 481.3* | 1480.9 ± 488.7* | 0.80 | 12.1 | |
| 0–50 | 1818.5 ± 408.8* | 1791.7 ± 406.7* | 0.84 | 7.3 | ||
| 0–100 | 1674.4 ± 331.7 | 1630.3 ± 347.7 | 0.92 | 5.1 | ||
| 0–200 | 1141.0 ± 208.6 | 1124.4 ± 212.3 | 0.90 | 4.7 | ||
| 0–300 | 824.9 ± 153.7 | 823.1 ± 157.1 | 0.90 | 4.8 | ||
| impulse | ||||||
| (Nm·s) | 0–30 | 0.53 ± 0.18* | 0.49 ± 0.18* | 0.68 | 13.4 | |
| 0–50 | 1.91 ± 0.51* | 1.82 ± 0.55* | 0.79 | 11.2 | ||
| 0–100 | 8.36 ± 1.77 | 8.12 ± 1.85 | 0.89 | 6.1 | ||
| 0–200 | 28.52 ± 5.41 | 28.09 ± 5.77 | 0.91 | 4.6 | ||
| 0–300 | 52.33 ± 9.72 | 51.55 ± 9.82 | 0.91 | 4.1 | ||
SD: standard deviation; T: testing session; ICC: intraclass correlation coefficient; CV: coefficient of variability; RTD: rate of torque development; RTDpeak: peak rate of torque development;
significantly different from version I (p ≤ 0.05)
Discussion
The aim of the present study was to evaluate reproducibility for explosive strength measurements during isometric single-joint knee extension of physically active young men; due to a lack of research, RTDpeak as well as interval-specific RTD and impulse variables (RTD/impulse0–30ms to RTD/impulse0–300ms) were derived in two versions: on the one hand from the MVC-trial (version I), on the other hand from the trial showing the RTDpeak (version II). Both versions are, as shown in the introduction, rather common in the literature. However, previous studies failed to provide a direct comparison in terms of reproducibility.
No systematic error, i.e. learning effects, could be found for any of the variables between sessions, neither for version I nor version II. Consequently, we see no need to include a familiarization session into practice, at least when testing subjects of similar characteristics as those used in the present study.
High relative (ICC: 0.99) and acceptable (CV: 1.9%) absolute reproducibility could be found for MVC-measures. Compared to maximum strength measurements, reproducibility for explosive strength measurements variables was consistently found to be weaker (ICC: 0.53–0.96; CV: 3.4–16.4%). The results are comprehensive and should be discussed in further detail, specifically for time intervals (early vs. longer time intervals), the detection methodology (version I vs. version II), as well as measurement parameters (RTD vs. impulse).
For variables describing longer time intervals (>100 ms, i.e. RTD/impulse0–200ms and RTD/impulse0–300ms), acceptable reproducibility (ICC ≥ 0.8; CV ≤ 10%) could be found for both versions (ICC: 0.90–0.96; CV: 3.4–5.5%). Neither version was clearly and consistently superior to the other. However, for variables describing the early contraction phase (RTD/impulse0–30ms to RTD/impulse0–100ms), with the exception of RTD/impulse0–100ms, reproducibility was found to be insufficient when derived from version I. Reproducibility results found for version II during the early contraction phase were, similar to version I, found to be weaker compared to the longer contraction phase but consistently stronger compared to corresponding measures derived from version I. Not only RTD/impulse0–100ms, but also RTD0–50ms and, at least in terms of relative reproducibility, RTD0–30ms were found to be sufficiently reproducible using version II. Besides discrepancies in reproducibility during the early intervals, the grand means for RTDpeak, RTD/impulse0–30ms and RTD/impulse0–50ms turned out to be significantly higher, i.e. by ≈ 7–17%, using version II as compared to version I.
The reason for the aforementioned observations might be related to interval-specific determinants of explosive strength performance. In fact, previous studies showed that explosive strength performance during the initial contraction phase (≤ 100 ms) seemed to be closely related to neuronal activation, whereas explosive strength performance during longer periods appeared to be more related to maximum strength (Andersen and Aagaard, 2006; de Ruiter et al., 2004; Tillin et al., 2010). The RTDpeak, which was the criterion measure for version II in the present study, actually occurred at ≈ 70 ms. Like RTD0–30ms, RTD0–50ms and RTD0–100ms, RTDpeak is therefore mainly determined by neuronal activation. This common underlying determinant and a close relationship might be the reason for higher mean values and stronger reproducibility results found for the early intervals using version II, based on the RTDpeak, compared to version I, based on MVC, which, on the contrary, gradually gains more importance during longer time intervals. Actually, discrepancies between version I and version II diminish with increasing time intervals, or even go into reverse.
Weaker reproducibility results for earlier time intervals compared to corresponding measures for longer time intervals, which were found for both versions, may be partly due to the fact that agonist activation itself, which, as described above, is closely related to the RTD during earlier time intervals, generally shows rather weak reproducibility, as shown in previous studies including EMG-measurements (Tillin et al., 2010).
Comparing reproducibility results for measurement parameters (RTD vs. impulse), RTD-variables in most instances (all but the measurements for 0–200 and 0–300 ms derived according to version II) turned out to be stronger than impulse-variables. This could be explained by the fact that reproducibility, as stated above, seems to increase with increasing contraction time. In this respect, one should bear in mind that the impulse not only refers to the increase from the starting point to the last point within a time interval (e.g. 30 ms), but actually covers the whole area under the torque curve, thus also including the preceding contraction phase (“cumulated/integrated time intervals”).
However, although not interpreted, these patterns regarding time intervals and measurement parameters are similar to those found in previous studies (Buckthorpe et al., 2012; Prieske et al., 2014; Tillin et al., 2010).
A comparison in absolute magnitude of reproducibility results to these previous studies applying version I or version II should be limited to CV-coefficients, as measures of relative reproducibility, like the ICC, reflect the degree to which a subject maintains his position in a sample within repeated measurements. Thus, they are highly influenced by the range of values within a sample (sample-heterogeneity) and therefore not very suitable for comparing reproducibility results of studies using different samples (Atkinson and Nevill, 1998; Dvir, 2004; Looney, 2000). The CV as a measure of absolute reproducibility, by contrast, reflects the degree to which repeated measurements vary for individuals and is not influenced by heterogeneity, which makes it easier to compare between different studies (Atkinson and Nevill, 1998; Dvir, 2004). Actually, CV-values found by Buckthorpe et al. (2012) for overlapping measurement variables (RTDpeak, RTD/impulse0–50ms, RTD/impulse0–100ms) derived from version II are quite in line (5.1–18.7%) with those found in the present study (5.1–13.4%). However, CV-values found in the present study for version I consistently turned out to be clearly stronger compared to those found in the study by Prieske et al. (2014). This might be due to certain methodological differences between the studies. Several minor discrepancies could be mentioned, e.g. differences in sample characteristics. In this regard, less between-subject variations could be due to the fact that subjects used in the present study, who all engaged in regular lower extremity strength training, possibly were used to maximum, and even explosive, strength performance to a higher degree than those used by Prieske et al. (2014). Unfortunately, the authors did not provide information regarding strength training experience of their subjects. However, especially worth mentioning are differences in the tested muscle group. Prieske et al. (2014) carried out their measurements on elbow flexors, whereas the present study concentrated on knee extensors. In this respect we agree with Prieske et al. (2014) arguing that less variability, i.e. stronger reproducibility, for knee extensors could result from the fact that knee extensors, even without specific training, generally are more accustomed to maximum and explosive muscle contractions than elbow flexors as they are more frequently performed in daily activities (e.g. running or jumping).
Conclusions
Regular performance diagnostic has a very high place in modern competitive sports training to continuously direct and control the training process and by this to guarantee a high level of training economy. However, efficient performance diagnostic presupposes testing procedures of high quality, also regarding the reproducibility of measurements. Therefore, the present study was dedicated to compare methodological approaches of explosive strength measurements of the knee extensors in terms of measurement reproducibility. The findings clearly show that coaches and practitioners can expect high and sufficient reproducibility of RTD/impulse measurements for longer time intervals (≥ 100 ms), regardless of whether measurements are derived from the MVC-trial (version I) or the RTDpeak-trial (version II). Both versions are suitable to detect rather small but practically important changes. In contrast, measurements of the RTDpeak as well as the RTD and the impulse taken during the very early contraction phase (i.e. RTD/impulse0–30ms and RTD/impulse0–50ms) showed clearly weaker reproducibility results, giving rise to considerable doubts as to clinical usefulness and should be interpreted with caution, especially when derived from the MVC-trial. However, if there is a need to measure explosive strength for earlier time intervals, it is, in view of stronger reproducibility results, recommended to concentrate on measures derived from the RTDpeak-trial.
Authors submitted their contribution to the article to the editorial board.
References
- Aagaard P, Simonsen EB, Andersen JL, Magnusson P, Dyhre-Poulsen P. Increased rate of force development and neural drive of human skeletal muscle following resistance training. J Appl Physiol (1985) 2002;93(4):1318–1326. doi: 10.1152/japplphysiol.00283.2002. [DOI] [PubMed] [Google Scholar]
- Andersen LL, Aagaard P. Influence of maximal muscle strength and intrinsic muscle contractile properties on contractile rate of force development. Eur J Appl Physiol. 2006;96(1):46–52. doi: 10.1007/s00421-005-0070-z. [DOI] [PubMed] [Google Scholar]
- Andersen LL, Andersen JL, Zebis MK, Aagaard P. Early and late rate of force development: differential adaptive responses to resistance training. Scand J Med Sci Sports. 2010;20(1):162–169. doi: 10.1111/j.1600-0838.2009.00933.x. [DOI] [PubMed] [Google Scholar]
- Atkinson G, Nevill AM. Statistical methods for assessing measurement error (reliability) in variables relevant to sports medicine. Sports Med. 1998;26(4):217–238. doi: 10.2165/00007256-199826040-00002. [DOI] [PubMed] [Google Scholar]
- Bassey EJ, Fiatarone MA, O’Neill EF, Kelly M, Evans WJ, Lipsitz LA. Leg extensor power and functional performance in very old men and women. Clin Sci (Lond) 1992;82(3):321–327. doi: 10.1042/cs0820321. [DOI] [PubMed] [Google Scholar]
- Baumgartner TA. Norm-referenced measurement: reliability. IL: Human Kinetics; 1989. pp. 45–72. [Google Scholar]
- Blazevich AJ, Horne S, Cannavan D, Coleman DR, Aagaard P. Effect of contraction mode of slow-speed resistance training on the maximum rate of force development in the human quadriceps. Muscle Nerve. 2008;38(3):1133–1146. doi: 10.1002/mus.21021. [DOI] [PubMed] [Google Scholar]
- Buckthorpe MW, Hannah R, Pain TG, Folland JP. Reliability of neuromuscular measurements during explosive isometric contractions, with special reference to electromyography normalization techniques. Muscle Nerve. 2012;46(4):566–576. doi: 10.1002/mus.23322. [DOI] [PubMed] [Google Scholar]
- de Ruiter CJ, Kooistra RD, Paalman MI, de Haan A. Initial phase of maximal voluntary and electrically stimulated knee extension torque development at different knee angles. J Appl Physiol (1985) 2004;97(5):1693–1701. doi: 10.1152/japplphysiol.00230.2004. [DOI] [PubMed] [Google Scholar]
- Dirnberger J, Huber C, Hoop D, Kösters A, Müller E. Reproducibility of concentric and eccentric isokinetic multi-joint leg extension measurements using the IsoMed 2000-system. Isokinet Exerc Sci. 2013;21(3):195–202. [Google Scholar]
- Dvir Z. Isokinetics: muscle testing, interpretation, and clinical applications. Edinburgh; New York: Churchill Livingstone; 2004. [Google Scholar]
- Fleming BE, Wilson DR, Pendergast DR. A portable, easily performed muscle power test and its association with falls by elderly persons. Arch Phys Med Rehabil. 1991;72(11):886–889. doi: 10.1016/0003-9993(91)90006-5. [DOI] [PubMed] [Google Scholar]
- Gruber M, Gruber SB, Taube W, Schubert M, Beck SC, Gollhofer A. Differential effects of ballistic versus sensorimotor training on rate of force development and neural activation in humans. J Strength Cond Res. 2007;21(1):274–282. doi: 10.1519/00124278-200702000-00049. [DOI] [PubMed] [Google Scholar]
- Hannah R, Minshull C, Buckthorpe MW, Folland JP. Explosive neuromuscular performance of males versus females. Exp Physiol. 2012;97(5):618–629. doi: 10.1113/expphysiol.2011.063420. [DOI] [PubMed] [Google Scholar]
- Jordan MJ, Aagaard P, Herzog W. Rapid hamstrings/quadriceps strength in ACL-reconstructed elite alpine ski racers. Med Sci Sports Exerc. 2015;47(1):109–119. doi: 10.1249/MSS.0000000000000375. [DOI] [PubMed] [Google Scholar]
- Kuitunen S, Komi PV, Kyrolainen H. Knee and ankle joint stiffness in sprint running. Med Sci Sports Exerc. 2002;34(1):166–173. doi: 10.1097/00005768-200201000-00025. [DOI] [PubMed] [Google Scholar]
- Looney MA. When the intraclass correlation coefficient in misleading. Meas Phys Educ Exerc Sci. 2000;4(2):73–78. [Google Scholar]
- Luhtanen P, Komi PV. Mechanical power and segmental contribution to force impulses in long jump takeoff. Eur J Appl Physiol Occup Physiol. 1979;41(4):267–274. doi: 10.1007/BF00429743. [DOI] [PubMed] [Google Scholar]
- Prieske O, Wick D, Granacher U. Intrasession and intersession reliability in maximal and explosive isometric torque production of the elbow flexors. J Strength Cond Res. 2014;28(6):1771–1777. doi: 10.1519/JSC.0000000000000321. [DOI] [PubMed] [Google Scholar]
- Shrout PE, Fleiss JL. Intraclass correlations: uses in assessing rater reliability. Psychol Bull. 1979;86(2):420–428. doi: 10.1037//0033-2909.86.2.420. [DOI] [PubMed] [Google Scholar]
- Sukop J, Nelson RC. Effects of isometrical training on the force-time characteristics of muscle contractions. IL: Human Kinetics; 1974. [Google Scholar]
- Thorstensson A, Karlsson J, Viitasalo JH, Luhtanen P, Komi PV. Effect of strength training on EMG of human skeletal muscle. Acta Physiol Scand. 1976;98(2):232–236. doi: 10.1111/j.1748-1716.1976.tb00241.x. [DOI] [PubMed] [Google Scholar]
- Tillin NA, Jimenez-Reyes P, Pain MT, Folland JP. Neuromuscular performance of explosive power athletes versus untrained individuals. Med Sci Sports Exerc. 2010;42(4):781–790. doi: 10.1249/MSS.0b013e3181be9c7e. [DOI] [PubMed] [Google Scholar]
- Vincent WJ, Weir JP. Statistics in kinesiology. Champaign, IL: Human Kinetics; 2012. [Google Scholar]
- Weir JP. Quantifying test-retest reliability using the intraclass correlation coefficient and the SEM. J Strength Cond Res. 2005;19(1):231–240. doi: 10.1519/15184.1. [DOI] [PubMed] [Google Scholar]
- Weyand PG, Sternlight DB, Bellizzi MJ, Wright S. Faster top running speeds are achieved with greater ground forces not more rapid leg movements. J Appl Physiol (1985) 2000;89(5):1991–1999. doi: 10.1152/jappl.2000.89.5.1991. [DOI] [PubMed] [Google Scholar]
- Zatsiorsky VM. Science and practice of strength training. Champaign, IL: Human Kinetics; 1995. [Google Scholar]