Abstract
Cancer stem cells are increasingly becoming a primary target for new cancer treatment development. The ability to study their transient behavior in vitro will provide the opportunity for high-throughput testing of more effective therapies. We have previously demonstrated the use of 3D porous chitosan-alginate (CA) scaffolds to promote cancer stem-like cell (CSC) proliferation and enrichment in glioblastoma. Here we use 3D porous CA scaffolds to promote cancer stem-like cell enrichment in cell lines from prostate, liver, and breast cancers, and investigate the proliferation, morphology, and gene expressions of cells cultured in CA scaffolds as compared to 2D controls. The 3D CA scaffold cultures for all three cancer types showed reduced proliferation, formation of tumor spheroids, and increased expression of CSC associated mark genes (CD133 and NANOG), as opposed to monolayers. Additionally, we present a putative mechanism for the cancer stem-like cell enrichment on CA scaffolds. This study demonstrates that the cancer stem-like cell enrichment in CA scaffolds is a robust process that is not restricted to particular cancer types.
Introduction
The Dick group's initial discovery of a side population of cells in acute myeloid leukemia that drive propagation of the disease1, 2 confirmed early theories of the existence of cancer stem cells (CSCs) that maintain tumor growth.3, 4 It wasn't until a decade later that this CSC, or hierarchical, model of tumor growth was verified in a second model of cancer, breast cancer,5 and the vast majority of other cancers, which signaled a drastic paradigm shift in the fields of tumor biology and cancer treatment.6, 7
The CSC model maintains that only a subpopulation of cancer cells are able to initiate tumorigenesis by undergoing self-renewal and differentiation and actively promoting tumor growth and survival.8-10 These side-population cells are generally more malignant than cells comprising the bulk of the tumor showing higher invasiveness, drug resistance, and ability to form metastases.11 This explains why chemotherapies that are effective at debulking a tumor fail to fully eradicate the cancer, leading to relapse. Drugs that are able to eradicate the CSC population from a tumor could prove to be a highly effective therapy since the cells that drive tumor growth would be killed, leaving a benign mass of cells.
Unfortunately, drug development in this area is hindered by difficulty probing the specific aspects of the tumor microenvironment that promote CSC growth and survival. Another challenge in developing treatments that target CSCs is the difficulty of culturing CSCs in vitro, where the effect of treatments on the CSC population can be studied. Consequently, there has been considerable interest in developing biomaterial scaffold-based 3D cultures that promote proliferation and enrichment of cancer stem-like cells. A variety of biomaterial scaffolds, including poly(lactide-co-glycolide),12 fibrin gel,13 and porous collagen scaffolds,14 among others, have been demonstrated to promote proliferation and enrichment of cancer stem-like cells. We previously found that human glioblastoma and prostate cancer cell lines cultured on 3D chitosan-alginate (CA) scaffolds have a more malignant phenotype than 2D controls.15-19 We further examined the source of this malignant phenotype in a glioblastoma cell line and demonstrated that the 3D CA scaffold cultures promoted enrichment of the CSC population.17 Here we investigate if culture on CA scaffolds also promotes the selective expansion of the CSC-like population of hepatocellular carcinoma, breast cancer, prostate cancer, and other glioblastoma cell lines, demonstrating the versatility of the culture system and exploring the mechanisms underlying the CSC enrichment in CA scaffolds.
Experimental
Materials
Chitosan (practical grade, >75% deacetylated, MW = 190,000–375,000) and sodium alginate (alginic acid from brown seaweed) were purchased from Sigma-Aldrich (St. Louis, MO) and used as received. All tissue culture reagents (antibiotic–antimycotic (AA), Dulbecco's Phosphate Buffered Saline (D-PBS), trypsin, Versene) were purchased from Invitrogen (Carlsbad, CA), and FBS was purchased from Atlanta Biologicals (Lawrenceville, GA). TRAMP-C2 mouse prostate cancer, MDA-MB-231 human breast cancer, SK-Hep 1 human hepatocellular carcinoma, and U-87 MG human glioblastoma cell lines and Minimum Essential Media (MEM) were purchased from American Type Culture Collection (ATCC, Manassas, VA). Cells were maintained according to manufacturer's instructions in media containing 10% FBS and 1% AA at 37 °C and 5% CO2 in a fully humidified incubator. CD133 antibodies were purchased from Abcam (Cambridge, MA) until they were discontinued at which time they were purchased from Miltenyi Biotec (Auburn, CA).
CA scaffold synthesis
CA scaffolds were prepared as previously reported.16, 20 Briefly, a 4 wt% chitosan and 2 wt% acetic acid solution was mixed under constant stirring in a blender for 7 min to obtain a homogeneous chitosan solution. A 4 wt% alginate solution was prepared and added to the chitosan solution, and mixed in a blender for 5 min to obtain a homogeneous CA solution. The CA solution was cast in 24-well cell culture plates and frozen at −20 °C for 8 h. The samples were then lyophilized, sectioned, crosslinked in 0.2 M CaCl2 solution for 10 min under vacuum, washed with deionized water several times to remove any excess salt, and sterilized in 70 v% ethanol for 1 h. The scaffolds were then transferred to a sterile D-PBS solution and placed on an orbital shaker for >12 h to remove any excess ethanol.
CA scaffold characterization
Porosity was measured using a modified liquid displacement method where isopropanol was used as the displacement liquid.21, 22 Briefly, the dry scaffold volume (Vi) and weight (Wi) were measured. The scaffold was fully immersed in 5 mL of isopropanol of known density (ρi) under vacuum for 15 minutes to dispel air from the pores. The impregnated scaffold was removed from the isopropanol and weighed (Wf). The porosity was calculated as a ratio of the volume of solvent within the scaffold pores to the volume of the dry scaffold (n = 10).
The mechanical behavior of the hydrated scaffolds was measured at room temperature using a Shimadzu universal tester (AGS-X Series, Kyoto, Japan). Scaffolds (2 mm height, 17 mm diameter) were compressed at a rate of 0.4 mm/min until at least 40% strain was attained (n = 9). The compressive Young's moduli were calculated as the slope of the linear regions of the stress-strain curve (0–10% strain, bulk scaffold; 60– 80% strain, scaffold walls). All values were expressed as mean ± standard deviation.
Cell seeding on scaffolds
Cells were seeded onto D-PBS damp CA scaffolds in 24-well plates at 50,000 cells per scaffold in 50 μL fully supplemented media. Cells were allowed to infiltrate the scaffold for 1 h before 1 mL fully supplemented media was added to each well. For 2D pre-cultured samples, 50,000 cells in 1 mL fully supplemented media were added to 24-well plate wells. Media was replaced at least every 2 days as required.
Cell proliferation analysis
Proliferation of cells cultured on 2D wells and CA scaffolds was determined using the Alamar Blue assay following the manufacturer's protocol. Briefly, cells were washed with D-PBS before adding 1 mL of Alamar Blue solution (110 μg Resazurin per 1 mL fully supplemented medium)23 to each well. After 1.5 h the Alamar Blue solution was transferred to a black-bottom 96-well plate to obtain fluorescence values on a microplate reader. The cell number was calculated based on standard curves created previously. Cells were again washed with D-PBS to remove Alamar Blue solution and fresh fully supplemented medium was added to each well.
Microscopic analysis
Samples for Scanning Electron Microscopy (SEM) analysis were first fixed with cold Karnovsky's fixative overnight followed by dehydration in a series of ethanol washes (0%, 50%, 75%, 100%, 100%). Samples were critical point dried and sputter coated with platinum before imaging with a JSM 7000 SEM (JEOL, Tokyo, Japan).
Flow cytometry analysis
Cells were detached from scaffolds using Versene and washed into FACS buffer (2% FBS in D-PBS) at 1 million cells per mL. Cells were stained with primary antibody (1:50) for 1 h on ice, washed thrice with FACS buffer, and stained with FITC conjugated secondary antibody (1:1000) for 30 min on ice and washed thrice with FACS buffer. Cells were analyzed on a FACSCanto flow cytometer (Beckton Dickinson, Franklin Lakes, NJ), and data processed using the FlowJo software package (Tree Star, Ashland, OR). CD133+ cells were identified by comparing to secondary antibody only stained cells.
PCR
Cells were detached from scaffolds or well plates using Versene and cell pellets were stored at −80 °C before RNA extraction. RNA was extracted using the Qiagen RNeasy kit (Qiagen, Valencia, CA) following the manufacturer's protocol. mRNA reverse transcription (RT) was performed with a BioRad iScript cDNA synthesis kit (Bio-Rad, Hercules, CA). DNA transcripts were then probed using BioRad iQ SYBR Green Supermix with the primers listed in Table S1. Thermocycling was performed with a BioRad CFX96 Real-Time Detection System and expression levels normalized to GAPDH.
Tumorigenesis assay
Cells cultured in CA scaffolds for 15 days were detached using Versene, and stained for CD133 following the flow cytometry methods above. CD133+ and CD133− cells were sorted into PBS containing 2% FBS using an Aria flow cytometer (Beckton Dickinson, Franklin Lakes, NJ). Cells (500 or 2000) were injected subcutaneously into the flanks of athymic nude mice (Charles River Labs, Wilmington, MA) 6-8 weeks of age. All animal experiments were conducted in accordance with University of Washington Internal Animal Care and Use Committee approved protocols. For unsorted cell tumor growth studies, CA scaffolds containing cells cultured for 10 days were implanted into the flanks of athymic nude mice. 2D cultured cells were implanted in growth factor reduced Matrigel at the same cell number as cells on CA scaffolds.
Immunostaining
Cell cultured scaffolds were fixed overnight with 4% formaldehyde, embedded in paraffin, and sectioned into 15 μm sections and affixed to slides. Slides were deparafinized with xylenes and rehydrated followed by antigen retrieval using a double boiler and Tris-based antigen retrieval buffer. Slides were blocked with 10% BSA for 2 h and stained with primary antibody overnight at 4°C. Slides were washed thrice with 10% BSA and stained with secondary antibody for 2 h. Slides were then mounted using Prolong Gold antifade reagent containing DAPI as a counterstain. Images were obtained on an inverted fluorescent microscope (Nikon Instruments, Melville, NY) with the appropriate filters using a Nikon Ri1 Color Cooled Camera System (Nikon Instruments, Melville, NY) and 60× Oil Objective Lens (Nikon Instruments, Melville, NY).
Statistical analysis
The data is presented as the mean ± standard deviation (SD) of the mean. Statistical significance was set at p < 0.05 and was tested with Student's t-test (GraphPad Prism).
Results and discussion
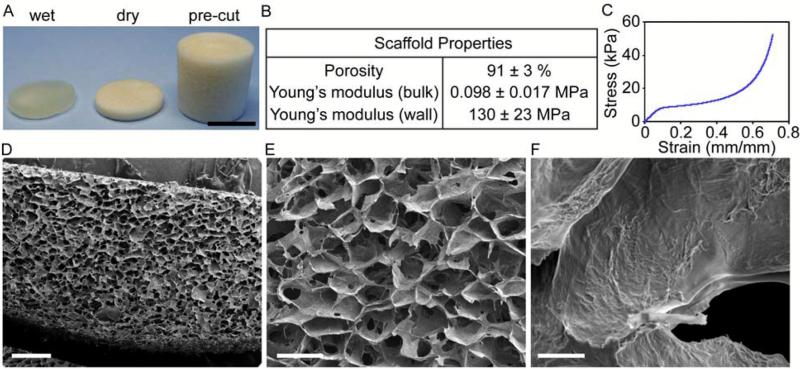
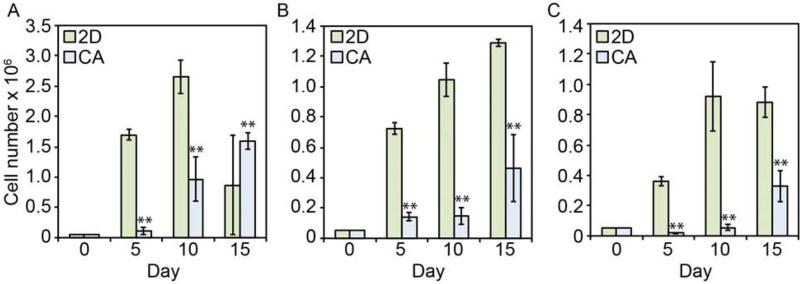
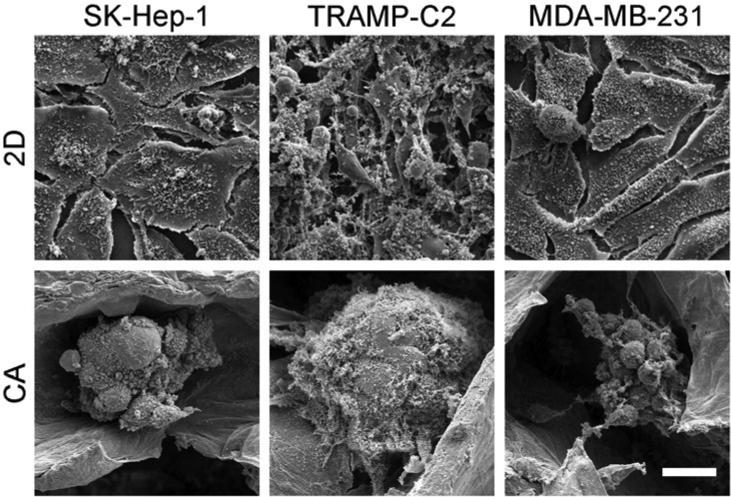
CA scaffolds were synthesized by forming a polyelectrolyte complex (PEC) between chitosan and alginate molecules, then freeze-casting and lyophilizing the CA PEC solution. This process results in porous CA scaffolds that crosslink with calcium ions and that have excellent physicochemical and biological properties: a detailed scaffold characterization was reported previously.20, 24 In this study, CA scaffolds were prepared and briefly characterized to assess their structural and mechanical properties closely related to the CSC enrichment (Fig. 1). The CA scaffold sections and macrostructure are shown in Fig. 1A. The CA scaffolds have a porosity of 91 ± 3% and a pore size of approximately 100 μm with pores evenly distributed throughout the scaffold (Fig. 1B, D, and E). The CA scaffold pores are interconnected despite the presence of some closed wall pores (Fig. 1E). The mechanical properties of the CA scaffolds were assessed with compression testing (Fig. 1C). The stress-strain curve shows three regions: linear elastic, plateau, and densification, with the Young's modulus for the bulk scaffold and scaffold walls assessed from the linear elastic and densification regions, respectively. The Young's modulus of the bulk scaffold is 98 ± 17 kPa, which is closer to that of brain cancer tissue, ~7 kPa, than tissue culture polystyrene (2–4 GPa).25, 26 However, the mechanical property that attached cells actually experience and is rarely reported in the literature for other porous scaffolds, is the wall stiffness, which has a Young's modulus of approximately 130 ± 23 MPa in our case, three orders of magnitude greater than the bulk scaffold, but still over an order of magnitude lower than tissue culture polystyrene (2–4 GPa). The Young's modulus of the scaffold wall may provide a much more useful indicator of cell behavior on porous scaffold materials. Cancer cells were seeded directly in 24-well plates (2D condition) or on CA scaffolds (CA condition) at 50,000 cells per well using fully supplemented culture media. The 50,000 cells per well density provided an equal number of cells seeded in 2D and 3D cultures without the 2D cultures overgrowing the 2D well. Furthermore, we found that 50,000 cells allowed us to observe cells throughout the entire scaffold without overpopulating it. While this seeding density is much lower than the cell density in cancer tissues, this seeding density allows for assessment of the specific influence of the scaffold material on the seeded cells. All three cell lines (TRAMP-C2 prostate cancer, SK-Hep-1 liver cancer, and MDA-MB-231 breast cancer) showed delayed growth rates in CA scaffolds (p < 0.01) as compared to 2D surfaces (Fig. 2). The TRAMP-C2 2D culture showed a decrease in cell population at the 15 day time point, which is attributed to the rapid cell growth of this cell line causing cells to become overgrown and requiring subculturing. After 5, 10, and 15 days of culture, cells were fixed, dehydrated, and supercritically dried for scanning electron microscopy (SEM) imaging to assess cell morphology. SEM images (Fig. 3) revealed significant morphological differences between 2D and CA scaffold cultured cells. In CA scaffolds, cells had a more rounded morphology and grew into large clumps of cells or tumor spheroids. Alternatively, cells grown on 2D culture wells had much more epithelial-like morphology and grew into sheets.
Figure 1.
Chitosan-alginate (CA) scaffold morphology and properties. A) CA scaffolds as prepared, sectioned, and wet. B) key scaffold properties. C) stress- strain plot for scaffolds. D-F) SEM images of scaffold cross-sections showing D) uniformity of pores, E) scaffold pore morphology, and F) pore wall topography. Scale bars are A) 1 cm; D) 500 μm; E) 200 μm; and F) 10 μm.
Figure 2.
Growth rate comparison of cells cultured on 2D surfaces and in CA scaffolds as determined by Alamar blue. A) TRAMP-C2; B) SK-Hep-1; C) MDA-MB-231, ** indicates p < 0.01.
Figure 3.
SEM images of SK-Hep-1 (hepatocellular carcinoma), TRAMP-C2 (prostate cancer), and MDA-MB-231 (breast cancer) cells cultured in 2D well plates and CA scaffolds at day 10. Cells cultured on 2D plates have a more epithelial-like appearance whereas cells cultured in CA scaffolds have a more rounded appearance and form tumor spheroids. Scale bar represents 20 μm.
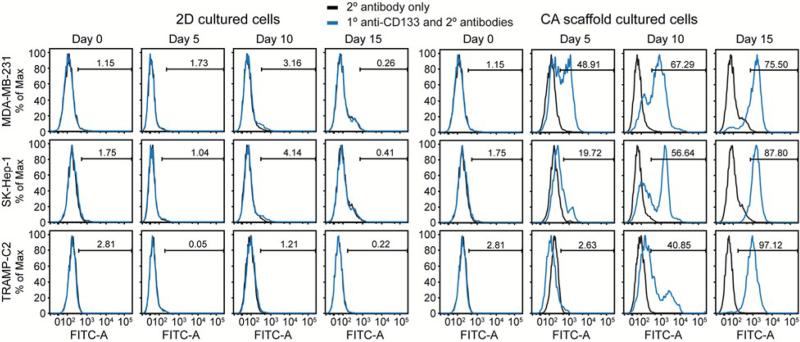
To assess how these different culture conditions affect the CSC population, cells were detached using Versene, stained with a CD133 antibody that recognizes a non-glycosylated epitope, and analyzed using flow cytometry (Fig. 4). As expected,27, 28 2D cultured cells maintained a low level of CSC-like cells throughout the 15 day culture. Conversely, cells cultured on CA scaffolds showed a dramatic increase in CSC-like population over time suggesting that CA scaffolds promote the growth of CSC-like cells. These results indicate that CA scaffold cultures enriched the CD133+ cell population compared to standard 2D cultures, with the findings being consistent across different cancer types. 2D culture maintained a small sub-population of CD133+ cells while CA culture promoted a statistically significant increase in CD133+ cell number (p < 0.05), particularly at later time points (Fig. 5).
Figure 4.
Flow cytometry histograms for 2D and CA cultured cells for CD133 expression. Cells were cultured on 2D culture plates or in CA scaffolds for 0, 5, 10, and 15 days before staining for CD133 and analyzing with flow cytometry. Low levels of CD133+ cells were observed at each time point for 2D (left) and enrichment of CD133+ cells was observed at increasing time points for CA (right).
Figure 5.
CD133+ cell growth rate in 2D cultures (green) vs. CA scaffolds (blue) for A) prostate (TRAMP-C2), B) breast (MDA-MB-231), and C) liver cancer (SK-Hep-1) cell lines, * indicates p < 0.05 and ** indicates p < 0.01. The number of CD133+ cells was calculated from Alamar blue assay for cell growth and flow cytometry data.
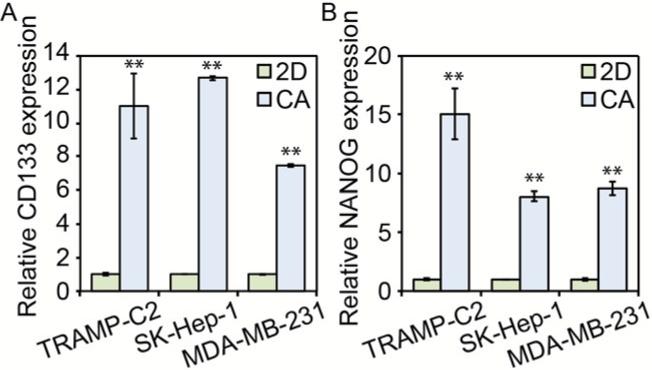
To further test whether the enrichment of CD133+ cells corresponded to the enrichment of CSC-like cells, mRNA abundance of CD133 and NANOG were probed using PCR (Fig. 6). As expected from the flow cytometry results, CD133 mRNA abundance was significantly increased in cells cultured in CA scaffolds (p < 0.01). Additionally, NANOG mRNA abundance was also increased in CA scaffold cultured cells (p < 0.01), further suggesting increased stemness. NANOG is a transcription factor involved in stem cell proliferation and self-renewal, and its expression has been shown to be elevated in CSC-like cells including those of breast and prostate tumors.29-31
Figure 6.
PCR data for stem cell marker expression prostate, liver, and breast cancer cells. Both A) CD133 and B) NANOG expression were considerably higher in prostate cancer (TRAMP-C2), liver cancer (SK-Hep-1), and breast cancer (MDA-MB-231) cells cultured for 10 days in CA scaffolds than those in 2D plates, ** indicates p < 0.01. Expression of CD133 or NANOG mRNA was normalized to B-actin and the 2D culture condition.
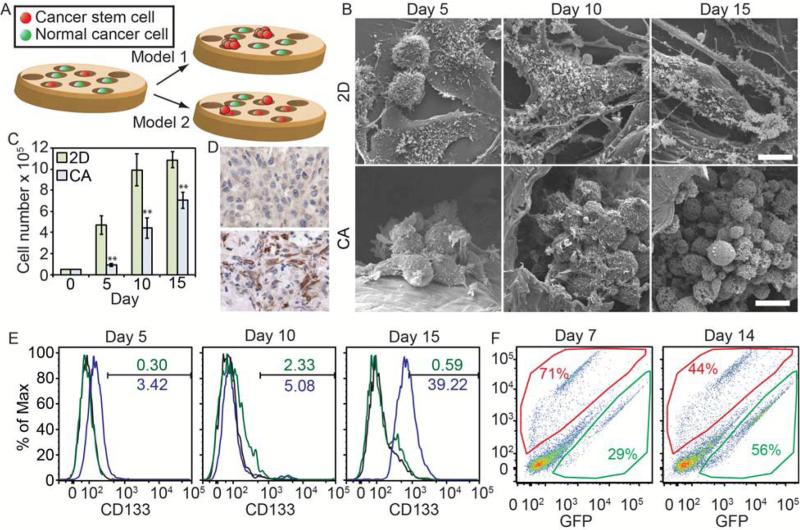
There are two potential mechanisms of CSC enrichment in CA scaffolds (Fig. 7A). In the first potential mechanism (model 1), the CA scaffold could be isolating individual cells in different pores which could mimic dilute culture conditions such as in the tumor sphere assay or growth in soft-agar. If this is the case, only the CSC population would be able to proliferate, so we would expect the majority of cells in CA scaffold cultures to be CSCs at early time points. Over time, we would expect the percentage of CSCs to decrease as proliferating CSCs can give rise to both CSC and non-CSC progeny.32 Another possibility is that the non-CSC progeny are not able to survive on the scaffold, so only CSCs survive and the percentage of CSCs would continue to increase over time. The other potential mechanism of CSC enrichment on CA scaffolds (model 2) is that the scaffolds promote the conversion of non-CSCs to CSCs, potentially through epithelial-to-mesenchymal transition (EMT).33-38 If this were the case, we would expect the CSC population to be similar in both CA scaffold and 2D cultures at early time points. As cells in the CA scaffold undergo EMT, a higher percentage of CSCs would be observed. To identify a putative mechanism, we cultured well-studied U-87 MG human glioblastoma cells in the scaffolds and monitored changes in growth characteristics.
Figure 7.
Mechanism for CSC enrichment in CA scaffolds. A) Putative models for CSC enrichment in CA scaffolds. Model 1 indicates that only the CSCs are able to grow within the scaffold. Model 2 indicates that CSCs grow within the scaffold and that the scaffold promotes the de-differentiation of non-CSCs into CSCs. B) SEM images of U-87 MG human glioblastoma cells growing on 2D surfaces and CA scaffolds showing their growth is similar to other cancer types. Scale bars represent 10 μm. C) U-87 MG cells grown on CA scaffolds have a delayed growth profile suggesting the cells must adapt to the CA scaffold environment before proliferating, ** indicates p < 0.01. D) Histological analysis of CD133 expression in tumors from mice implanted with U-87 MG cells from 2D (top) or CA (bottom) culture. Tumors from 2D precultured cells showed very little staining for CD133 (brown) whereas tumors from CA precultured cells showed large amounts of staining. E) Flow cytometry analysis of proportion CD133+ U-87 MG cells grown on 2D (green) or in CA scaffolds (blue) over 15 days. F) Flow cytometry analysis of CA scaffold preconditioned (RFP+, red) and naive (GFP+, green) glioblastoma cell co-cultured samples collected from CA scaffolds after 7 and 14 days of culture. Preconditioned cells initially grew more rapidly within the scaffolds, but eventually even numbers of naïve and preconditioned cells were present.
In 2D culture, cells proliferate rapidly and become confluent within 10 days before growth slows. On the other hand, cells in CA scaffolds show delayed growth into tumor spheres (Fig. 7B) up to 5 and 10 days before rapid proliferation occurs (Fig. 7C), similar to the TRAMP-C2, SK-Hep-1, and MDA-MB-231 cells. Cells collected from the scaffolds and implanted into the flanks of nude mice grew tumors that had much higher expression of CD133 as compared to those from 2D culture. The increase in growth rate at day 10 is concurrent with the increase in number of CD133+ cells on the CA scaffolds (Fig. 7D, E), which fits into both models and indicates that after an initial delay either CD133+ cells were preferentially expanding or that growing cells were undergoing an EMT, similar to that observed with TRAMP-C2, SK-Hep-1, and MDA-MB-231 cells. To better identify the model for how CA scaffolds enrich CSCs, RFP+ cells were pre-cultured in CA scaffolds for 10 days to allow for CSC enrichment, then were detached with Versene. GFP+ cells were pre-cultured in standard T-75 flasks prior to seeding the mixture of GFP+ and RFP+ cells (25,000 each) in new CA scaffolds. After 7 and 14 days, cells were detached from scaffolds using Versene and proportions quantified using flow cytometry. The plots (Fig. 7F) show RFP+ cells in the upper portion, GFP+ cells in the lower portion, and the rest of the events are cell and scaffold debris. The results indicate that CA scaffold pre-cultured cells (RFP+ cells) were able to proliferate more rapidly upon re-seeding in scaffolds over 7 days (~2.5:1 ratio of RFP+:GFP+ cells), but cell number was then slowly taken over by GFP+ cells by day 14 (~1:1 ratio of RFP+:GFP+ cells) after the GFP+ cells started to proliferate more rapidly after the 10 days needed for enrichment and expansion after EMT observed in Fig 7C and E. This suggests that pre-cultured RFP+ cells are conditioned to grow on the scaffold, and once cells have been cultured in scaffolds long enough to form a large tumor spheres causing diffusion and space limitations, their growth rate decreases. In toto, these data suggest model 2 as the mechanism for CSC enrichment within CA scaffolds.
This enrichment of CSCs on CA scaffolds is likely due to the combination of unique 3D microenvironment of the scaffold and the chemical structure of the CA matrix. Chitosan and alginate share structural similarity to glycosaminoglycans (GAGs), natural polymers that make up the extracellular matrix. Specifically, hyaluronan (HA) is a GAG composed of alternating repeat units of glucuronic acid and acetylglucosamine, the components of alginate and chitosan, respectively. HA is present in many tissues and accumulates in sites of inflammation, tumorigenesis, and invasion.39-41 Most importantly, HA is thought to play a central role in EMT through extracellular matrix-cell surface receptor downstream signalling.42, 43 We have previously demonstrated that cells cultured on 3D synthetic polymer scaffolds did not enrich for CSCs, nor did cells cultured on CA scaffolds coated with synthetic polymer, indicating that the combination of 3D structure and HA-mimicking chemistry is necessary for CSC enrichment.17 Cells cultured on CA scaffolds are in a 3D environment rich in HA-mimicking material, which induces EMT and enrichment of CSCs. Further characterization of the influence of scaffold chemistry and scaffold stiffness on CSC enrichment will be performed by comparing CA scaffolds with chitosan-hyaluronic acid (C-HA) scaffolds produced by our group15 or characterizing the influence of CA scaffold stiffness by examining different concentration CA scaffolds.
Conclusions
We have shown that culturing cells from different cancers types in CA scaffolds enriches for the CSC-like population of cells suggesting the microenvironment of the CA scaffolds is conducive to CSC enrichment and survival. This suggests that CA scaffolds are a versatile culture platform that promotes greater malignancy during in vitro culture by enrichment of CSC population. Further studies comparing these porous CA scaffolds with other culture formats that have been demonstrated to promote CSC enrichment, including fibrin gel, poly(lactide-co-glycolide), and collagen scaffolds, along with co-culture studies with stromal cells will provide a greater insight into the behavior of CSCs. These CA scaffolds should provide researchers with a high throughput tool for studying and developing therapies against CSCs in vitro.
Acknowledgements
This work was supported in part by NIH grants R01CA172455 and a Kyocera Professorship Endowment. K.W. acknowledges support from the University of Washington College of Engineering Dean's Fellowship. We acknowledge the use of the SEM at the Dept. of Materials Science and Engineering, the confocal and optical microscopes at Keck Microscopy Imaging Facility, and the flow cytometers at the Dept. of Immunology at the University of Washington. We acknowledge laboratory assistance from Ms. Allison M. Lewis in preparing CA scaffolds. We thank Benjamin S. Glick for submitting the RFP plasmid to AddGene.
Footnotes
§ S.J.F., F.M.K., and M.Z. declare financial interest in patents filed by UW on the CA scaffold technology.
References
- 1.Bonnet D, Dick JE. Nat Med. 1997;3:730–737. doi: 10.1038/nm0797-730. [DOI] [PubMed] [Google Scholar]
- 2.Lapidot T, Sirard C, Vormoor J, Murdoch B, Hoang T, Caceres-Cortes J, Minden M, Paterson B, Caligiuri MA, Dick JE. Nature. 1994;367:645–648. doi: 10.1038/367645a0. [DOI] [PubMed] [Google Scholar]
- 3.Fialkow PJ, Gartler SM, Yoshida A. Proc Natl Acad Sci U S A. 1967;58:1468–1471. doi: 10.1073/pnas.58.4.1468. [DOI] [PMC free article] [PubMed] [Google Scholar]
- 4.Hamburger AW, Salmon SE. Science. 1977;197:461–463. doi: 10.1126/science.560061. [DOI] [PubMed] [Google Scholar]
- 5.Al-Hajj M, Wicha MS, Benito-Hernandez A, Morrison SJ, Clarke MF. Proc Natl Acad Sci U S A. 2003;100:3983–3988. doi: 10.1073/pnas.0530291100. [DOI] [PMC free article] [PubMed] [Google Scholar]
- 6.Singh SK, Hawkins C, Clarke ID, Squire JA, Bayani J, Hide T, Henkelman RM, Cusimano MD, Dirks PB. Nature. 2004;432:396–401. doi: 10.1038/nature03128. [DOI] [PubMed] [Google Scholar]
- 7.Visvader JE, Lindeman GJ. Nat Rev Cancer. 2008;8:755–768. doi: 10.1038/nrc2499. [DOI] [PubMed] [Google Scholar]
- 8.O'Brien CA, Kreso A, Jamieson CH. Clin Cancer Res. 2010;16:3113–3120. doi: 10.1158/1078-0432.CCR-09-2824. [DOI] [PubMed] [Google Scholar]
- 9.Sinyuk M, Alvarado AG, Nesmiyanov P, Shaw J, Mulkearns-Hubert EE, Eurich JT, Hale JS, Bogdanova A, Hitomi M, Maciejewski J, Huang AY, Saunthararajah Y, Lathia JD. Oncotarget. 2015;6:31508–31521. doi: 10.18632/oncotarget.5226. [DOI] [PMC free article] [PubMed] [Google Scholar]
- 10.Hanahan D, Weinberg RA. Cell. 2011;144:646–674. doi: 10.1016/j.cell.2011.02.013. [DOI] [PubMed] [Google Scholar]
- 11.Zhou BBS, Zhang HY, Damelin M, Geles KG, Grindley JC, Dirks PB. Nat. Rev. Drug Discov. 2009;8:806–823. doi: 10.1038/nrd2137. [DOI] [PubMed] [Google Scholar]
- 12.Infanger DW, Cho Y, Lopez BS, Mohanan S, Liu SC, Gursel D, Boockvar JA, Fischbach C. Cancer Research. 2013;73:7079–7089. doi: 10.1158/0008-5472.CAN-13-1355. [DOI] [PMC free article] [PubMed] [Google Scholar]
- 13.Liu J, Tan Y, Zhang H, Zhang Y, Xu P, Chen J, Poh Y-C, Tang K, Wang N, Huang B. Nature Materials. 2012;11:734–741. doi: 10.1038/nmat3361. [DOI] [PMC free article] [PubMed] [Google Scholar]
- 14.Chen L, Xiao Z, Meng Y, Zhao Y, Han J, Su G, Chen B, Dai J. Biomaterials. 2012;33:1437–1444. doi: 10.1016/j.biomaterials.2011.10.056. [DOI] [PubMed] [Google Scholar]
- 15.Florczyk SJ, Wang K, Jana S, Wood DL, Sytsma SK, Sham JG, Kievit FM, Zhang M. Biomaterials. 2013;34:10143–10150. doi: 10.1016/j.biomaterials.2013.09.034. [DOI] [PMC free article] [PubMed] [Google Scholar]
- 16.Kievit FM, Florczyk SJ, Leung MC, Veiseh O, Park JO, Disis ML, Zhang M. Biomaterials. 2010;31:5903–5910. doi: 10.1016/j.biomaterials.2010.03.062. [DOI] [PMC free article] [PubMed] [Google Scholar]
- 17.Kievit FM, Florczyk SJ, Leung MC, Wang K, Wu JD, Silber JR, Ellenbogen RG, Lee JS, Zhang M. Biomaterials. 2014;35:9137–9143. doi: 10.1016/j.biomaterials.2014.07.037. [DOI] [PMC free article] [PubMed] [Google Scholar]
- 18.Kievit FM, Wang K, Erickson AE, Lan Levengood SK, Ellenbogen RG, Zhang M. Biomater Sci. 2015 doi: 10.1039/c5bm00514k. DOI: 10.1039/c5bm00514k. [DOI] [PMC free article] [PubMed] [Google Scholar]
- 19.Wang K, Kievit FM, Florczyk SJ, Stephen ZR, Zhang M. Biomacromolecules. 2015;16:3362–3372. doi: 10.1021/acs.biomac.5b01032. [DOI] [PMC free article] [PubMed] [Google Scholar]
- 20.Florczyk SJ, Kim D-J, Wood DL, Zhang M. Journal of Biomedical Materials Research Part A. 2011;98A:614–620. doi: 10.1002/jbm.a.33153. [DOI] [PubMed] [Google Scholar]
- 21.Gil ES, Kluge JA, Rockwood DN, Rajkhowa R, Wang L, Wang X, Kaplan DL. J Biomed Mater Res A. 2011;99:16–28. doi: 10.1002/jbm.a.33158. [DOI] [PMC free article] [PubMed] [Google Scholar]
- 22.Kirdponpattara S, Khamkeaw A, Sanchavanakit N, Pavasant P, Phisalaphong M. Carbohydr Polym. 2015;132:146–155. doi: 10.1016/j.carbpol.2015.06.059. [DOI] [PubMed] [Google Scholar]
- 23.O'Brien J, Wilson I, Orton T, Pognan F. Eur J Biochem. 2000;267:5421–5426. doi: 10.1046/j.1432-1327.2000.01606.x. [DOI] [PubMed] [Google Scholar]
- 24.Li Z, Ramay HR, Hauch KD, Xiao D, Zhang M. Biomaterials. 2005;26:3919–3928. doi: 10.1016/j.biomaterials.2004.09.062. [DOI] [PubMed] [Google Scholar]
- 25.Yu H, Mouw JK, Weaver VM. Trends in Cell Biology. 2011;21:47–56. doi: 10.1016/j.tcb.2010.08.015. [DOI] [PMC free article] [PubMed] [Google Scholar]
- 26.Cox TR, Erler JT. Disease Models & Mechanisms. 2011;4:165–178. doi: 10.1242/dmm.004077. [DOI] [PMC free article] [PubMed] [Google Scholar]
- 27.Kelly SE, Di Benedetto A, Greco A, Howard CM, Sollars VE, Primerano DA, Valluri JV, Claudio PP. PLoS One. 2010;5:e10035. doi: 10.1371/journal.pone.0010035. [DOI] [PMC free article] [PubMed] [Google Scholar]
- 28.Nakanishi T, Chumsri S, Khakpour N, Brodie AH, Leyland-Jones B, Hamburger AW, Ross DD, Burger AM. Br J Cancer. 2010;102:815–826. doi: 10.1038/sj.bjc.6605553. [DOI] [PMC free article] [PubMed] [Google Scholar]
- 29.Jeter CR, Liu B, Liu X, Chen X, Liu C, Calhoun-Davis T, Repass J, Zaehres H, Shen JJ, Tang DG. Oncogene. 2011;30:3833–3845. doi: 10.1038/onc.2011.114. [DOI] [PMC free article] [PubMed] [Google Scholar]
- 30.Jeter CR, Yang T, Wang J, Chao HP, Tang DG. Stem Cells. 2015;33:2381–2390. doi: 10.1002/stem.2007. [DOI] [PMC free article] [PubMed] [Google Scholar]
- 31.Lu X, Mazur SJ, Lin T, Appella E, Xu Y. Oncogene. 2014;33:2655–2664. doi: 10.1038/onc.2013.209. [DOI] [PMC free article] [PubMed] [Google Scholar]
- 32.Chen R, Nishimura MC, Bumbaca SM, Kharbanda S, Forrest WF, Kasman IM, Greve JM, Soriano RH, Gilmour LL, Rivers CS, Modrusan Z, Nacu S, Guerrero S, Edgar KA, Wallin JJ, Lamszus K, Westphal M, Heim S, James CD, VandenBerg SR, Costello JF, Moorefield S, Cowdrey CJ, Prados M, Phillips HS. Cancer Cell. 2010;17:362–375. doi: 10.1016/j.ccr.2009.12.049. [DOI] [PubMed] [Google Scholar]
- 33.Kong D, Banerjee S, Ahmad A, Li Y, Wang Z, Sethi S, Sarkar FH. PLoS One. 2010;5:e12445. doi: 10.1371/journal.pone.0012445. [DOI] [PMC free article] [PubMed] [Google Scholar]
- 34.Mani SA, Guo W, Liao MJ, Eaton EN, Ayyanan A, Zhou AY, Brooks M, Reinhard F, Zhang CC, Shipitsin M, Campbell LL, Polyak K, Brisken C, Yang J, Weinberg RA. Cell. 2008;133:704–715. doi: 10.1016/j.cell.2008.03.027. [DOI] [PMC free article] [PubMed] [Google Scholar]
- 35.Mikheeva S, Mikheev A, Petit A, Beyer R, Oxford R, Khorasani L, Maxwell J-P, Glackin C, Wakimoto H, Gonzalez-Herrero I, Sanchez-Garcia I, Silber J, Horner P, Rostomily R. Molecular Cancer. 2010;9:194. doi: 10.1186/1476-4598-9-194. [DOI] [PMC free article] [PubMed] [Google Scholar]
- 36.Ouyang G, Wang Z, Fang X, Liu J, Yang CJ. Cell Mol Life Sci. 2010;67:2605–2618. doi: 10.1007/s00018-010-0338-2. [DOI] [PMC free article] [PubMed] [Google Scholar]
- 37.Santisteban M, Reiman JM, Asiedu MK, Behrens MD, Nassar A, Kalli KR, Haluska P, Ingle JN, Hartmann LC, Manjili MH, Radisky DC, Ferrone S, Knutson KL. Cancer Res. 2009;69:2887–2895. doi: 10.1158/0008-5472.CAN-08-3343. [DOI] [PMC free article] [PubMed] [Google Scholar]
- 38.Wellner U, Schubert J, Burk UC, Schmalhofer O, Zhu F, Sonntag A, Waldvogel B, Vannier C, Darling D, zur Hausen A, Brunton VG, Morton J, Sansom O, Schuler J, Stemmler MP, Herzberger C, Hopt U, Keck T, Brabletz S, Brabletz T. Nat Cell Biol. 2009;11:1487–1495. doi: 10.1038/ncb1998. [DOI] [PubMed] [Google Scholar]
- 39.Misra S, Heldin P, Hascall VC, Karamanos NK, Skandalis SS, Markwald RR, Ghatak S. Febs J. 2011;278:1429–1443. doi: 10.1111/j.1742-4658.2011.08071.x. [DOI] [PMC free article] [PubMed] [Google Scholar]
- 40.Toole BP. Nat. Rev. Cancer. 2004;4:528–539. doi: 10.1038/nrc1391. [DOI] [PubMed] [Google Scholar]
- 41.Toole BP. Clin. Cancer Res. 2009;15:7462–7468. doi: 10.1158/1078-0432.CCR-09-0479. [DOI] [PMC free article] [PubMed] [Google Scholar]
- 42.Huber MA, Kraut N, Beug H. Curr. Opin. Cell Biol. 2005;17:548–558. doi: 10.1016/j.ceb.2005.08.001. [DOI] [PubMed] [Google Scholar]
- 43.Itano N, Kimata K. Seminars in Cancer Biology. 2008;18:268–274. doi: 10.1016/j.semcancer.2008.03.006. [DOI] [PubMed] [Google Scholar]


