

Abstract
The confident identification and in-depth profiling of molecular lipid species remain to be a challenge in lipidomics analysis. In this work, an off-line two-dimensional mixed-mode and reversed-phase liquid chromatography (RPLC) method combined with high-field quadrupole orbitrap mass spectrometer (Q Exactive HF) was developed to profile lipids from complex biological samples. In the first dimension, 22 different lipid classes were separated on a monolithic silica column with elution order from neutral to polar lipids. A total of 13 fractions were collected and run on a RPLC C30 column in the second dimension for further separation of the lipid molecular species based on their hydrophobicity, with the elution order being determined by both the length and degree of unsaturation in the fatty-acyl chain. The method was applied to analyze lipids extracted from rat plasma and rat liver. Fatty acid methyl ester analysis by gas chromatography-mass spectrometry was used to identify the fatty acyls from total lipid extracts, which provided a more confident identification of the lipid species present in these samples. More than 800 lipids were identified in each sample and their molecular structures were confidentially confirmed using tandem mass spectrometry (MS/MS). The number of lipid molecular species identified in both rat plasma and rat liver by this off-line two-dimensional method is approximately twice of that by one-dimensional RPLC-MS/MS employing a C30 column. This off-line two-dimensional mixed-mode LC-RPLC-MS/MS method is a promising technique for comprehensive lipid profiling in complex biological matrices.
Keywords: Rat plasma lipidome, rat liver lipidome, off-line two-dimensional liquid chromatography, untargeted lipidomics, monolithic column, Accucore C30 column
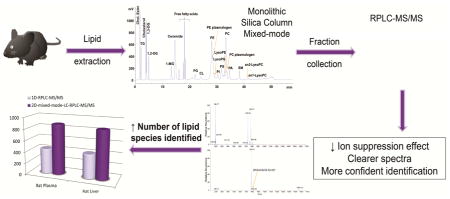
Graphical abstract
1. INTRODUCTION
Lipids are important constituents of all biological tissues and have diverse functions ranging from signal transduction in cells, to structural components of cell membrane and sources of energy. Due to the enormous sample complexity and wide variety of physical properties that different classes of lipids possess, the analysis of them in biological tissues and fluids remains a challenge.
Different methods have been implemented for lipidomic analysis. One of the most used and fastest methods is the analysis of the total lipid extract by one-dimensional reversed-phase liquid chromatography (RPLC) coupled with mass spectrometry (MS), which separates lipid molecules based on the interaction between the hydrophobic stationary phase and the hydrophobicity of fatty acyls (including the number and position of unsaturation), in addition to the polarity of lipid head group [1]. RPLC-MS/MS technique allows a fast analysis of all lipids in just one run, sometimes in only 30 minutes. Generic gradients based on acetonitrile/isopropanol/water are the most used for global lipidomic analysis, but the stationary phases used have evolved over the years. Among them, the mostly used packing material has been C18, with particle sizes ranging from 5 to sub-2 μm for better resolving power. Core-shell particles have become more popular in recent years for their reduced resistance to mass transfer and high particle uniformity, overcoming the ultrahigh backpressure resulted from the porous sub-2 μm particles [2]. Recently, we applied a C30 column to the analysis of complex lipid samples and compared it with several C18 columns, the results showed that it has excellent peak capacity and retention time reproducibility, besides of allowing the highest number of lipids identified in rat plasma and liver samples [3].
One-dimensional hydrophilic interaction liquid chromatography (HILIC) coupled with high-resolution/accuracy mass spectrometry has also been used in the analysis of global lipidome; however, it cannot be used for the quantification of nonpolar lipid classes due to the elution of these species in the void volume [4]. Therefore, HILIC has been mainly used in the analysis of different classes of phospholipids, demonstrating good performance in some methods found in the literature [5], while presenting problems of co-elution of certain classes, like PS and PE, in others [6]. Significant improvement in class-based lipid separation has been achieved recently when hybrid silica stationary phase column was employed in ultrahigh-performance supercritical fluid chromatography (UHPSFC), where both non polar and polar lipid classes can be well separated [7].
Other method used to address the total lipidomic analysis is the direct infusion (shotgun) tandem mass spectrometric (MS) methods for quickly profiling lipid species [8, 9], but they are not capable of differentiating isobaric and isomeric lipids due to omission of the chromatographic separation steps and the potential ion suppression issues in these methods [10]. Novel multiplexed approach for extraction of lipids, implementation of multiple informative dimensions for MS interrogation and new bioinformatics approaches for enhanced identification and quantitation have been developed recently to overcome the limitations of this technique [9].
Due to the complexity of biological samples, RPLC, HILIC or direct infusion alone may not be sufficient for comprehensive lipidomic characterization, because more abundant species could mask lipids exist at trace level, which would render some biologically significant lipids unidentifiable. For that reason, to enhance the identification and quantification of lipids, several techniques, like thin layer chromatography (TLC), solid phase extraction (SPE) and normal phase liquid chromatography (NPLC), have been used for purification and fractionation of different lipid classes [11]. While TLC and SPE can only separate three different fractions that contain non-polar (triacylglycerols and cholesterol esters), medium polarity (diacylglycerols, monoacylglycerols and free fatty acids) and polar lipids (glycerophospholipids and sphingolipids), NPLC is capable of separating all classes, and the much more refined class-based separation reduces the number of lipid classes collected in each fraction and separates lipid classes that contain isobaric species into different fractions. However, it is challenging to get a good separation of total lipids extract so that each peak only corresponding to one lipid class, due to the close similarity of the polarity of certain lipid classes. Silica columns have been widely used for a few decades for this purpose [12], and separation of 12 lipid classes is by far one of the best found in the literature with this type of stationary phase [13]. On the other hand, monolithic columns have not been used frequently as the silica ones, but in recent years, some applications of these columns showed a good separation for up to17 classes of lipids [14]. These columns vary from the traditional silica columns in that they contain a silica rod instead of particles, which provides a very high porosity of the stationary phase and allows chromatography with much lower back-pressure, and therefore, high flow rates can be achieved. HILIC has also gained popularity in the last few years and achieved success in separation of 19 classes of lipids [15], but as mention before, it is not a good option for those low polarity lipid classes.
The problem of trace lipids being masked by the most abundant species in one-dimensional chromatographic separation can be overcome by using two-dimensional HPLC, in which the complex lipidomic samples are separated according to the lipid head group in one dimension and then according to the hydrophobic property of the molecule in the other dimension. This technique can be performed either in on-line [13, 16] or off-line mode [15]. Both modes have advantages and disadvantages. Although RPLC in the first dimension and HILIC in the second dimension have been demonstrated [17], most of the on-line mode uses NPLC/HILIC in the first dimension and RPLC in the second dimension for maximum separation power. Due to the incompatibility of the effluents from the first dimension with the second dimension column, stop-flow in the first NPLC dimension coupled with a solvent evaporation interface [13], dual loop trapping coupled with solvent evaporation for continuous separation in the first NPLC dimension [18], stop-flow in the first HILIC dimension [5], and stop-flow in the first HILIC dimension coupled with trap column [19] have been developed over the years. However, sophisticated set-up, band broadening, and less run to run reproducibility still exist on these systems. On the other hand, the off-line two-dimensional HPLC is more laborious and time consuming, but it allows the separation conditions in both dimensions being fully optimized, which could provide in-depth coverage of a complex lipidome.
In this work, we combined a monolithic silica-based mixed-mode LC, operated as NPLC and HILIC, and a C30 particle-based RPLC in off-line mode to comprehensively separate complex lipidomic samples into 22 lipid classes, followed by further separation of each lipid class into lipid molecules according to the head group polarity and the hydrophobicity of the lipids. When this off-line two-dimensional HPLC separation technique was coupled to a high resolution mass spectrometer, it greatly enhanced the accuracy in structural elucidation and the number of lipids identified from complex biological samples.
2. MATERIALS AND METHODS
2.1 Materials
Ammonium formate, n-heptane, acetone, methanol, isopropanol (IPA) and water (Optima® LC-MS grade) were obtained from Fisher Scientific (Fair Lawn, New Jersey). Acetonitrile (ACN) and formic acid were of LC/MS quality and acquired from Fluka (Germany). Chloroform (HPLC grade) and ammonia solution were provided by Merck (Germany).
Phospholipids standards and sphingomyelin solution from bovine milk were acquired from Avanti Polar Lipids (Alabaster, AL), while glycerolipids, fatty acids, cholesterol and cholesterol esters were obtained from Nu-Chek Prep, Inc. (Elysian, MN). Phospholipid standard solution from soybean (ref: P3817-1VL) containing phosphatidylethanolamine, phosphatidylcholine, lysophosphatidylcholine and phosphatidylinositol was purchased from Supelco (Bellefonte, PA). Triethylamine (TEA) and cardiolipin from bovine heart were supplied by Sigma-Aldrich (St. Louis, MO). Standard lipid solutions were prepared by dissolution in chloroform. Nonanoic acid methyl ester, hexacosanoic acid methyl ester, octocosanoic acid methyl ester, triacontanoic acid methyl ester and 37 Component FAME Mix, used as reference standard mixture for the fatty acid identification, were obtained from Supelco (Bellefonte, PA).
Pierce LTQ Velos ESI Positive Ion Calibration Solution and Pierce LTQ Velos ESI Negative Ion Calibration Solution were provided by Thermo Fisher Scientific (Waltham, MA, USA).
Rat plasma and liver, collected from the same animal, were obtained from Bioreclamation IVT (Baltimore, MD).
2.2 Sample preparation
Prior to lipid extraction, the liver was homogenized by using an Omni TH homogenizer (Omni International, Warrenton, VA). Lipids were extracted in duplicate from 100 μL aliquot of plasma and 0.05 g of liver according to Folch’s method [20] under cold conditions (−20 °C) using chloroform/methanol (2:1, v/v) in a 5:1 and 20:1 ratios over the sample volume, respectively. The mixtures were vortexed for 10 s and allowed to stand on ice for 10 min. After being mixed again by vortexing, they were centrifuged at 9,279g for 10 min. For plasma samples, 400 μL of the organic layers were collected, while for the liver samples, all the organic solvents were collected and filtered through filter paper (Fisher Scientific). Then, the extracts were evaporated to dryness under vacuum. Prior to mixed-mode fractionation, the lipid extracts were reconstituted in 10 μL of chloroform for plasma samples while in the case of liver samples, the residue was re-dissolved at a final concentration of 0.10 μg μL−1. The whole procedure was carried out using glass vials to avoid contaminations from containers.
2.3 Lipid fractionation using monolithic silica column
Mixed-mode fractionation of total lipid extracts into lipid classes was performed using a Chromolith Performance Si column (100mm×4.6mm, macropores size 2.1μm and mesopores size 13nm, Merck, Darmstadt, Germany). The HPLC system consisted of an Agilent (Palo Alto, CA, USA) 1200 liquid chromatograph, with a quaternary pump, an autosampler with variable injection volume (0 – 100 μL), a column oven and an Agilent 1260 Infinity evaporative light scattering detector (ELSD) (Palo Alto, CA, USA). A 1200 Infinity interface Box II was used for controlling and monitoring the system. The temperature of the column was held at 25 °C. Gradient elution was carried out using different ratios of the following solvents and solutions: A: Heptane, B: Acetone, C: chloroform:methanol:ammonia solution (80:19.5:0.5, v/v/v) and D chloroform:methanol:TEA:water (69.53:25.58:0.49:4.40, v/v/v/v). An optimized separation was obtained using the gradient showed in Table 1. The injection volume was 10 μL.
Table 1.
Gradient used in the first-dimension mixed-mode liquid chromatography. A: heptane, B: acetone, C: chloroform:methanol:ammonia solution (80:19.5:0.5, v/v/v) and D: chloroform:methanol:TEA:water (69.53:25.58:0.49:4.40, v/v/v/v).
| Time (min) | %A | %B | %C | %D | Flow Rate (mL min−1) |
|---|---|---|---|---|---|
| 0 | 94 | 6 | 0 | 0 | 1.0 |
| 9 | 85 | 15 | 0 | 0 | 1.0 |
| 11 | 80 | 20 | 0 | 0 | 1.0 |
| 12 | 80 | 20 | 0 | 0 | 1.0 |
| 17 | 0 | 0 | 100 | 0 | 1.0 |
| 22 | 0 | 0 | 100 | 0 | 1.0 |
| 27 | 0 | 0 | 60 | 40 | 1.0 |
| 29 | 0 | 0 | 60 | 40 | 1.0 |
| 42 | 0 | 0 | 0 | 100 | 1.0 |
| 49 | 0 | 0 | 0 | 100 | 1.0 |
| 51 | 0 | 0 | 100 | 0 | 5.0 |
| 54 | 0 | 0 | 100 | 0 | 5.0 |
| 55 | 94 | 6 | 0 | 0 | 5.0 |
| 58 | 94 | 6 | 0 | 0 | 5.0 |
Elution of different lipids occurred during the first 49 min and a post-run time of 9 min was added to equilibrate the column before the next injection. For operation of ELSD, nitrogen was used as the nebulizing gas. The ELSD nebulizer and evaporator temperature were both set at 30 °C, and the nitrogen gas flow was set at 1.5 L min−1. The peak area of each lipid was used as the analytical signal.
Fractions of lipid classes were collected using an Agilent 1260 fraction collector, evaporated to dryness under vacuum and dissolved in 10 μL of ACN/IPA/water (65:30:5, v/v/v) for the following RPLC-MS/MS analysis.
2.4 RPLC-MS/MS conditions
The different lipid fractions were analyzed according to our previous work [3]. A Vanquish UHPLC system (ThermoFisher Scientific) with a binary pump and an autosampler was used for this study, which was online coupled to a Q Exactive HF (QEHF) hybrid quadrupole-Orbitrap mass spectrometer (ThermoFisher Scientific). The separation was performed using a core-shell Accucore C30 column (ThermoFisher Scientific). The column oven temperature was 40 °C. A generic binary gradient elution was carried out using different ratios of eluents A (ACN:water, 60:40,v/v) and B (IPA:ACN, 90:10, v/v), both containing 10 mM ammonium formate and 0.1% formic acid and the following gradient: −3 - 0 min isocratic elution with 30% B for the equilibration of the column; 0 – 5 min, 30% – 43% B; 5 – 5.1 min, 43 – 50%; 5.1 – 14 min, 50 – 70% B; 14.1 to 21 min, 70% – 99% B; 21 – 24 min, 99% B; 24 – 24.1 min, 99 – 30%; 24.1 –28 min, 30% B for column washing and equilibration. The separation time for the analytes was 24 min and the total analysis time including column re-equilibration was 31 min. The flow rate was set to 350 μL min−1 and the temperature of the sample tray at 15 °C. The injection volume was 5 μL.
All MS experiments were performed on the QEHF using a Heated Electro Spray Ionization (HESI) source. Tune parameters were optimized using PC(18:1(9Z)/18:1(9Z)), Cer(d18:1/18:1(9Z)), PG(18:1(9Z)/18:1(9Z)) in both negative and positive ion modes, and TG(16:0/16:0/16:0), DG(18:1(9Z)/18:1(9Z)/0:0) and 18:1 cholesteryl ester in positive ion mode. A sweep cone was used for best performance and protection of the system due to the high flow rate used. The flow rates of sheath gas and sweep gas for both polarities were 20 and 1 (arbitrary units), respectively, while the auxiliary gas rate was 5 for positive and 7 for negative. The spray voltage, the capillary temperature and the heater temperature were maintained at 3 kV, 350 °C and 400 °C, respectively, for both ionization modes. The S-Lens RF level was set at 50. The Orbitrap mass analyzer was operated at a resolving power of 120,000 in full-scan mode (scan range: 114 – 1700 m/z; automatic gain control target: 1e6) and of 30,000 in the Top20 data-dependent MS2 mode (HCD fragmentation with stepped normalized collision energy (NCE): 25 and 30 in positive ion mode, and 20, 24 and 28 in negative ion mode; maximum ion injection time: 100 ms; isolation window: 1 m/z; automatic gain control target: 1e5) with dynamic exclusion setting of 15.0 second.
The QEHF was externally calibrated within a mass accuracy of 1 ppm every week using the Thermo Scientific Pierce LTQ Velos ESI Negative Ion Calibration Solution (mixture containing sodium dodecyl sulfate, sodium taurocholate and Ultramark 1621 in an acetonitrile-methanol-acetic solution) and the Thermo Scientific Pierce LTQ Velos ESI Positive Ion Calibration Solution (containing a mixture of caffeine, tetra peptide MRFA, Ultramark 1621, and N-butylamine in an acetonitrile-methanol-acetic solution).
2.5 Fatty acid analysis
Fatty acid methyl esters (FAMEs) of total lipid extract from rat liver and plasma were analyzed by gas chromatography (GC)-MS. FAMEs were extracted with n-hexane after cold methylation with 2N KOH in methanol, following a method previously described [11, 21]. The FAME profiling was performed using an Agilent 7890 GC system (Agilent Technologies, Santa Clara, CA) coupled to a Leco Pegasus HT time-of-flight MS (Leco, St. Joseph, MI). A HP-88 column (100 m × 0.25 mm) with a film thickness of 0.2 μm (Agilent Technologies) was utilized for separation of FAMEs. Three microliter of sample was injected using splitless and split (ratio 1/15) modes into the GC-MS inlet, which was held at a temperature of 250 °C. The oven temperature was kept at 100 ºC for 3 min and then increased to 175 ºC at a rate of 8 ºC min−1, followed by 3 ºC min−1 up to 240 ºC and held isothermally for 10.0 min. Helium was used as carrier gas and the flow rate was 2 mL min−1. The equilibration time between injections was 0.5 min. The EI source was set to a potential of 70 eV. The temperatures of the MS source and transfer line were both maintained at 250 °C. The mass spectra were acquired in full scan mode at a scan rate and mass range of 10 scan sec−1 and 40 – 500 m/z, respectively.
The individual chromatograms corresponding to the total fatty acid composition of rat liver and rat plasma are shown in Supplemental material together with their corresponding retention times (Figure A.1 and Table A.1).
2.6 Data processing
All LC-MS data were acquired using the software package Xcalibur 3.0. LipidSearch software version 4.1 (Mitsui Knowledge Industry, Tokyo, Japan) was used for lipid molecular species identification and quantification in complex biological samples. Key processing parameters were: precursor tolerance: 5 ppm; product tolerance: 5 ppm; product ion threshold: 5%; m-score threshold: 1; Quan m/z tolerance: ± 5 ppm; Quan RT (retention time) range: ± 0.5 min; use of main isomer filter and ID quality filters A, B, C and D; Adduct ions: +H and +NH4 for positive ion mode, and –H, +HCOO and -2H for negative ion mode. The lipid classes selected for the search were: LysoPC (lysophosphatidylcholine), PC (phosphatidylcholine), LysoPE (lysophosphatidylethanolamine), PE (phosphatidylethanolamine), LysoPS (lysophosphatidylserine), PS (phosphatidylserine), LysoPG (lysophosphatidylglycerol), PG (phosphatidylglycerol), LysoPI (lysophosphatidylinositol), PI (phosphatidylinositol), LysoPA (lysophosphatidic acid), PA (phosphatidic acid), SM (sphingomyelin), MG (monoacylglycerol), DG (diacylglycerol), TG (triacylglycerol), CL (cardiolipin), So (sphingosine), Cer (ceramides), CE (cholesterol ester). The same lipid annotations within ± 0.1 min were merged into the aligned results. These parameters were first optimized using lipid standards before being applied to untargeted lipidomic analysis. Free fatty acids (FA) have not been considered in the identification because the main fragment ion resulted from CO2 loss requires NCE > 50. Consequently, LipidSearch won’t be able to identify FA using product ions if [M-H-44] − is not in the product ion spectrum.
GC-MS chromatograms were deconvoluted using ChromaToF 4.51.6.0 and FAMEs were identified by MS search V2.0 with NIST11 library and in-house FAME library. The fatty acids identified by this method in the total lipid extract were used to filter the lipid species obtained by LipidSearch.
3. RESULTS AND DISCUSSION
3.1 Development and optimization of mixed-mode LC method for lipid fractionation
To achieve the best separation of the maximum number of lipid classes, a new method was developed and the chromatographic conditions were carefully optimized using a mixture of 22 lipid classes, which was composed of the following standards: phospholipids from soybean (sn-1 and sn-2 LysoPC, PC, PE and PI), 18:1 cholesteryl ester, 20:0 cholesteryl ester, cholesterol, PC(P-18:0/18:1(9Z)), LysoPE(18:1(9Z)/0:0), PE(P-18:0/18:1(9Z)), PS(14:0/14:0), PS(18:1(9Z)/18:1(9Z)), PG(14:0/14:0), PG(18:1(9Z)/18:1(9Z)), LysoPG(14:0/0:0), PI(16:0/18:1(9Z)), PA(18:1(9Z)/18:1(9Z)), Cer(d18:1/12:0), Cer(d18:1/18:1(9Z)), FA(12:0), FA(18:1(9Z)), FA(26:0), MG(12:1(11Z)/0:0/0:0), MG(18:1(9Z)/0:0/0:0), DG(14:0/14:0/0:0), DG(14:0/0:0/14:0), TG(14:0/14:0/14:0), TG(16:0/16:0/16:0), CL from bovine heart and SM solution from bovine milk.
3.1.1 Column
It is challenging to achieve total separation of lipid classes with a wide range of polarities that are expected from the lipidome of a highly complex biological sample. HILIC was not chosen for the current study because of, as mentioned before, its inability in class separation of nonpolar lipids [6]. Monolithic silica column has been previously used successfully in the separation of different phospholipid classes [21] and also in the study of nonpolar and polar lipids in marine zooplankton [14]. Based on this, we chose a Chromolith silica column manufactured using state-of-the-art monolithic silica technology, which provides a unique combination of macropores (average size 2 μm) and mesopores (average size 13 nm). While the mesopores form a fine porous structure and create a large uniform surface area on which adsorption takes place for high performance chromatographic separation, the macropores allow rapid flow of the mobile phase at low pressure. This is very important when solvents of different polarities need to be used for fast elution of analytes and equilibration of the column.
3.1.2 Gradient
The mobile phase composition plays a critical role in the separation of a wide range of lipid classes with different polarities. To achieve a good separation for all the selected lipid classes, the gradient program started with a nonpolar solvent mixture and ended with a polar solvent. Heptane-based mobile phase was used in the beginning of the gradient to separate nonpolar lipids like CE and TG from the other classes of lipids, and the proportion of acetone was increased to elute the ones with higher polarities. This was followed by chloroform/methanol/water-based mobile phase to separate the polar lipids, such as various classes of phospholipids. Due to the presence of water in the latter half of the gradient, the separation mechanism is closer to HILIC. This is different than the separation mechanism used in the first half of the gradient, where pure organic solvents were used. Therefore, the separation mechanism of the method developed in this work can be classified as mixed-mode.
The use of ammonia improved peak symmetry and the elution of the phospholipids with lower polarity like PG and CL, while increasing the percentage of TEA decreased the retention of the most polar classes on the stationary phase and improved the resolution [22]. Similar mobile phases containing TEA were used previously in the analysis of phospholipids [21, 23].
Because of the high polarity of the mobile phase D at the end of the run and the immiscibility of it with heptane (solvent A), the column needs to be flushed with the solvent C at the end of the chromatographic separation (5 ml min−1), and then washed with solvents A (94%) and B (6%) at a flow rate of 5 ml min−1 to reduce the column equilibration time and shorten the run to run cycle time. The high flow rate, used at the end of the gradient, made it possible to wash and equilibrate the column in just 7 minutes and the maximum pressures reached were about 120 bar. No carryover was observed between injections using the selected gradient when blanks were injected between samples, even when these samples were highly concentrated (10 μg μL−1) (Figure A.2). Neither changes in the chromatographic behavior nor alterations in retention times of the different lipid classes were observed using the selected gradient (Table 1).
3.1.3. Injection solvent
In the choice of solvent to dissolve and dilute the lipids before their final loading onto the monolithic silica column, several solvents and mixtures were tested, such as heptane/acetone, chloroform/methanol and chloroform only. Chloroform was chosen because it was the best in dissolving all the lipid classes, and as a result no solubility problem was observed. Due to the flow rate of the mobile phase used (1 mL min−1) and the small injection volume (10 μL), the use of chloroform as injection solvent did not present any problem in the analysis even when heptane-based mobile phase was used at the beginning of the gradient. It is also important to note that the column temperature was set to 25 °C to avoid the degradation of lipids during the fractionation.
3.1.4 Performance in separation of standard lipid mixtures
Under the optimized conditions, a good separation was achieved for 22 different lipid classes, as shown in Figure 1 of the HPLC-ELSD chromatogram. The retention times corresponding to the different lipid classes resolved by the mixed-mode LC-ELSD (n = 5) with their standard deviations (S.D.) and relative standard deviations (R.S.D.) are reported in Table 2. All the R.S.D.s are under 1.7 %, except that for TG (2.57%), which makes this method quite reliable for fraction collection. To demonstrate the good reproducibility in the retention time, representative chromatograms obtained during triplicate injections are shown in supplemental material (Figure A.3).
Figure 1.

Mixed mode LC-ELSD chromatogram of nonpolar and polar lipids obtained from a standard mixture solution, rat plasma and rat liver. 1: cholesterol ester; 2: triacylglycerol; 3: cholesterol; 4: 1,3- diacylglycerol; 5: 1,2- diacylglycerol; 6: 1-monoacylglycerol; 7: ceramide; 8: free fatty acids; 9: phosphatidylglycerol; 10: cardiolipin; 11: phosphatidylethanolamine; 12: phosphatidylethanolamine plasmalogen; 13: lysophosphatidylglycerol; 14: phosphatidylinositol; 15: phosphatidylserine; 16: lysophosphatidylethanolamine; 17: phosphatidylcholine; 18: phosphatidylcholine plasmalogen; 19: phosphatidic acid; 20: sphingomyelin; 21: sn2-lysophosphatidylcholine; 22: sn1-lysophosphatidylcholine.
Table 2.
Different lipid classes resolved by mixed-mode LC-ELSD using a monolithic silica column and their retention times (n = 5) with standard deviations (S.D.) and relative standard deviations (R.S.D.). The fraction where they were collected (A-M) is also specified.
| Lipid Class | Fraction | Retention time (min) | S.D. | R.S.D. (%) |
|---|---|---|---|---|
| CE | A | 1.69 | 0.01 | 0.80 |
| TG | A | 2.09 | 0.05 | 2.48 |
|
| ||||
| Cholesterol | B | 3.86 | 0.03 | 0.74 |
| 1,3-DG | B | 4.01 | 0.05 | 1.36 |
|
| ||||
| 1,2-DG | C | 4.81 | 0.08 | 1.66 |
|
| ||||
| 1-MG | D | 13.01 | 0.22 | 1.69 |
|
| ||||
| Cer | E | 14.37 | 0.23 | 1.57 |
|
| ||||
| FA C26:0 | F | 17.50 | 0.26 | 1.48 |
| FA C18:1 | F | 17.88 | 0.24 | 1.32 |
| FA C12:0 | F | 18.25 | 0.22 | 1.22 |
|
| ||||
| PG | G | 22.06 | 0.03 | 0.14 |
|
| ||||
| CL | H | 24.13 | 0.06 | 0.25 |
|
| ||||
| PE | I | 28.14 | 0.02 | 0.08 |
| pPE | I | 28.43 | 0.02 | 0.06 |
| LysoPG | I | 29.24 | 0.03 | 0.11 |
|
| ||||
| PI | J | 30.38 | 0.03 | 0.11 |
| PS | J | 31.69 | 0.06 | 0.20 |
|
| ||||
| LysoPE | K | 32.69 | 0.07 | 0.23 |
| PC | K | 33.37 | 0.04 | 0.11 |
| pPC | K | 33.70 | 0.03 | 0.09 |
| PA | K | 34.68 | 0.02 | 0.05 |
|
| ||||
| SM | L | 38.42 | 0.01 | 0.03 |
|
| ||||
| sn2-LysoPC | M | 41.35 | 0.01 | 0.01 |
| sn1-LysoPC | M | 41.77 | 0.02 | 0.04 |
CE: cholesterol ester; TG: triacylglycerol; 1,3-DG: 1,3- diacylglycerol; 1,2-DG: 1,2- diacylglycerol; 1-MG: 1-monoacylglycerol; Cer: ceramide; FA: free fatty acid; PG: phosphatidylglycerol; CL: cardiolipin; PE: phosphatidylethanolamine; pPE: phosphatidylethanolamine plasmalogen; LysoPG: lysophosphatidylglycerol; PI: phosphatidylinositol; PS: phosphatidylserine; LysoPE: lysophosphatidylethanolamine; PC: phosphatidylcholine; pPC: phosphatidylcholine plasmalogen; PA: phosphatidic acid; SM: sphingomyelin; sn2-LysoPC: sn2-lysophosphatidylcholine; sn1-LysoPC: sn1-lysophosphatidylcholine.
To our knowledge, this represents the highest number of lipid classes resolved by HPLC, which is more than the 19 classes reported as the best in the literature [15]. Our optimized method enabled separation of FA with different chain lengths, the partial separation of phospholipid plasmalogens from their phospholipid analogs and a total separation of sn-1 and sn-2 regioisomers of LysoPC. sn-1 LysoPC had longer retention time in comparison to sn-2 LysoPC, which is similar to what observed using HILIC methods [15]. In addition, 1,2- and 1,3-DG isomers were well separated, which has not been achieved with a traditional silica column before [12, 24]. The separation of DG isomers is of great interest, it allows the unambiguous assignment of the positional isomers for this type of compounds when coupled with MS identification.
3.1.5 Calibration curves
The mixed-mode method proposed in the present study also showed a wide linear dynamic range. The calibration curves for several lipid classes, their corresponding range of linearity and the limits of detection and quantification (LOD and LOQ) are listed in Table 3. A good correlation (linear fit R2 > 0.99) was obtained for all classes at the concentration range evaluated in this work. Similar linear response has been observed by others for lipids and phenolic compounds [21, 25, 26]. Although ELSD is a universal detector, it is of note that the range of linearity depends on the lipid classes since the response of ELSD varies with the physical properties of lipids. The nonpolar lipids and the ones with medium polarity had similar response and similar range of linearity, while all phospholipid classes showed comparable behaviors. This phenomena was also observed previously by others [12, 14] when an ELSD was used for detection of lipids.
Table 3.
Linear calibration curves (area = slope x [μg mL−1] + intercept), limits of detection (LOD), limits of quantification (LOQ) and repeatability of measurements for different representative lipid classes.
| Lipid Class | Range of linearity (μg mL−1) | Slope | Intercept | R2 | LOD (μg mL−1) | LOQ (μg mL−1) | Repeatability (%)a
|
|
|---|---|---|---|---|---|---|---|---|
| Retention times | Peak areas | |||||||
| TG | 30–750 | 12.407 | −1622.3 | 0.9915 | 72.80 | 220.60 | 2.59 | 7.91 |
| Cholesterol | 30–300 | 19.872 | −776.77 | 0.9901 | 44.58 | 135.10 | 0.66 | 4.47 |
| 1,2-DG | 30–300 | 13.086 | −252.04 | 0.9915 | 37.39 | 124.65 | 1.01 | 5.81 |
| FA C18:1 | 30–300 | 18.522 | −652.89 | 0.9911 | 42.33 | 128.27 | 1.18 | 6.19 |
| CL | 150–1500 | 9.1791 | −732.37 | 0.9930 | 140.52 | 425.82 | 0.26 | 6.89 |
| PE | 60–1200 | 7.524 | −462.79 | 0.9988 | 27.35 | 82.88 | 0.06 | 2.38 |
| PI | 45–1800 | 8.1921 | −325.31 | 0.9957 | 77.69 | 235.43 | 0.04 | 5.11 |
| PC | 75–1500 | 9.7677 | −728.84 | 0.9971 | 53.00 | 160.60 | 0.14 | 4.15 |
| SM | 150–1500 | 9.4956 | −1044.1 | 0.9907 | 85.94 | 260.42 | 0.03 | 2.99 |
Standard deviations based on six consecutive measurements.
The LOD was calculated by using 3.3 times the standard deviation of the intercept (Sxy) divided by the slope, while LOQ was calculated by using ten times the standard deviation of the intercept (Sxy) divided by the slope [27]. The LODs and LOQs reported in this work were sufficiently low to permit reliable detection and quantification of lipid classes in biological samples. The different equations of the calibration curves and their correlations are shown in Table 3, each point on the curve was obtained from triplicate injections. The reproducibility of the detector response and retention time was also evaluated (Table 3), the R.S.D.s for the retention times and peak areas for all lipids were less than 3% and 10%, respectively. The R.S.D.s for the retention times were smaller than those reported by McLaren et al. [24] when a HILIC column was used, and comparable to the ones obtained by Graeve et al. [14] using a monolithic column.
3.2 Application of mixed-mode LC method to fractionate lipids from biological samples
The Folch method was used to extract lipids from rat plasma and rat liver. The resulted total lipid extract was fractionated using the optimized monolithic mixed-mode LC method into individual lipid classes. Thirteen fractions were collected according to the retention time set in Table 2. Representative mixed-mode LC-ELSD chromatograms of total lipids from rat plasma and rat liver are shown in Figure 1. All fractions (A-M, Table 2) were collected independent of whether the expected lipid classes exist in the chromatograms. Thirteen classes of lipids can be observed in rat plasma samples and sixteen in rat liver. Cholesterol esters and triacylglycerols were collected in the same fraction, however, they can be easily separated and identified using RPLC-MS in the second dimension of separation. The same strategy was applied to the fractions I, J and K because there are no isobaric species present in the same fraction. In the case of the fraction M where regioisomers of LysoPC were collected, this also did not pose a problem since the RPLC-MS/MS method permits the identification of positional isomers for this lipid class, as was reported previously [3].
3.3 Identification of lipid species using off-line mixed-mode LC-RPLC-MS/MS
The different fractions collected from rat plasma and rat liver lipid extracts were subject to subsequent RPLC-MS/MS analysis using a core-shell C30 particle column. The RPLC method used has demonstrated good performance in lipidomic analysis of total lipids [3]. The fractions collected using the mixed-mode LC method were completely dried before reconstitution and injection onto the RPLC column. Residual amount of TEA remained after drying process did not pose interference to our mass spectrometric analysis, because the intensity of the signature ion ([M + H]+, m/z 102.13) was low compared to analytes of interest during our evaluation. Nevertheless, MS scan range was set to m/z 114 – 1700 in analysis of lipid fractions to better accommodate the mass range of lipid species.
We performed FAME analysis to identify the composite fatty acyls exist in these lipid samples. The results were used to filter the lipid species identified by LipidSearch, which helped to eliminate the false positives and enabled a more confident identification. A total of 32 and 33 fatty acids were identified in rat liver and plasma, respectively, and only the lipid species that contain these fatty acyls were considered in this study. The number of lipids identified in each fraction is shown in Figure 2. In total, about 800 species were identified in rat plasma and rat liver using untargeted analysis of fractions by RPLC-MS/MS, respectively. All the structures were confidentially confirmed, except for the SM species. The problem with SM structural assignment is that SM contains a fatty amide bond instead of a fatty acyl ester, which makes cleavage of this bond more difficult under collisional induced dissociation implemented in most MS2 experiments. Although further structural characterization is possible using multistage activation [28] or fragmentation of Lithiated adducts [29], it is not feasible with a QEHF mass spectrometer for its lack of MSn capability. Under our experimental conditions in negative ESI mode, HCD-MS/MS of the [M + HCOO] − adduct ions of the SM species produced [M - CH3] − ions by elimination of HCO2 and CH3; in positive ion mode, the protonated precursors generally yielded the [(P - Cho) + H]+ ion after HCD. Therefore, the information about the fatty acyl chains in SM species cannot be readily achieved using the QEHF.
Figure 2.

Lipid molecular species identified in rat liver and rat plasma by one-dimensional RPLC-MS/MS (1D-RPLC) of total lipid extract [3] and by off-line two-dimensional mixed mode LC-RPLC-MS/MS (2D-mixed mode LC-RPLC).
The most abundant species were TG, PC and PE in both samples. Species of LysoPC and LysoPE were more abundant in rat plasma than in liver. In both samples, a higher number of 1,2-DG species were identified in comparison with 1,3-DG. No MG species were found in either sample and no CL species were found in rat plasma, which is in accordance with our previous work [3]. So species were co-eluted with Cer in mixed-mode LC, this is likely caused by the similarities of their molecule head group. LysoPS and LysoPI species were found in the fraction K, where PC, LysoPE and PA eluted. Figure 2 also includes the number of species identified in total lipid extracts from rat plasma and rat liver by one-dimensional RPLC-MS/MS [3]. The same samples were used in the previous and the present work to achieve a fair comparison between these two methods. The retention times of these lipid species on the RPLC column were the same in both methods, making it effective to compare between them. The off-line two-dimensional method showed an improvement over the one-dimensional in all lipid classes, identifying about 100% more lipids. With the proposed method, a total of 885 and 850 species were identified in rat plasma and rat liver, respectively, while using the one-dimensional RPLC-MS/MS method, 440 and 426 lipids were identified, including the SM species. The lipid species found only by off-line two-dimensional mixed-mode LC-RPLC-MS/MS method are shown in Supplemental material (Tables A.2 and A.3). Much broader coverage of lipids is due to cleaner spectrum (less interfering ions) at both the MS and MS/MS levels. As demonstrated in Figure 3 for the full MS spectrum at retention time 10.79 min, a high number of ions were observed in a single scan when total lipids were analyzed by one-dimensional LC-MS/MS (Figure 3A). Since top 20 most abundant ions were chosen for the following MS/MS analysis, less abundant ions, like m/z 808.58 of PC(16:0/22:5), were not selected for further fragmentation and therefore this compound cannot be identified. However, these species can be confidently identified when two-dimensional mixed-mode LC-RPLC-MS/MS was used (Figure 3B). In addition, cleaner MS/MS spectrum greatly enhanced the accuracy in structural elucidation of isobaric species that coeluted in RPLC. As shown in Figure 4A, due to the coelution of PE(18:1,20:4) and PC(18:1/17:4) species, the composite MS/MS spectrum obtained from the co-fragmentation of the identical precursor ions limited the identification of either of these two species. However, it didn’t pose any challenge when PE and PC fractions were separately analyzed applying two-dimensional mixed-mode LC-RPLC-MS/MS (Figures 4B and 4C). Therefore, the method presented in this work enabled a more comprehensive characterization of complex lipidome, in both biological fluid and tissue, than using a one-dimensional RPLC-MS/MS.
Figure 3.

Full MS spectrum acquired in positive ion mode at retention time 10.79 min for total lipids from rat liver (A) and mixed mode LC-purified phosphatidylcholine lipid fraction from rat liver (B).
Figure 4.

Product-ion spectrum of m/z 766.5 in positive mode from isobaric species PE(18:1,20:4) and PC(18:1/17:4) obtained using one-dimensional RPLC-MS/MS where both species co-elute (A) and off-line two-dimensional mixed mode LC-RPLC-MS/MS in PE (B) and PC (C) fractions of rat plasma lipid extract.
Other advantage of using the proposed method is that 1,2- and 1,3-DG isomers, owning to their different retention time in mixed-mode LC, can be easily assigned structurally without the chance of misidentification. Same is true for the analysis of lysophospholipid species using this 2D method. Clinically, it is important to accurately identify and quantify lysophospholipids, since it has been demonstrated recently that they are related to cancer and other pathological conditions [6, 30, 31], In addition, some species, like cholesterol esters, were only identified when the samples were analyzed by off-line two-dimensional method. Moreover, a much higher number of TG has been identified using fractionation, which can be attributed to the reduced ion suppression effect in the fractionated samples; in contract, DG and CL species co-eluted with TG in the RPLC chromatogram of unfractionated sample.
Most of the work reported in the literature only focus on the study of just one or a few of lipid classes. For example, two-dimensional LC-MS/MS was used to enhance the profiling of ceramide and phosphatidylcholine species in mouse liver [32]. For lipidomic profiling of biological samples, 143 lipid species from 10 lipid classes were identified in human plasma and porcine brain samples using a continuous two dimensional LC-MS/MS method, with RPLC as the first dimension and HILIC as the second dimension [17]. Using an online NPLC/RPLC-MS/MS method, Nie et al. identified 721 endogenous lipid species from 12 lipid classes in rat peritoneal surface, but only 415 of them were structurally confirmed using MS/MS [13]. Most recently, using a high throughput UHPSFC-MS/MS method, Lisa et al. identified 436 lipid species in porcine brain, albeit without structural confirmation [7]. Compared with these previously published works, our method represents a more comprehensive approach for untargeted profiling of lipids with more accurate structural characterization.
4. CONCLUSIONS
In summary, an off-line two-dimensional mixed-mode LC-RPLC-MS/MS method has been developed to profile lipids in complex biological samples. In the first dimension, lipids were separated into 22 classes according to their polarities on monolithic silica based-mixed-mode LC, and their further separation in the second dimension on a C30 core-shell particle based- RPLC was determined by the acyl chain lengths and the number of double bonds of each lipid molecular species. The method was applied to rat plasma and rat liver samples, detecting more than 800 lipids in each sample. FAME analysis was used to determine the total fatty acids in the samples and facilitated confident identification of lipids using LipidSearch. In both samples, about 2 times more lipid molecular species were confidentially determined compared to the previous one-dimensional RPLC-MS/MS using a C30 column alone. The 1,2- and 1,3-DG isomers and other lysophospholipids were separated well in the first dimension, helping their positional isomer assignment before the RPLC-MS/MS analysis. Ion suppression effect was highly reduced and clearer spectra were obtained allowing a more confident identification. This off-line two-dimensional method holds great potential in building comprehensive libraries of lipids that exist in complex biological samples.
Supplementary Material
Figure A.1: Gas-chromatogram of the fatty acid profile rat liver and plasma; annotation of peaks is listed in Table A.1.
Figure A.2: Blanks (chloroform) injected between samples in mixed mode LC-ELSD separation.
Figure A.3: Five different injections (A–E) of a standard lipid mixture at different concentrations using the optimized mixed mode LC-ELSD method.
Table A.1: Fatty acid species identified as fatty acyl methyl esters (FAMEs) by the GC method in rat liver and plasma (See Figure A.1). “a” and “b” indicate different isomers. X: identified in the sample; n/a: not detected.
Table A.2: Lipids identified in rat liver by off-line two-dimensional high-performance liquid chromatography-high resolution mass spectrometry.
Table A.3: Lipids identified in rat plasma by off-line two-dimensional high-performance liquid chromatography-high resolution mass spectrometry.
Mixed mode LC fractionation coupled with reversed phase LC-MS/MS for lipidomics.
22 lipid classes were separated in mixed mode on a monolithic Si-based column.
Reduced ion suppression and cleaner spectra obtained from fractionated samples.
Total fatty acid analysis to improve confidence of identified lipid in LipidSearch.
More than 800 lipids were confidentially identified in rat plasma and rat liver.
Acknowledgments
This work was supported by the National Institutes of Health (GM104678).
Footnotes
Publisher's Disclaimer: This is a PDF file of an unedited manuscript that has been accepted for publication. As a service to our customers we are providing this early version of the manuscript. The manuscript will undergo copyediting, typesetting, and review of the resulting proof before it is published in its final citable form. Please note that during the production process errors may be discovered which could affect the content, and all legal disclaimers that apply to the journal pertain.
References
- 1.Bird SS, Marur VR, Stavrovskaya IG, Kristal BS. Separation of cis-trans phospholipid isomers using reversed phase LC with high resolution MS detection. Analytical chemistry. 2012;84:5509–5517. doi: 10.1021/ac300953j. [DOI] [PMC free article] [PubMed] [Google Scholar]
- 2.Chester TL. Recent developments in high-performance liquid chromatography stationary phases. Analytical chemistry. 2013;85:579–589. doi: 10.1021/ac303180y. [DOI] [PubMed] [Google Scholar]
- 3.Narvaez-Rivas M, Zhang Q. Comprehensive untargeted lipidomic analysis using core-shell C30 particle column and high field orbitrap mass spectrometer. Journal of chromatography. A. 2016;1440:123–134. doi: 10.1016/j.chroma.2016.02.054. [DOI] [PMC free article] [PubMed] [Google Scholar]
- 4.Cifkova E, Holcapek M, Lisa M, Vrana D, Melichar B, Student V. Lipidomic differentiation between human kidney tumors and surrounding normal tissues using HILIC-HPLC/ESI-MS and multivariate data analysis. Journal of chromatography. B, Analytical technologies in the biomedical and life sciences. 2015;1000:14–21. doi: 10.1016/j.jchromb.2015.07.011. [DOI] [PubMed] [Google Scholar]
- 5.Dugo P, Fawzy N, Cichello F, Cacciola F, Donato P, Mondello L. Stop-flow comprehensive two-dimensional liquid chromatography combined with mass spectrometric detection for phospholipid analysis. Journal of chromatography. A. 2013;1278:46–53. doi: 10.1016/j.chroma.2012.12.042. [DOI] [PubMed] [Google Scholar]
- 6.Granafei S, Losito I, Palmisano F, Cataldi TR. Identification of isobaric lyso-phosphatidylcholines in lipid extracts of gilthead sea bream (Sparus aurata) fillets by hydrophilic interaction liquid chromatography coupled to high-resolution Fourier-transform mass spectrometry. Analytical and bioanalytical chemistry. 2015;407:6391–6404. doi: 10.1007/s00216-015-8671-9. [DOI] [PubMed] [Google Scholar]
- 7.Lisa M, Holcapek M. High-Throughput and Comprehensive Lipidomic Analysis Using Ultrahigh-Performance Supercritical Fluid Chromatography-Mass Spectrometry. Analytical chemistry. 2015;87:7187–7195. doi: 10.1021/acs.analchem.5b01054. [DOI] [PubMed] [Google Scholar]
- 8.Houjou T, Yamatani K, Imagawa M, Shimizu T, Taguchi R. A shotgun tandem mass spectrometric analysis of phospholipids with normal-phase and/or reverse-phase liquid chromatography/electrospray ionization mass spectrometry. Rapid communications in mass spectrometry : RCM. 2005;19:654–666. doi: 10.1002/rcm.1836. [DOI] [PubMed] [Google Scholar]
- 9.Han X. Multi-dimensional mass spectrometry-based shotgun lipidomics and the altered lipids at the mild cognitive impairment stage of Alzheimer's disease. Biochim Biophys Acta. 2010;1801:774–783. doi: 10.1016/j.bbalip.2010.01.010. [DOI] [PMC free article] [PubMed] [Google Scholar]
- 10.Cajka T, Fiehn O. Comprehensive analysis of lipids in biological systems by liquid chromatography-mass spectrometry. Trends in analytical chemistry : TRAC. 2014;61:192–206. doi: 10.1016/j.trac.2014.04.017. [DOI] [PMC free article] [PubMed] [Google Scholar]
- 11.Narváez-Rivas M, Pérez-Ramírez IF, Gallardo E, González-Peña JL, Juárez-Becerra J, León-Camacho M. Characterization of Lipids in Femoral Atheroma from Diabetic Patients and Their Use as Clinical Descriptors. Journal of Bioanalysis and Biomedicine. 2015;7:12. [Google Scholar]
- 12.Christie WW. Rapid separation and quantification of lipid classes by high performance liquid chromatography and mass (light-scattering) detection. J Lipid Res. 1985;26:507–512. [PubMed] [Google Scholar]
- 13.Nie H, Liu R, Yang Y, Bai Y, Guan Y, Qian D, Wang T, Liu H. Lipid profiling of rat peritoneal surface layers by online normal- and reversed-phase 2D LC QToF-MS. J Lipid Res. 2010;51:2833–2844. doi: 10.1194/jlr.D007567. [DOI] [PMC free article] [PubMed] [Google Scholar]
- 14.Graeve M, Janssen D. Improved separation and quantification of neutral and polar lipid classes by HPLC-ELSD using a monolithic silica phase: application to exceptional marine lipids. Journal of chromatography. B, Analytical technologies in the biomedical and life sciences. 2009;877:1815–1819. doi: 10.1016/j.jchromb.2009.05.004. [DOI] [PubMed] [Google Scholar]
- 15.Lisa M, Cifkova E, Holcapek M. Lipidomic profiling of biological tissues using off-line two-dimensional high-performance liquid chromatography-mass spectrometry. Journal of chromatography. A. 2011;1218:5146–5156. doi: 10.1016/j.chroma.2011.05.081. [DOI] [PubMed] [Google Scholar]
- 16.Li M, Feng B, Liang Y, Zhang W, Bai Y, Tang W, Wang T, Liu H. Lipid profiling of human plasma from peritoneal dialysis patients using an improved 2D (NP/RP) LC-QToF MS method. Analytical and bioanalytical chemistry. 2013;405:6629–6638. doi: 10.1007/s00216-013-7109-5. [DOI] [PubMed] [Google Scholar]
- 17.Holcapek M, Ovcacikova M, Lisa M, Cifkova E, Hajek T. Continuous comprehensive two-dimensional liquid chromatography-electrospray ionization mass spectrometry of complex lipidomic samples. Analytical and bioanalytical chemistry. 2015;407:5033–5043. doi: 10.1007/s00216-015-8528-2. [DOI] [PubMed] [Google Scholar]
- 18.Li M, Tong X, Lv P, Feng B, Yang L, Wu Z, Cui X, Bai Y, Huang Y, Liu H. A not-stop-flow online normal-/reversed-phase two-dimensional liquid chromatography-quadrupole time-of-flight mass spectrometry method for comprehensive lipid profiling of human plasma from atherosclerosis patients. Journal of chromatography. A. 2014;1372C:110–119. doi: 10.1016/j.chroma.2014.10.094. [DOI] [PubMed] [Google Scholar]
- 19.Wang S, Li J, Shi X, Qiao L, Lu X, Xu G. A novel stop-flow two-dimensional liquid chromatography-mass spectrometry method for lipid analysis. Journal of chromatography. A. 2013;1321:65–72. doi: 10.1016/j.chroma.2013.10.069. [DOI] [PubMed] [Google Scholar]
- 20.Folch J, Lees M, Sloane Stanley GH. A simple method for the isolation and purification of total lipides from animal tissues. J Biol Chem. 1957;226:497–509. [PubMed] [Google Scholar]
- 21.Narvaez-Rivas M, Gallardo E, Rios JJ, Leon-Camacho M. A new high-performance liquid chromatographic method with evaporative light scattering detector for the analysis of phospholipids. Application to Iberian pig subcutaneous fat. Journal of chromatography. A. 2011;1218:3453–3458. doi: 10.1016/j.chroma.2011.03.067. [DOI] [PubMed] [Google Scholar]
- 22.Leon-Camacho M, Narvaez-Rivas M. Lecithin. In: Nollet LML, Toldra F, editors. Handbook of Analysis of Active Compounds in Functional Foods. CRC Press; Boca Raton, FL, USA: 2012. pp. 769–786. [Google Scholar]
- 23.Imbert L, Ramos RG, Libong D, Abreu S, Loiseau PM, Chaminade P. Identification of phospholipid species affected by miltefosine action in Leishmania donovani cultures using LC-ELSD, LC-ESI/MS, and multivariate data analysis. Analytical and bioanalytical chemistry. 2012;402:1169–1182. doi: 10.1007/s00216-011-5520-3. [DOI] [PubMed] [Google Scholar]
- 24.McLaren DG, Miller PL, Lassman ME, Castro-Perez JM, Hubbard BK, Roddy TP. An ultraperformance liquid chromatography method for the normal-phase separation of lipids. Anal Biochem. 2011;414:266–272. doi: 10.1016/j.ab.2011.03.009. [DOI] [PubMed] [Google Scholar]
- 25.Heron S, Dreux M, Tchapla A. Post-column addition as a method of controlling triacylglycerol response coefficient of an evaporative light scattering detector in liquid chromatography-evaporative light-scattering detection. Journal of chromatography. A. 2004;1035:221–225. doi: 10.1016/j.chroma.2004.02.052. [DOI] [PubMed] [Google Scholar]
- 26.You Q, Chen F, Sharp JL, Wang X, You Y, Zhang C. High-performance liquid chromatography-mass spectrometry and evaporative light-scattering detector to compare phenolic profiles of muscadine grapes. Journal of chromatography. A. 2012;1240:96–103. doi: 10.1016/j.chroma.2012.03.086. [DOI] [PubMed] [Google Scholar]
- 27.Thompson M, Ellison SLR, Wood R. Harmonized guidelines for single-laboratory validation of methods of analysis (IUPAC Technical Report) Pure and Applied Chemistry. 2002;74:20. [Google Scholar]
- 28.Houjou T, Yamatani K, Nakanishi H, Imagawa M, Shimizu T, Taguchi R. Rapid and selective identification of molecular species in phosphatidylcholine and sphingomyelin by conditional neutral loss scanning and MS3. Rapid communications in mass spectrometry : RCM. 2004;18:3123–3130. doi: 10.1002/rcm.1737. [DOI] [PubMed] [Google Scholar]
- 29.Yang K, Zhao Z, Gross RW, Han X. Systematic analysis of choline-containing phospholipids using multi-dimensional mass spectrometry-based shotgun lipidomics. Journal of chromatography. B, Analytical technologies in the biomedical and life sciences. 2009;877:2924–2936. doi: 10.1016/j.jchromb.2009.01.016. [DOI] [PMC free article] [PubMed] [Google Scholar]
- 30.Lee JY, Min HK, Moon MH. Simultaneous profiling of lysophospholipids and phospholipids from human plasma by nanoflow liquid chromatography-tandem mass spectrometry. Analytical and bioanalytical chemistry. 2011;400:2953–2961. doi: 10.1007/s00216-011-4958-7. [DOI] [PubMed] [Google Scholar]
- 31.Triebl A, Trotzmuller M, Eberl A, Hanel P, Hartler J, Kofeler HC. Quantitation of phosphatidic acid and lysophosphatidic acid molecular species using hydrophilic interaction liquid chromatography coupled to electrospray ionization high resolution mass spectrometry. Journal of chromatography. A. 2014;1347:104–110. doi: 10.1016/j.chroma.2014.04.070. [DOI] [PMC free article] [PubMed] [Google Scholar]
- 32.Ling YS, Liang HJ, Lin MH, Tang CH, Wu KY, Kuo ML, Lin CY. Two-dimensional LC-MS/MS to enhance ceramide and phosphatidylcholine species profiling in mouse liver. Biomedical chromatography : BMC. 2014;28:1284–1293. doi: 10.1002/bmc.3162. [DOI] [PubMed] [Google Scholar]
Associated Data
This section collects any data citations, data availability statements, or supplementary materials included in this article.
Supplementary Materials
Figure A.1: Gas-chromatogram of the fatty acid profile rat liver and plasma; annotation of peaks is listed in Table A.1.
Figure A.2: Blanks (chloroform) injected between samples in mixed mode LC-ELSD separation.
Figure A.3: Five different injections (A–E) of a standard lipid mixture at different concentrations using the optimized mixed mode LC-ELSD method.
Table A.1: Fatty acid species identified as fatty acyl methyl esters (FAMEs) by the GC method in rat liver and plasma (See Figure A.1). “a” and “b” indicate different isomers. X: identified in the sample; n/a: not detected.
Table A.2: Lipids identified in rat liver by off-line two-dimensional high-performance liquid chromatography-high resolution mass spectrometry.
Table A.3: Lipids identified in rat plasma by off-line two-dimensional high-performance liquid chromatography-high resolution mass spectrometry.