

Summary
During human brain development, multiple signaling pathways generate diverse cell types with varied regional identities. Here, we integrate single-cell RNA sequencing and clonal analyses to reveal lineage trees and molecular signals underlying early forebrain and mid/hindbrain cell differentiation from human embryonic stem cells (hESCs). Clustering single cell transcriptomic data identified 41 distinct populations of progenitors, neuronal, and non-neural cells across our differentiation time course. Comparisons with primary mouse and human gene expression data demonstrated rostral and caudal progenitor and neuronal identities from early brain development. Bayesian analyses inferred a unified cell type lineage tree that bifurcates between cortical and mid/hindbrain cell types. Two methods of clonal analyses confirmed these findings and further revealed the importance of Wnt/beta-catenin signaling in controlling this lineage decision. Together, these findings provide a rich transcriptome-based lineage map for studying human brain development and modeling developmental disorders.
Graphical abstract

Introduction
The human brain is a complex and highly evolved structure. Mouse models do not fully recapitulate cell-type diversity or lineage trajectories of the human brain (Florio et al., 2015; Konopka et al., 2012; Pollen et al., 2015; Reilly et al., 2015; Silbereis et al., 2016; Thomsen et al., 2016). Furthermore, human neurodevelopmental diseases such as autism spectrum disorders and schizophrenia are incompletely modeled in mouse. Stem cell-based models of human brain development have been pursued to understand and combat these disorders (Hook et al., 2014; Ricciardi et al., 2012).
The molecular networks that drive fate decisions and development of neurons and glia are not fully understood, and some may be unique in humans (Lui et al., 2014). Single-cell transcriptomics can reveal these networks with high-dimensional molecular characterization at an increasing scale (Klein et al., 2015; Macosko et al., 2015), and has already defined transcriptomic cell types from the blood (Paul et al., 2015), lung (Treutlein et al., 2014), and mouse brain (Tasic et al., 2016; Zeisel et al., 2015). In parallel, the recent progress in modeling human brain development from pluripotent stem cells (Chambers et al., 2009; Espuny-Camacho et al., 2013; Lancaster et al., 2013; Qian et al., 2016; Shi et al., 2012) promises to supply human neural tissue at developmental stages that are typically unavailable. Although several studies have characterized differentiated cells by gene expression (Edri et al., 2015; van de Leemput et al., 2014), only one in vitro differentiation study has carried out single-cell transcriptomics (Camp et al., 2015). As these cultures presumably contain a mixture of cell types, single-cell resolution studies are essential to characterize the cell types produced in culture and to determine how they compare to primary developing tissue.
Here, we present a study of early human brain cell type development using single-cell transcriptomics and a two-dimensional in vitro brain development model. We demonstrate the biological relevance of our cell types by comparison to primary tissues from atlas data and cortical cells from mid-gestation human fetal embryos. We computationally identify cell types, predict their lineage relationships using a Bayesian lineage algorithm, and experimentally confirm the predictions using two independent clonal analysis techniques. Our lineage tree captures some of the earliest regional patterning events of the brain, including the canonical Wnt/beta-catenin signaling-dependent separation of cortical from mid/hindbrain cell types and the appearance of forebrain neurons that resemble some of the earliest formed neurons of the brain. These data constitute a deep and broad interrogation of human embryonic stem cell (hESC) neural differentiation and highlight key steps in regional patterning and lineage specification.
Results
In vitro model of human brain excitatory cell development
We developed and standardized an in vitro model of human cortical development based on the neuralization of hESCs, adapted from previous protocols (Chambers et al., 2009; Espuny-Camacho et al., 2013; Shi et al., 2012). The cortical induction (CI) phase utilizes SMAD inhibition (Chambers 2009), the progenitor expansion (PE) phase includes EGF and FGF2, and the neural differentiation (ND) phase includes neurogenic/neurotrophic factors BDNF, GDNF, NT3, and cAMP (Hu et al., 2010) (Figure 1A). At the end of CI (D12), pluripotency markers were completely lost, most cells expressed both PAX6 and FOXG1, and 92 ± 3% co-express PAX6 and SOX2, suggesting efficient telencephalic induction (Figure 1B, S1A-C). By the end of PE (D26), 11 ± 2% of cells expressed the cortical intermediate progenitor marker EOMES (TBR2) (Figure 1B,S1D). Following ND (D54), many cells expressed the neuronal marker MAP2 and subtype-specific markers TBR1, BCL11B (CTIP2), POU3F2 (BRN2), SATB2, and LHX2. In addition, we observed putative glial and outer radial glial cells marked by HOPX and GFAP (Figure 1B,S1E) (Pollen et al., 2015; Thomsen et al., 2016). Neuronal activity of D54 cells was confirmed using calcium imaging and pharmacological blocking experiments with tetrodotoxin (TTX), an action potential generation inhibitor. Out of 1148 recorded cells (3 biological replicates), 17 ± 6% demonstrated calcium activity with a frequency of 2.2 ± 0.5 events/min. Calcium activity was blocked in 42.3% of those cells by TTX (Figure 1C). These observations are comparable to data obtained by similar methods in recent reports (Edri et al., 2015; Espuny-Camacho et al., 2013; Gaspard et al., 2008; Lancaster et al., 2013; Mariani et al., 2012; Shi et al., 2012).
Figure 1. In vitro neural differentiation generates cortical and non-cortical cells.
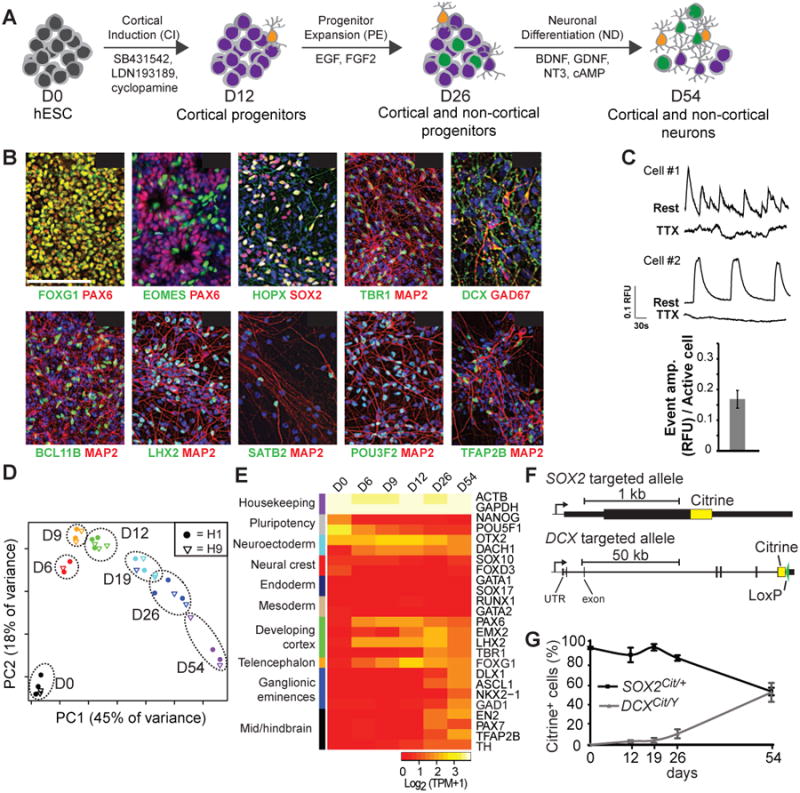
(A) Schematic representation of in vitro neural differentiation of hESCs. (B) Representative images of immunostaining on D12, D26 and D54 of H1 differentiated cells, with DAPI in blue. Scale bar: 100 μm. (C) Representative traces of calcium activity as imaged with FURA2-AM (top traces) and after blockade by TTX (bottom traces). Data quantified from three representative experiments (n = 1148 cells at D54, from 3 biological replicates) (bottom); RFU = relative fluorescent units. (D) Principal component analysis of population RNA-Seq data demonstrates the reproducibility of differentiation methods across multiple experiments from both H1 and H9 stem cell lines. (E) Population RNA-Seq expression of genes that mark indicated brain regions. (F) Schematic of targeted loci of the SOX2Cit/+ and DCXCit/Y reporter cell lines. (G) Quantitation of percent citrine positive cells during differentiation by flow cytometry. Mean ± SD is shown from 3 (SOX2Cit/+) and 6 (DCXCit/Y) biological replicates. See also Figures S1-2.
We profiled the different stages of our in vitro differentiation protocol and established its reproducibility (Figure 1D,S1B-F) across replicate differentiations and cell lines (H1 and H9) by analyzing populations of cells from each time point (∼1×10⁵-1×10⁶ cells/sample) using RNA-Seq analysis, flow cytometry, and immunostaining. Developing cortex markers EMX2, PAX6, and LHX2 appeared between days 6-12 (Figure 1E,S1A,G). Additionally, markers of ganglionic eminences (DLX1, ASCL1, and GAD1) as well as mid/hindbrain (EN2, PAX7, and TFAP2B) were observed. Analysis by flow cytometry showed 7 ± 3% of SOX2+ cells lack PAX6 at D26 (Figure S1A), suggesting non-cortical identity. Immunostaining corroborated the presence of SOX2+PAX6- cells at D26 as well as the expression of TFAP2B, TH, GAD67 and PBX3 in cultured neurons at D54 (Figure 1B,S1H). These results indicate a high degree of cellular heterogeneity, and led us to transcriptionally profile single in vitro-derived cells through differentiation.
We engineered reporter lines using TALENs (Miller et al., 2011) to fuse citrine fluorescent protein to endogenous SOX2 (marker of progenitors) or DCX (marker of immature neurons), in order to isolate both live progenitors and neurons (Figure 1F,S2A-B). SOX2Cit/+ cells exhibited near-uniform reporter expression in 93 ± 1% of hESCs (n = 3), which decreased to 51 ± 3% (n = 3) citrine+ cells by D54 of differentiation (Figure 1G,S2C). In DCXCit/Y cells, the citrine reporter was not detected in hESCs but increased to 50 ± 8% (n = 6) of cells at D54. Both reporters mimicked expression of the endogenous protein, and produced neurons with the same markers as the parental H1 line (Figure S2D-E). Additionally, reporter lines were generated and validated for early neurogenesis markers OTX2 and PAX6 (Figure S2F-K). These lines constitute an important set of tools for dissecting human neurogenesis.
Single-cell profiling and identification of cell types
A method based on multiplexed single-cell RNA-Seq (CelSeq, (Hashimshony et al., 2012)) was used to profile cells at multiple time points (D0, D12, D19, D26, D40, and D54) (Figure 2A). We isolated both progenitor-enriched (DCXCit- and SOX2Cit+) and neuron-enriched cells (DCXCit+ and SOX2Cit-) resulting in 4368 cells harvested from two to six independent differentiations per time point (Figure 2B,S3A). We recognized, as others have (Paul et al., 2015), some well to well mixing was present that could lead to spurious appearance of cell types or frequencies, and implemented a strategy that substantially reduced such technical artifacts (Figure S3B, Supplementary Methods). Following batch correction, we analyzed cells with >20,000 transcripts (n = 2,684) and normalized the data by subsampling to 20,000 transcripts (Figure S3C-D). Single-cell data was evaluated for mapping to genome and transcriptome, inclusion of UMIs represented by single reads, sensitivity, linearity of amplification, number of genes detected, and the 3′ read bias by library (Figure S4A-F). We included UMIs represented by only one read, although other have removed them to reduce spurious UMIs (Zeisel et al., 2015), since we saw no increased fidelity upon their removal (Figure S4B). PCA separated progenitors and neurons by PC1 and further separated differentiation phase by PC2 (Figure 2C). Genes with variance greater than technical noise (estimated by ERCC spike-in controls, Figure S4H, Table S1) were used to drive iterative cell clustering at each time point using gene modules derived from weighted gene co-expression network analysis (WGCNA (Tasic et al., 2016; Thomsen et al., 2016; Zhang and Horvath, 2005)) (Figure 2D, Data S1). Robustness of cell clusters was determined through bootstrapping, where a random 80% of cells from each time point were re-clustered 100 times (Figure 2D,S4I). In total 41 cell type clusters were observed: 14 neural progenitor, 5 transitional, 19 neuronal, and 3 non-neural cell types (Figure 2E,F). Cell types are named by: time point of origin; whether they are a progenitor (P), transitional (T), neural (N) or other tissue (O) cell type; and where necessary, the most specifically expressed gene for that cell type (e.g. D54_N_NEUROD6). Lastly, we generated a “constellation diagram” that shows cell types, relative frequency per time point, average co-clustering, and frequency of inter-cluster mixing during bootstrapping analysis (Figure 2F).
Figure 2. Identification of cell types through single-cell transcriptomics.
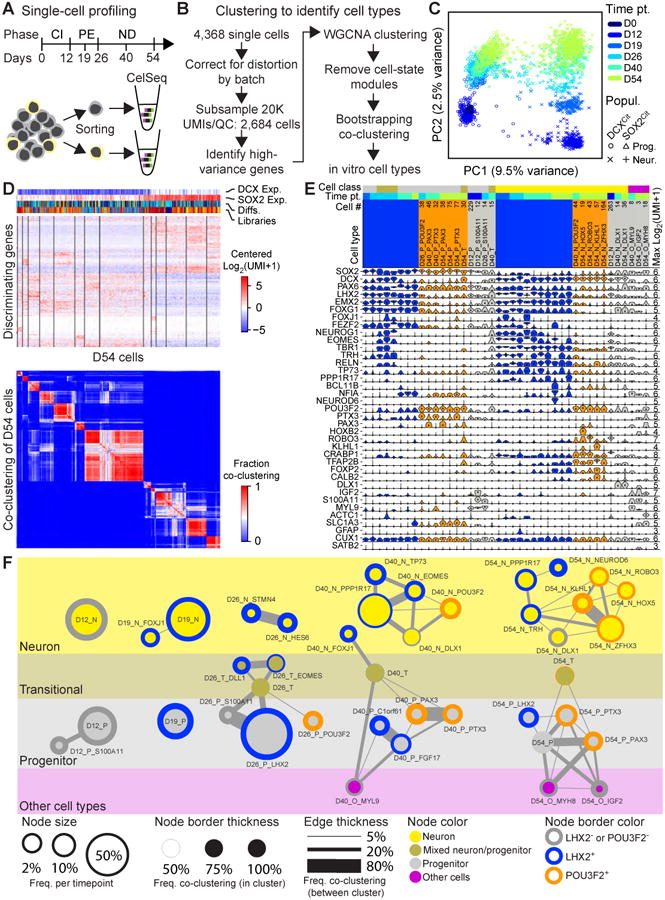
(A) Single cell-profiling strategy and (B) methodology of cell type identification from CelSeq single cell RNA-Seq data. (C) Principal component analysis of all single cells used for analysis based on high variance genes (Table S1). (D) Representative heatmap showing most distinguishing genes at D54 used to identify cell types (top, Data S1), and bootstrapping analysis of D54 cells. (E) Violin plots for most distinguishing and commonly used marker genes. Max Log2(UMI + 1) values are to the right, and the number of cell per cell type is listed above the cell type name. (F) Constellation diagram of cell types identified at D12, D19, D26, D40, and D54. Cell type name, relative number of cells per time point sampled are shown by circle size, strength of intra- and inter-cell type clustering from bootstrapping analysis are indicated by circle boarder with and edge width, and POU3F2 and LHX2 expression status are shown by circle boarder color. Neuronal cell types (yellow) were defined as cell types with strong DCX expression, Progenitors with strong SOX2 expression (gray), Transitional types express both SOX2 and DCX (gray-yellow transition), and Other cell types (pink) express genes indicative of non-neuronal lineages. See also Figures S3-4, Table S1, and Data S1-2.
Within progenitor and neuronal cell types found at and after D26, we observed co-expression of markers suggestive of telencephalic identity (LHX2, FOXG1, and FEZF2, (Hanashima et al., 2004; Hirata et al., 2004; Porter et al., 1997)). At D26, a progenitor cell type emerged that expressed markers suggestive of mid-hindbrain identity (PTX3 and POU3F2, Figure 2E-F,S5A). At D40 and D54, we observed additional progenitor and neuronal cell types expressing mid/hindbrain markers such as TFAP2B, PAX3, ROBO3, and HOXB2, but not LHX2 (Figure 2E-F, S5A). Thus our differentiation method furnishes a combination of forebrain and mid/hindbrain cell types.
To independently validate key features of the gene expression data, we generated a data set using SmartSeq2 (that has no multiplexing of samples; see below) and also conducted immunostaining. By both RNA-Seq and immunostaining, LHX2 and POU3F2 have little expression overlap within neural progenitors at D26, and this segregation persists within neurons at D54 (Figure 3A-B). In contrast EOMES and TBR1 are frequently co-expressed in D26 and D54 neurons in all datasets (Figure 3C-D).
Figure 3. Validation of single-cell RNA-Seq data and creation of preplate cortical neurons.

(A-D) Differentiating cultures were immunostained with the indicated cell type markers and types of progenitors (SOX2+ cells) and neurons (TUJ1+ cells) were quantified. n = 4-6 independent experiments per immunostaining condition, scale 50 μm. The quantification by immunostaining (left) is directly compared to single-cell gene expression data generated by CelSeq (middle) and SmartSeq2 (right). Cells were scored positive for CelSeq if their UMI was >4 and for SmartSeq2 if TPM>0. (E) Chromogenic in situ hybridization data show early co-expression of Tbr1, Reln, Eomes, and Lhx2 in E11.5-E13.5 mouse cortex, but no overlap of Tbr1 and Eomes after E15.5. Data are from Allen Developing Mouse Brain Atlas, scale is 100 μm. See also Figure S5, Table S5.
Cell types show forebrain and mid/hindbrain regional identities
To establish the nature of our cell types, we compared our cells to primary brain cell expression datasets. EOMES expression is frequently used as a marker of intermediate progenitor cells (Qian et al., 2016; Shi et al., 2012); however many neurons co-express EOMES and TBR1, suggestive of preplate cells (Bulfone et al., 1999). Consistently, expression of Eomes and Tbr1 is apparent in the same layer of early-borne mouse neurons at E11.5 and E13.5, but not at E15.5 (Figure 3E). Among genes selectively expressed in LHX2+ rather than POU3F2+ neurons at D40 and D54, 56% of those present in the Developing Mouse Brain Atlas (Thompson et al., 2014) at E13.5 and E15.5 showed expression in cortical preplate and the presumptive marginal zone (Table S5). These data suggest that some cultured neurons correspond to preplate or other early neuronal cell types.
We compared the single-cell transcriptomes of D54 cells to the BrainSpan Atlas of the Developing Human Brain (Miller et al., 2014) and the Developing Mouse Brain Atlas. We focused on the conserved co-expressed gene modules identified by WGCNA (Langfelder and Horvath, 2007) that distinguished both the hESC-derived cell types and brain regions (gene modules shown in Table S1). Statistical significance of the assessed conserved gene modules was based on permutation analysis (Langfelder et al., 2011). We estimated the similarity between differentiated D54 neurons and brain regions by comparing the Spearman correlation coefficient based on these conserved co-expressed gene modules (Table S1). Neuron clusters D54_N_NEUROD6 and D54_N_PPP1R17 (marked by LHX2 and TBR1) showed strong correlation to cortex but weak correlation to mid/hindbrain regions in both mouse at E13.5, and human at post conception week (PCW) 15-16 (Figure 4A-B). In contrast, POU3F2+ neuron clusters D54_N_HOX5, _ROBO3, _KLHL1, and _ZFHX3 showed weak correlation to cortex but strong correlation to mid/hindbrain, while D54_N_TRH correlated best to diencephalon (forebrain) and midbrain. Finally, neuron cluster D54_N_DLX1 showed high correlation to the ganglionic eminences (Figure 4A-B). Antibody staining of human mid-gestational (122-132 days post conception (dpc)) brain tissue showed that LHX2 is a marker of human cortical but not hindbrain progenitors (Figure 4C). Markers associated with the LHX2-expressing neuronal cell types D54_N_NEUROD6 and D54_N_PPP1R17, BCL11B+ and NFIA+NeuN+, were highly expressed in the cortical plate and intermediate zone of the cortex, respectively, but not in hindbrain cells (Figure 4D). In contrast, markers of the POU3F2-expressing neuron clusters, TFAP2B and ROBO3, were present in hindbrain but not cortex (Figure 4D). Thus, the POU3F2-expressing neurons likely correspond to posterior brain neuron types while LHX2-expressing clusters largely correspond to forebrain cell types. These data demonstrate progenitors and neurons belonging to multiple human brain regions are generated in vitro despite the directed cortical induction.
Figure 4. Stem cell-derived cell types resemble forebrain and mid/hindbrain cell types.
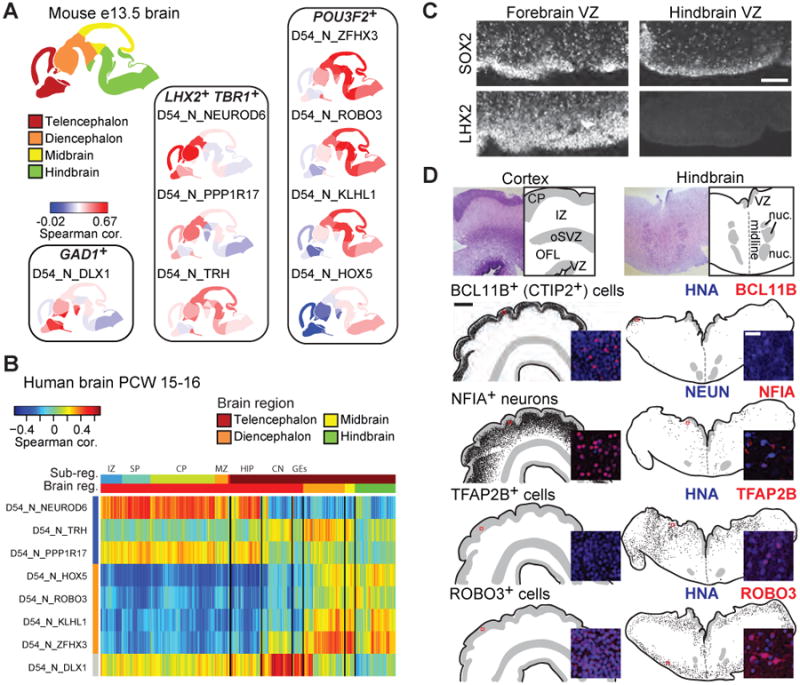
(A) Spearman correlation of D54 neuronal cell types to E13.5 Allen Brain Atlas of the Developing Mouse Brain based on genes differentially expressed between cell types and tissue regions (Table S1). Mouse regional gene expression levels are derived from in situ hybridization staining intensity. (B) Correlation of single D54 neurons with regions of the human brain from the Brainspan Atlas of the Developing Human Brain. Spearman correlations are based on genes differentially expressed between cell types and tissue regions (Table S1). (C) Fluorescence micrographs of 122 dpc cortex and 132 dpc hindbrain. LHX2 marks human cortical but not hindbrain progenitors, while SOX2 marks progenitors in both regions. Scale is 100 μm. (D) Immunohistochemistry of cortical and hindbrain cell type markers. Top: Nissl stain and representation of tissue architecture are shown; below: tissue representation based on DAPI staining. VZ ventricular zone, OFL outer fiber layer, oSVZ outer subventricular zone, IZ intermediate zone, CP cortical plate, nuc medullary nuclei. The entire tissue section was scored and each dot represents a positive cell. Scale is 1 mm. Inset: fluorescence micrograph showing a representative image (location indicated by red box); scale is 25 μm. See also Table S1.
To assess the similarity between the in vitro LHX2+ cell types and primary cortical cell types at a single-cell level, we analyzed neurons and progenitors prospectively isolated from fixed primary human cortical samples using FRISCR (Thomsen et al., 2016). We directly compared 472 single cells from human cortical samples (115 and 96 dpc) to the in vitro differentiated cells. Progenitors (SOX2+PAX6+TuJ1-) and neurons (SOX2-PAX6-TuJ1+), each further stratified by EOMES expression to isolate EOMES- radial glia, EOMES+ intermediate progenitors (IPCs), and EOMES+ and EOMES- neurons (Figure 5A). FRISCR data from fetal tissue was compared to SmartSeq2 single-cell RNA-Seq data from LHX2+ cultured cells at D26 and D54 (Figure 5B, Data S1). Many canonical markers of progenitors, IPCs and neurons were conserved in vitro (Figure 5B). In contrast oRG markers such as HOPX and TNC were reduced or absent in in vitro progenitors. Thus although a few HOPX+ cells were observed, most hESC-derived progenitors lacked oRG characteristics (Figure 5B, Data S1). Gene ontology analysis showed significant enrichment of gliogenesis and oligodendrocyte differentiation genes in primary progenitors, while embryonic development, extracellular matrix, and stress response gene classes were enriched in hESC-derived progenitors (Figure 5C). Progenitors appear to mature as vRG marker ANXA1 and oRG markers FAM107A and TNC become more highly expressed at D54 relative to D26 (Figure 5D, Data S1), and up-regulation at D54 was predictive of primary progenitor expression. Thus, over time the cultures increasingly resemble primary cortical cells.
Figure 5. Comparison of single stem cell-derived forebrain cells to primary human single cells.

(A) Flow cytometry plot showing primary cell populations that were sorted (n = 4) and profiled using FRISCR (n = 2). Mean ± SD of population percentage derived from four brains. (B) Expression of conserved and divergent gene modules between primary human cortical single cells and in vitro-differentiated progenitors and neurons at D26 and D54 (Data S1). For each block, progenitors are to the left, intermediate progenitors in the middle, and neurons to the right. (C) Results of gene ontology analysis of conserved and divergent gene expression modules. The top five most significant biological processes with a Bonferroni correction value <10-1 are shown. (D, E) Heatmaps show genes differentially expressed between D26 and D54 progenitors (D) and neurons (E) (Data S1). Column color bars are as in (B), row color bars show if expression is elevated at D26 (black) or D54 (gray). Black line shows genes with expression enriched in primary progenitors relative to primary neurons (D), or primary neurons relative to primary progenitors (E). See also Data S1.
We then evaluated differences between primary and in vitro generated neurons. Although primary IPCs appear distinct from neurons or progenitors, cultured cells that express IPC genes (including EOMES) strongly resemble neurons (Figure 5B). Fetal EOMES+ cells had higher expression of the progenitor eigengene (the average expression of the progenitor gene module) than hESC-derived cells (P = 3 × 10⁻⁷, t-test), and hESC-derived cells exhibit higher expression of the neuron eigengene than fetal cells (P = 3 × 10-20, t-test). Human ESC-derived neurons lacked substantial expression of SATB2 (a marker of later-born callosal-projecting neurons) and expressed the Cajal-Retzius cell marker RELN. Lastly, genes upregulated at D54 were more likely to be expressed in primary mid-gestation neurons (Figure 5E, Data S1). These data show at a single-cell level that our hESC-derived cells are molecularly similar to early primary cortical cells, and lack hallmarks of more mature neurons.
An inferred lineage tree with forebrain and mid/hindbrain branches
The clustering of single-cell transcriptomes resulted in identification of different cell types, which can be linked as branches in a lineage tree or states along a differentiation trajectory. To resolve the hierarchy of these cell types with putative lineal relationships, typical techniques use distance metrics calculated from the high-dimensional molecular data (Shin et al., 2015; Trapnell et al., 2014); however, the number of master-like molecules instructing cell fate decisions may be few (Colasante et al., 2015; Takahashi and Yamanaka, 2006; Vierbuchen et al., 2010). Furthermore, lineage algorithms based on transcriptomic data usually model a progression and not bifurcations (Shin et al., 2015; Trapnell et al., 2014). Indeed, a low-dimensional projection of the single-cell data like PCA (Fig. 2C) does not readily suggest a biologically meaningful linkage based on spanning-tree methods.
To address this, we used a Bayesian computational approach to simultaneously infer cell clusters' lineal relationships and the key set of markers and transition genes that define these relationships (personal communication; S. Ramanathan). This method analyzes the relationships between all the clusters, three at a time, and assumes that good marker genes are uniquely expressed in a cell cluster, while genes establishing relationships are shared between two of the three clusters. Briefly, we determined relative relationships between all possible triplets of cell types at neighboring time points, assessed their putative lineage, and identified genes with expression patterns reflecting this relationship. In each case, the three types of cells were separated in a subset of transcription factor space, and one of the types is defined as the intermediate. The intermediate type could be the parent, leading to two daughters, or alternatively, could be a transitional cell type between the other two types. To demonstrate this, we show the transcription factor expression for a triplet with strong evidence for an intermediate state (Figure 6A).
Figure 6. A lineage tree from single cell transcriptomics that is modulated by canonical Wnt/beta-catenin signaling.

(A) Example of one triplet of transcriptomic cell types showing strong evidence for an intermediate state (in blue). The non-intermediate states (red and green) express genes only along one of the two horizontal axes, whereas the intermediate state expresses both sets of genes and also expresses a set of marker genes (vertical axis) that is not highly expressed in either of the other two states. Axis values represent means of normalized gene expression over all the genes on a given axis. Transcriptomic types are named as in Figure 2. (B) In silico lineage tree assembled from triplets showing strong evidence of an intermediate state. Circles around groups of cell types indicate that they are not distinguishable in terms of lineage or progression using the tree-building algorithm. Transcriptomic types are named and colored as in Figure 2. Arrows indicate proposed lineage/progression links, and key asymmetrically regulated genes indicated by numbers next to the lineage arrow are listed in (C). (D) Differentiating cultures were treated with 2 μM XAV-939 or 1 μM CHIR-99021 during CI phase, then fixed and immunostained at D26 for LHX2 (green), POU3F2 (red), and SOX2 (not shown) to identify progenitors of each lineage branch. Scale 50 μm. (E) The proportion of SOX2+ progenitors costaining for LHX2 and/or POU3F2 were quantified. n = 3 independent experiments, >1000 cells counted per condition, * P < .05, ** P < .01, *** P < .001 by unpaired t-test relative to control. (F) Canonical Wnt/beta-catenin target genes AXIN2 and TNFRSF19 (but not pan-progenitor genes SOX3 or NCAM1) are disproportionally expressed by the minor progenitor cluster D12_P_S100A11 relative to the major cluster D12_P in the SmartSeq2 dataset. ** P < .01, ns not significant, by Fisher's exact test. See also Figure S5.
After identifying 162 high confidence triplets with evidence of a lineal relationship, we manually assembled these triplets into the most parsimonious putative in silico lineage tree (Figure 6B). The tree was rooted at D12 and assembled iteratively using information from triplets containing successively more mature time points. Seven of the 41 cell types could not be linked to other cell types with high confidence and were omitted from the lineage tree. Overall, our in silico tree suggests a major branch point separating the POU3F2-expressing and LHX2-expressing types, and identifies potential transcription factor candidates involved at specific branch points (Figure 6C).
Molecular regulation of the lineage tree branches
Although not immediately apparent from the inferred lineage, there are known pathways driving brain regionalization, such as FGF, BMP (Bertacchi et al., 2013), retinoic acid (Maury et al., 2015), and Wnt/beta-catenin (Maroof et al., 2013; Schuller and Rowitch, 2007) signaling pathways. FGF2 was removed from the PE phase entirely to determine if it were caudalizing the cells, but the chief markers of neuron types (forebrain excitatory, mid/hindbrain excitatory, and interneuron) were still present (Figure S5C). We also investigated whether the LHX2-POU3F2 lineage tree bifurcation occurred due to incomplete SMAD inhibition during CI, but the appearance of D26 POU3F2+ progenitors was unaffected by higher concentrations of SMAD inhibitors (Figure S5D). Similarly, the pan-retinoic acid receptor inhibitor BMS-493 had no effect on POU3F2+ progenitors although it was able to block the demonstrated caudalizing effect of added retinoic acid (Figure S5E). In contrast, we observed that inhibiting and activating the canonical Wnt/beta-catenin pathway prevented and promoted, respectively, the appearance of D26 POU3F2+ progenitors (control: 4.8 ± 1.0%, XAV-939: 0.6 ± 0.2% [P < .01, unpaired t-test], CHIR-99021: 94 ± 6% [P < .001, unpaired t-test]; Figure 6D-E,S5F). In addition, Wnt/beta-catenin signaling promotes the POU3F2 branch during CI but not during PE phase (Figure S5F), and consistent with this we observe the mid/hindbrain Wnt/beta-catenin targets AXIN2 and TNFRSF19 (Figure S4G, (Ha et al., 2012)) selectively expressed in the minor D12 progenitor cluster D12_P_S100A11 (Figure 6F, P < .01, Fisher's exact test); both of these insights together confirm the biological significance of our discovered cell types and suggest that the origin of the mid-hindbrain POU3F2 branch can occur during early neurodevelopment prior to the bifurcation at D26 (Figure 6B). These functional data agree with recent reports of in vitro neural regionalization (Maroof et al., 2013; Maury et al., 2015) and demonstrate direct concordance between our observed lineage branches and those regional cell types previously studied alone.
Clonal analysis confirms forebrain cell types segregating from mid/hindbrain cell types
The in silico lineage tree predicts that POU3F2- and LHX2-expressing D54 cell types arise from either distinct or common progenitors as both can be detected at D26. To test this, we undertook clonal analysis of cell fate from D26 progenitors using a viral barcoding strategy (Figure 7A). We cloned a 10-bp degenerate barcode library in the 3′ UTR of a tdTomato expression cassette into a VSV-G-pseudotyped retrovirus library (Figure S6A), which showed no obvious tropism bias (Figure S6B). Clones tracked by daily time-lapse microscopy display neuronal and non-neuronal morphologies, and clones analyzed by immunostaining demonstrate subtype diversity (Figure 7B,S6C). In addition, strong transcriptomic correlation was observed between infected and uninfected cells (Figure S6D).
Figure 7. Clonal analysis confirms distinct POU3F2 and LHX2 branches of the human brain lineage tree.

(A) Schematic of viral barcoding experiment, indicating time of infection and collection. (B) Representative fluorescence micrographs captured from live differentiating clones, exhibiting non-neuronal (Clone A) and neuronal morphologies (Clone B). Scale bar is 250 μm (Clone A) and 500 μm (Clone B). (C) All multicellular clones are shown as individual rows and each D54 cell type as columns. All single cell clones are combined in the bottom row (“singlets”). The size of each dot indicates the number of cells per cell type from a clone. Dots are colored as cell types in Figure 2E. (D) Clonal analysis of cell-autonomous lineage potential was performed by re-plating D26 progenitors at clonal density on feeder mouse astrocytes, then analyzing outgrown colonies for cell composition at D54 by immunostaining. (E and G) Example colonies are stained with antibodies for HNA + TuJ1 (blue), LHX2 (green), and either BCL11B (E, red) or TFAP2B (G, red). Colonies were grouped into categories of LHX2-containing and non-LHX2-containing. Scale bar, 50 μm. (F) Colonies that contain LHX2+ cells are more likely to contain BCL11B+ cells as compared to colonies lacking LHX2+ cells. (H) Colonies that contain LHX2+ cells are less likely to contain TFAP2B+ cells as compared to colonies lacking LHX2+ cells. In F and H, five independent differentiations were analyzed, and 25-38 colonies per immunostaining cocktail per experiment were inspected for the presence of cell types. *** P < .001, ** P < .01 by unpaired t-test. See also Figures S6-7, Table S2.
For barcoded lineage tracing, D27 cells were infected following re-plating at D26 with the barcoded retrovirus library and then allowed to differentiate until D54 (Figure 7A,S6E) when cells were processed to simultaneously recover the retroviral barcode (clone association) and the transcriptome (cell type). To match D54 infected cells profiled by SmartSeq2 with cell types identified by CelSeq, we developed a consensus predictive gene set consisting of genes from CelSeq modules that were also detected by SmartSeq2 (Figure S7A-D, Table S1), and then built a random forest model using these features. From two independent differentiation experiments containing in sum 81 total clones, we sorted single infected cells based on tdTomato fluorescence and DCX-citrine expression (Figure S6E). We obtained barcodes from 375 tdTomato+ sorted single cells, and 315 high quality cells could be used to evaluate cell type composition of the clones. Forty-one multicellular clones were detected with 33 spanning more than one cell type (Figure 7C,S6F-I,Table S2). Twenty-four clones contained POU3F2+ but not LHX2+ cell types, 8 clones contained LHX2+ but not POU3F2+ cell types, and only 5 clones contained both POU3F2+ and LHX2+ cell types, which is fewer than would be observed if these cell types assorted into clones independently (P < .01 by Fisher's exact test; Figure 7C, Table S2). The five clones containing both POU3F2+ and LHX2+ cell types contained more cells than the others (median = 19 cells versus median = 2.5 cells, P = 0.016 by two-sided Kolmogorov-Smirnov test), suggesting they arose from more primitive neural progenitors. D54_N_DLX1 interneurons were detected in clones with LHX2+ or POU3F2+ cells, and “other” cell types were found in clones composed mainly of like cell types. These fate-mapping data directly validate the computational lineage tree, indicating that the majority of neural progenitors at D27 are committed to distinct region-specific fates, yet some primitive progenitors remain uncommitted.
To test if differences in cell fate of D26 progenitors were due to cell-autonomous differences in lineage potential and to bypass possible biases from viral fate mapping, we generated single-cell clones by seeding D26 progenitors at clonal density to differentiate for four weeks on mouse astrocytes (yielding 2.3 ± 1.4 spatially resolved colonies/well, Figure 7D,S6J). Colonies varied in size (1-1000 cells), but those with cortical lineage potential (containing LHX2+ cells) typically contained more cells than colonies lacking LHX2+ cells (Figure S6K). Cell-type-specific antibodies were used for immunostaining to assess cell-type composition within colonies (850 colonies analyzed over n = 5 independent experiments). We marked human cells with human nuclear antigen (HNA), neurons with TUBB3 (TuJ1), and cortical lineage potential cells with LHX2. These markers were multiplexed with cell-type markers identified from transcriptomics. One such cell-type markers is BCL11B, which marks D54_N_NEUROD6 and D54_N_PPP1R17 cell types (Figure 2E,4D). Colonies containing LHX2+ cells much more likely included neurons expressing BCL11B+ neurons than those lacking LHX2+ cells (66 ± 14% versus 9 ± 14%, P < .001, unpaired t-test, Figure 7E-F), similar to NFIA+TuJ1+ cortical neurons (Figure S6L). In contrast, colonies containing LHX2+ cells were less likely to contain TFAP2B+ neurons (POU3F2+ clusters) than those lacking LHX2+ cells (3 ± 6% versus 24 ± 9%, P < .01, unpaired t-test, Figure 7G-H). These results directly link prominent cell type markers to the LHX2 or the POU3F2 lineage tree branches. Other cell type markers that we observed in our sequencing dataset (POU3F2, FOXP2, CALB2 (Calretinin), and CRABP1) demonstrated no significant colony associations with LHX2 (Figure S6M-P). Together, these clonal outgrowth results independently corroborate the distinct cortical and mid/hindbrain branches of the human neural single-cell lineage tree. Moreover, they suggest that region-specific branches are caused by differences in cell-autonomous commitment among D26 progenitors rather than stochastic and/or non-cell-autonomous phenomena.
Discussion
We present a comprehensive characterization of human brain cell types generated from hESCs, and define 41 cell types consisting of 14 progenitor, 5 transitional, 19 neuronal, and 3 non-neural cell types. Our data demonstrate that multiple cortical and mid/hindbrain neuronal and progenitor cell types are produced in our 2D in vitro differentiations, and these regional identities can be toggled by modulating canonical Wnt/beta-catenin signaling. In addition, we chart the molecular overlap between cultured and primary cortical cell types, using both atlas and single-cell analysis from human primary cortex. A Bayesian algorithm was used to generate a lineage tree and chart the trajectory of our regionally diverse cell types, while highlighting regulators of the lineage tree. Finally, we confirmed these lineage relationships through clonal analyses of fate and lineage potential, to directly demonstrate that hESC-derived neural progenitors have cell-autonomously committed identities. This study charts human brain region-specific development, which is essential for accurately modeling and understanding the logic and uniqueness of human brain.
Our inferred lineage tree branches mimic established regional differences in neurogenesis. Although the inferred lineage tree was supported by our fate mapping experiments, some cell types could not be mapped with high confidence into the lineage tree. The cell types are lineally related as shown by clonal analysis, however the lineage algorithm requires the identification of intermediate cell types to allow the high confidence prediction of linkage. Furthermore, the algorithm requires the asymmetric distribution of transcription factor expression. If cell sampling failed to recover a short-lived or rare intermediate, or if there were too few asymmetrically expressed transcription factors, our algorithm could not generate a high-confidence linkage.
Despite the forebrain-mid/hindbrain branch point at D26, Wnt/beta-catenin signaling instructs the mid/hindbrain lineage branch prior to D12 (Figure 6D-F,S5F). This is consistent with previous hESC experiments (Maroof et al., 2013; Maury et al., 2015) and mouse genetics (Schuller and Rowitch, 2007), leading to Wnt target gene expression in D12_P_S100A11 cells (Figure 6F) but not yet mid/hindbrain markers (Figure 2E). The mid/hindbrain state could be specified in these cells prior to expression of markers, alternatively, a lack of observed S100A11 cells at D19 could have made this lineage branch impossible to detect. Regardless, use of WNT to bias the lineage tree will help produce more uniform populations of targeted brain region cell types from hESCs.
Our lineage tree shows how early-born human neural progenitors give rise to early neurons with different regional identities. Neural pan-progenitor genes like VIM, PAX6, and SOX2 are expressed in progenitors from D12, but vRG marker ANXA1 and oRG markers FAM107A, HOPX, and TNC (Pollen et al., 2015; Thomsen et al., 2016) are only expressed at D54, indicating that these cells likely reflect radial glia prior to oSZ formation. This early staging is consistent with our results mapping the cultured cells to the earliest stages of the human developmental atlas. We also detected early-formed human neurons. The earliest (D12) DCX+ neurons express TBR1 and weak levels of EOMES and RELN. Perhaps these D12 DCX+ neurons correspond to predecessor cells that express TBR1 and are formed during neural tube closing (Bystron et al., 2006). Cells with highest RELN levels (presumptive Cajal-Retzius cells (Hevner et al., 2003)) were detected later at D26 and D40, and these frequently expressed EOMES. Although EOMES is a canonical marker of proliferative IPCs in vivo, most in vitro EOMES+ cells were not proliferative and instead had a strong neuronal signature. These cell types resemble preplate cells that co-express EOMES and TBR1 (Figure 3E; (Bulfone et al., 1999)). Indeed, 56% of genes differentially expressed in neurons from the LHX2+ branch are detected in mouse preplate or preplate-derived cells. We believe that future human embryonic brain single cell atlases are required for comparison and to guide the hESC modeling field.
The cortex develops through the sequential creation of cellular layers that exhibit unique molecular and morphological properties. We did not detect some classical (especially upper) layer markers (e.g., SATB2, CUX2). This could be due to the limited time in culture (54 days), and progenitors may still be producing early born neurons. Also, classical layer markers may have poor predictive utility at mid-gestation stages: they are only weakly expressed in fetal macaque with dramatic regional and temporal variation (Bakken et al., 2016). Furthermore, neurons from primary mid-gestational tissues appear relatively homogeneous (Figure 5B) (Camp et al., 2015; Pollen et al., 2014). These considerations spotlight single cell RNA-Seq as a high-value methodology for cultured cell characterization, and suggest cortical progenitors will likely need to be cultured longer to yield upper layer cortical neurons.
In summary, our observations suggest our culture system models the earliest steps of human brain development including regional patterning, which is vital because primary samples at these stages are exceedingly rare. This study represents an advance for the field in terms of breadth and depth of cell characterization and provides benchmark datasets to understand the origins and diseases of the human brain.
Experimental Procedures
Genome engineering and hESC culture
Human H1 or H9 ESCs (WiCell) were maintained with mTeSR1 media (Stem Cell Technologies) on Matrigel (BD) or hES media (DMEM/F12 with 20% KSR; Life Technologies) on CF-1 MEFs (GlobalStem). The TALEN genes targeting SOX2, DCX, and OTX2 were made using the FLASH method (Reyon et al., 2012), and PAX6 using the REAL method (Sander et al., 2011). Engineered lines we generated as previously described (Martinez et al., 2015). See Supplemental Experimental Procedures for more details.
hESC neural differentiation
hESCs were seeded for a 12-day cortical induction (CI) phase in NIM media with SMAD inhibitors (Chambers 2009) and cyclopamine (Stemgent); reseeded for the progenitor expansion (PE) phase at D12 and D19 in neural stem cell culture media (NSCM) with EGF (Thermo Fisher) and bFGF (Ciccolini and Svendsen, 1998; Tropepe et al., 1999); and finally at D26, re-seed for neural differentiation (ND) with neurogenic/neurotrophic factors BDNF (R&D Systems), GDNF (R&D Systems), NT3 (R&D Systems), and cAMP (Sigma) (Hu et al., 2010). Differentiations were validated by immunostaining at D12, D26, and D54, and by flow cytometry at D26. For detail, see Supplemental Experimental Procedures.
Antibody staining
Cells were fixed in 4% PFA for 15 min, blocked and permeabilized in 10% normal goat serum with 0.1% Triton X-100. Primary and secondary antibodies are listed (Table S3). Brain pieces were fixed overnight in 4% PFA/PBS at 4°C, then cryoprotected in 30% sucrose in PBS for 24-48 hours, then embedded in OCT. Cryosections were cut on the coronal plane at 20 μm thickness, then stained as above (see Table S3 for antibodies).
Calcium imaging
Cells were loaded with 4 μM FURA2-AM (Thermo Fisher) in ND at room temperature for 30 min. Ca2+ activity was recorded using a 40× objective for 5 min intervals. Images were captured with 300 ms exposures at both 340 nm and 380 nm. Nikon NIS-Elements software was used to analyze events with measurements greater than 0.006 RFU above baseline.
Fetal brain tissue processing
Human fetal tissue was donated with written informed consent and requirements of the Uniform Anatomical Gift Act and National Organ Transplant Act were followed. Sample age in days post conception was estimated by foot length and dated menstrual cycles. Cortical tissue was identified by morphology, physically disrupted, and then enzymatically dissociated to single cells. Cells were then washed, filtered, counted, and fixed for storage at -80°C until processing by FRISCR. See Su pplemental Experimental Procedures for more details.
Single cell transcriptomics
Single cells were sorted on a FACS Aria (BD) into 96-well collection plates and stored at -80°C. We prepared libraries as previously reported (Hashimshony et al., 2012) with a few modifications (See Supplemental Experimental Procedures), FRISCR was carried out as previously described (Thomsen et al., 2016), and SmartSeq2 sequencing libraries were prepared as previously reported (Picelli et al., 2013). Libraries were then quantified and sequenced on a HiSeq (Illumina). Details on mapping RNA-Seq data, clustering to identify cell types, comparing data between CelSeq and SmartSeq2, atlases, and FRISCR are provided in Supplemental Experimental Procedures. Metadata for each profiled single cell is in Data S2.
Lineage inference
We used a Bayesian method (personal communication; S. Ramanathan). Briefly, we analyzed all possible triplets of cell types present at adjacent time points, then based on only transcription factor expression data we used a Bayesian formulation to identify the highest-probability triplets with linked topologies. Triplets that showed strong evidence of topological linkages were assembled iteratively into a tree which was rooted at D12. When we observed conflicting triplets, we selected the topology with higher probability. See Supplemental Experimental Procedures for more details.
Viral clonal analysis
A barcoded retroviral library was constructed inserting a random 10bp barcode into the 3′ end of tdTomato and then packaging it into retrovirus particles (pseudotyped with VSV-G). At D27, 4 to 6 × 10³ IFU were inoculated per well of a 24-well plate (1.5 × 10⁶ cells), to yield 20-50 tdTomato+ colonies per well at D54. Daily fluorescent images were taken for some clones to monitor expansion. Single cells were processed by SmartSeq2 as described above. Barcodes and transcriptomes were identified, and random forest classification was used to determine the cell type identity. See Supplemental Experimental Procedures for more details.
Progenitor potential assay by clonal outgrowth
Single cells from D26 were plated onto primary mouse astrocytes at clonal density (10 cells/well of a 96 well plate). Single cell colonies were differentiated for 4 weeks in ND media, fixed and analyzed by immunostaining (Table S3). See supplemental Experimental Procedures for details.
Supplementary Material
Acknowledgments
We wish to thank the Allen Institute founders, P. G. Allen and J. Allen, for their vision, encouragement and support. We wish to thank A. Bernard and E. Lein for assistance with human specimen procurement, J. Miller for assistance in analysis of BrainSpan Atlas of the Developing Human Brain, and Luis Puelles for consultation on developmental neuroanatomy. Human primary samples were received from the “Laboratory of Developmental Biology,” supported by NIH Award Number 5R24HD000836 from the Eunice Kennedy Shriver National Institute of Child Health and Human Development. SR was supported in part by the NIH Directors Pioneer Award 5DP1MH099906-03 and National Science Foundation grant PHY-0952766.
Footnotes
Accession Numbers: Raw and normalized population and single cell RNA-Seq data from hESC-derived cells can be obtained at NCBI GEO: GSE86894. Raw and normalized primary fetal human single cell RNA-Seq data, dbGaP: phs001205.v1.p1.
Author Contributions: Genome engineering was done by AJ, ARK, RAM, RCM, AMN, NKN, LJT, and MS and planned by JSG and AK. Stem cell banking was done by AMN, NKN, and RAM. YW and SY adapted the differentiation protocol. RAM, HM, MF, BWG and YW conducted all differentiations. Immunostaining was done by YW, HM, MF and AMN. Calcium imaging was done by BWG and RAM, planned by YW. Live single-cell RNA-Seq was piloted by BPL and CY, and done by ARK and ERT. Bioinformatic analysis of RNA-Seq data was done by ZY and VM. CLT analyzed developing mouse atlas data and provided program management. The lineage algorithm was developed by LF and SR, and applied by VM with help from SM. Primary human tissue was obtained with help from IG, processed by JKM, RDH, and SIS. FRISCR analysis was conducted by ERT. Viral barcoding experiments were conducted by SK, and non-viral clonal analysis by JKM. All sorting was done by NVS and SB. Experiments were conceived by JSG, BPL, YW, JKM, SK, VM, JKM, ZY and SR. Paper was written by JKM, BPL, YW, VM, SK, JSG, and SR. SR and JWP provided program leadership.
Publisher's Disclaimer: This is a PDF file of an unedited manuscript that has been accepted for publication. As a service to our customers we are providing this early version of the manuscript. The manuscript will undergo copyediting, typesetting, and review of the resulting proof before it is published in its final citable form. Please note that during the production process errors may be discovered which could affect the content, and all legal disclaimers that apply to the journal pertain.
References
- Bakken TE, Miller JA, Ding SL, Sunkin SM, Smith KA, Ng L, Szafer A, Dalley RA, Royall JJ, Lemon T, et al. A comprehensive transcriptional map of primate brain development. Nature. 2016;535:367–375. doi: 10.1038/nature18637. [DOI] [PMC free article] [PubMed] [Google Scholar]
- Bertacchi M, Pandolfini L, Murenu E, Viegi A, Capsoni S, Cellerino A, Messina A, Casarosa S, Cremisi F. The positional identity of mouse ES cell-generated neurons is affected by BMP signaling. Cellular and molecular life sciences : CMLS. 2013;70:1095–1111. doi: 10.1007/s00018-012-1182-3. [DOI] [PMC free article] [PubMed] [Google Scholar]
- Bulfone A, Martinez S, Marigo V, Campanella M, Basile A, Quaderi N, Gattuso C, Rubenstein JLR, Ballabio A. Expression pattern of the Tbr2 (Eomesodermin) gene during mouse and chick brain development. Mechanisms of Development. 1999;84:133–138. doi: 10.1016/s0925-4773(99)00053-2. [DOI] [PubMed] [Google Scholar]
- Bystron I, Rakic P, Molnar Z, Blakemore C. The first neurons of the human cerebral cortex. Nature neuroscience. 2006;9:880–886. doi: 10.1038/nn1726. [DOI] [PubMed] [Google Scholar]
- Camp JG, Badsha F, Florio M, Kanton S, Gerber T, Wilsch-Brauninger M, Lewitus E, Sykes A, Hevers W, Lancaster M, et al. Human cerebral organoids recapitulate gene expression programs of fetal neocortex development. Proceedings of the National Academy of Sciences of the United States of America. 2015;112:15672–15677. doi: 10.1073/pnas.1520760112. [DOI] [PMC free article] [PubMed] [Google Scholar]
- Chambers SM, Fasano CA, Papapetrou EP, Tomishima M, Sadelain M, Studer L. Highly efficient neural conversion of human ES and iPS cells by dual inhibition of SMAD signaling. Nat Biotech. 2009;27:275–280. doi: 10.1038/nbt.1529. [DOI] [PMC free article] [PubMed] [Google Scholar]
- Ciccolini F, Svendsen CN. Fibroblast growth factor 2 (FGF-2) promotes acquisition of epidermal growth factor (EGF) responsiveness in mouse striatal precursor cells: identification of neural precursors responding to both EGF and FGF-2. The Journal of neuroscience : the official journal of the Society for Neuroscience. 1998;18:7869–7880. doi: 10.1523/JNEUROSCI.18-19-07869.1998. [DOI] [PMC free article] [PubMed] [Google Scholar]
- Colasante G, Lignani G, Rubio A, Medrihan L, Yekhlef L, Sessa A, Massimino L, Giannelli SG, Sacchetti S, Caiazzo M, et al. Rapid Conversion of Fibroblasts into Functional Forebrain GABAergic Interneurons by Direct Genetic Reprogramming. Cell stem cell. 2015;17:719–734. doi: 10.1016/j.stem.2015.09.002. [DOI] [PubMed] [Google Scholar]
- Edri R, Yaffe Y, Ziller MJ, Mutukula N, Volkman R, David E, Jacob-Hirsch J, Malcov H, Levy C, Rechavi G, et al. Analysing human neural stem cell ontogeny by consecutive isolation of Notch active neural progenitors. Nature communications. 2015;6:6500. doi: 10.1038/ncomms7500. [DOI] [PMC free article] [PubMed] [Google Scholar]
- Espuny-Camacho I, Michelsen KA, Gall D, Linaro D, Hasche A, Bonnefont J, Bali C, Orduz D, Bilheu A, Herpoel A, et al. Pyramidal neurons derived from human pluripotent stem cells integrate efficiently into mouse brain circuits in vivo. Neuron. 2013;77:440–456. doi: 10.1016/j.neuron.2012.12.011. [DOI] [PubMed] [Google Scholar]
- Florio M, Albert M, Taverna E, Namba T, Brandl H, Lewitus E, Haffner C, Sykes A, Wong FK, Peters J, et al. Human-specific gene ARHGAP11B promotes basal progenitor amplification and neocortex expansion. Science. 2015;347:1465–1470. doi: 10.1126/science.aaa1975. [DOI] [PubMed] [Google Scholar]
- Gaspard N, Bouschet T, Hourez R, Dimidschstein J, Naeije G, van den Ameele J, Espuny-Camacho I, Herpoel A, Passante L, Schiffmann SN, et al. An intrinsic mechanism of corticogenesis from embryonic stem cells. Nature. 2008;455:351–357. doi: 10.1038/nature07287. [DOI] [PubMed] [Google Scholar]
- Ha A, Perez-Iratxeta C, Liu H, Mears AJ, Wallace VA. Identification of Wnt/beta-catenin modulated genes in the developing retina. Molecular vision. 2012;18:645–656. [PMC free article] [PubMed] [Google Scholar]
- Hanashima C, Li SC, Shen L, Lai E, Fishell G. Foxg1 suppresses early cortical cell fate. Science. 2004;303:56–59. doi: 10.1126/science.1090674. [DOI] [PubMed] [Google Scholar]
- Hashimshony T, Wagner F, Sher N, Yanai I. CEL-Seq: single-cell RNA-Seq by multiplexed linear amplification. Cell reports. 2012;2:666–673. doi: 10.1016/j.celrep.2012.08.003. [DOI] [PubMed] [Google Scholar]
- Hevner RF, Neogi T, Englund C, Daza RA, Fink A. Cajal-Retzius cells in the mouse: transcription factors, neurotransmitters, and birthdays suggest a pallial origin. Brain research Developmental brain research. 2003;141:39–53. doi: 10.1016/s0165-3806(02)00641-7. [DOI] [PubMed] [Google Scholar]
- Hirata T, Suda Y, Nakao K, Narimatsu M, Hirano T, Hibi M. Zinc finger gene fez-like functions in the formation of subplate neurons and thalamocortical axons. Developmental dynamics : an official publication of the American Association of Anatomists. 2004;230:546–556. doi: 10.1002/dvdy.20068. [DOI] [PubMed] [Google Scholar]
- Hook V, Brennand KristenJ, Kim Y, Toneff T, Funkelstein L, Lee KellyC, Ziegler M, Gage FredH. Human iPSC Neurons Display Activity-Dependent Neurotransmitter Secretion: Aberrant Catecholamine Levels in Schizophrenia Neurons. Stem Cell Reports. 2014;3:531–538. doi: 10.1016/j.stemcr.2014.08.001. [DOI] [PMC free article] [PubMed] [Google Scholar]
- Hu BY, Weick JP, Yu J, Ma LX, Zhang XQ, Thomson JA, Zhang SC. Neural differentiation of human induced pluripotent stem cells follows developmental principles but with variable potency. Proceedings of the National Academy of Sciences of the United States of America. 2010;107:4335–4340. doi: 10.1073/pnas.0910012107. [DOI] [PMC free article] [PubMed] [Google Scholar]
- Klein AM, Mazutis L, Akartuna I, Tallapragada N, Veres A, Li V, Peshkin L, Weitz DA, Kirschner MW. Droplet barcoding for single-cell transcriptomics applied to embryonic stem cells. Cell. 2015;161:1187–1201. doi: 10.1016/j.cell.2015.04.044. [DOI] [PMC free article] [PubMed] [Google Scholar]
- Konopka G, Friedrich T, Davis-Turak J, Winden K, Oldham MichaelC, Gao F, Chen L, Wang GZ, Luo R, Preuss ToddM, et al. Human-Specific Transcriptional Networks in the Brain. Neuron. 2012;75:601–617. doi: 10.1016/j.neuron.2012.05.034. [DOI] [PMC free article] [PubMed] [Google Scholar]
- Lancaster MA, Renner M, Martin CA, Wenzel D, Bicknell LS, Hurles ME, Homfray T, Penninger JM, Jackson AP, Knoblich JA. Cerebral organoids model human brain development and microcephaly. Nature. 2013;501:373–379. doi: 10.1038/nature12517. [DOI] [PMC free article] [PubMed] [Google Scholar]
- Langfelder P, Horvath S. Eigengene networks for studying the relationships between co-expression modules. BMC systems biology. 2007;1:54. doi: 10.1186/1752-0509-1-54. [DOI] [PMC free article] [PubMed] [Google Scholar]
- Langfelder P, Luo R, Oldham MC, Horvath S. Is my network module preserved and reproducible? PLoS computational biology. 2011;7:e1001057. doi: 10.1371/journal.pcbi.1001057. [DOI] [PMC free article] [PubMed] [Google Scholar]
- Lui JH, Nowakowski TJ, Pollen AA, Javaherian A, Kriegstein AR, Oldham MC. Radial glia require PDGFD-PDGFRbeta signalling in human but not mouse neocortex. Nature. 2014;515:264–268. doi: 10.1038/nature13973. [DOI] [PMC free article] [PubMed] [Google Scholar]
- Macosko EZ, Basu A, Satija R, Nemesh J, Shekhar K, Goldman M, Tirosh I, Bialas AR, Kamitaki N, Martersteck EM, et al. Highly Parallel Genome-wide Expression Profiling of Individual Cells Using Nanoliter Droplets. Cell. 2015;161:1202–1214. doi: 10.1016/j.cell.2015.05.002. [DOI] [PMC free article] [PubMed] [Google Scholar]
- Mariani J, Simonini MV, Palejev D, Tomasini L, Coppola G, Szekely AM, Horvath TL, Vaccarino FM. Modeling human cortical development in vitro using induced pluripotent stem cells. Proceedings of the National Academy of Sciences of the United States of America. 2012;109:12770–12775. doi: 10.1073/pnas.1202944109. [DOI] [PMC free article] [PubMed] [Google Scholar]
- Maroof AM, Keros S, Tyson JA, Ying SW, Ganat YM, Merkle FT, Liu B, Goulburn A, Stanley EG, Elefanty AG, et al. Directed differentiation and functional maturation of cortical interneurons from human embryonic stem cells. Cell stem cell. 2013;12:559–572. doi: 10.1016/j.stem.2013.04.008. [DOI] [PMC free article] [PubMed] [Google Scholar]
- Martinez RA, Stein JL, Krostag AR, Nelson AM, Marken JS, Menon V, May RC, Yao Z, Kaykas A, Geschwind DH, et al. Genome engineering of isogenic human ES cells to model autism disorders. Nucleic Acids Res. 2015;43:e65. doi: 10.1093/nar/gkv164. [DOI] [PMC free article] [PubMed] [Google Scholar]
- Maury Y, Come J, Piskorowski RA, Salah-Mohellibi N, Chevaleyre V, Peschanski M, Martinat C, Nedelec S. Combinatorial analysis of developmental cues efficiently converts human pluripotent stem cells into multiple neuronal subtypes. Nature biotechnology. 2015;33:89–96. doi: 10.1038/nbt.3049. [DOI] [PubMed] [Google Scholar]
- Miller JA, Ding SL, Sunkin SM, Smith KA, Ng L, Szafer A, Ebbert A, Riley ZL, Royall JJ, Aiona K, et al. Transcriptional landscape of the prenatal human brain. Nature. 2014;508:199–206. doi: 10.1038/nature13185. [DOI] [PMC free article] [PubMed] [Google Scholar]
- Miller JC, Tan S, Qiao G, Barlow KA, Wang J, Xia DF, Meng X, Paschon DE, Leung E, Hinkley SJ, et al. A TALE nuclease architecture for efficient genome editing. Nature biotechnology. 2011;29:143–148. doi: 10.1038/nbt.1755. [DOI] [PubMed] [Google Scholar]
- Paul F, Arkin Y, Giladi A, Jaitin DA, Kenigsberg E, Keren-Shaul H, Winter D, Lara-Astiaso D, Gury M, Weiner A, et al. Transcriptional Heterogeneity and Lineage Commitment in Myeloid Progenitors. Cell. 2015;163:1663–1677. doi: 10.1016/j.cell.2015.11.013. [DOI] [PubMed] [Google Scholar]
- Picelli S, Bjorklund AK, Faridani OR, Sagasser S, Winberg G, Sandberg R. Smart-seq2 for sensitive full-length transcriptome profiling in single cells. Nature methods. 2013;10:1096–1098. doi: 10.1038/nmeth.2639. [DOI] [PubMed] [Google Scholar]
- Pollen AA, Nowakowski TJ, Chen J, Retallack H, Sandoval-Espinosa C, Nicholas CR, Shuga J, Liu SJ, Oldham MC, Diaz A, et al. Molecular Identity of Human Outer Radial Glia during Cortical Development. Cell. 2015;163:55–67. doi: 10.1016/j.cell.2015.09.004. [DOI] [PMC free article] [PubMed] [Google Scholar]
- Pollen AA, Nowakowski TJ, Shuga J, Wang X, Leyrat AA, Lui JH, Li N, Szpankowski L, Fowler B, Chen P, et al. Low-coverage single-cell mRNA sequencing reveals cellular heterogeneity and activated signaling pathways in developing cerebral cortex. Nature biotechnology. 2014;32:1053–1058. doi: 10.1038/nbt.2967. [DOI] [PMC free article] [PubMed] [Google Scholar]
- Porter FD, Drago J, Xu Y, Cheema SS, Wassif C, Huang SP, Lee E, Grinberg A, Massalas JS, Bodine D, et al. Lhx2, a LIM homeobox gene, is required for eye, forebrain, and definitive erythrocyte development. Development. 1997;124:2935–2944. doi: 10.1242/dev.124.15.2935. [DOI] [PubMed] [Google Scholar]
- Qian X, Nguyen HN, Song MM, Hadiono C, Ogden SC, Hammack C, Yao B, Hamersky GR, Jacob F, Zhong C, et al. Brain-Region-Specific Organoids Using Mini-bioreactors for Modeling ZIKV Exposure. Cell. 2016;165:1238–1254. doi: 10.1016/j.cell.2016.04.032. [DOI] [PMC free article] [PubMed] [Google Scholar]
- Reilly SK, Yin J, Ayoub AE, Emera D, Leng J, Cotney J, Sarro R, Rakic P, Noonan JP. Evolutionary changes in promoter and enhancer activity during human corticogenesis. Science. 2015;347:1155–1159. doi: 10.1126/science.1260943. [DOI] [PMC free article] [PubMed] [Google Scholar]
- Reyon D, Tsai SQ, Khayter C, Foden JA, Sander JD, Joung JK. FLASH assembly of TALENs for high-throughput genome editing. Nature biotechnology. 2012;30:460–465. doi: 10.1038/nbt.2170. [DOI] [PMC free article] [PubMed] [Google Scholar]
- Ricciardi S, Ungaro F, Hambrock M, Rademacher N, Stefanelli G, Brambilla D, Sessa A, Magagnotti C, Bachi A, Giarda E, et al. CDKL5 ensures excitatory synapse stability by reinforcing NGL-1–PSD95 interaction in the postsynaptic compartment and is impaired in patient iPSC-derived neurons. Nature cell biology. 2012;14:911–923. doi: 10.1038/ncb2566. [DOI] [PMC free article] [PubMed] [Google Scholar]
- Sander JD, Cade L, Khayter C, Reyon D, Peterson RT, Joung JK, Yeh JR. Targeted gene disruption in somatic zebrafish cells using engineered TALENs. Nature biotechnology. 2011;29:697–698. doi: 10.1038/nbt.1934. [DOI] [PMC free article] [PubMed] [Google Scholar]
- Schuller U, Rowitch DH. Beta-catenin function is required for cerebellar morphogenesis. Brain research. 2007;1140:161–169. doi: 10.1016/j.brainres.2006.05.105. [DOI] [PubMed] [Google Scholar]
- Shi Y, Kirwan P, Smith J, Robinson HP, Livesey FJ. Human cerebral cortex development from pluripotent stem cells to functional excitatory synapses. Nature neuroscience. 2012;15:477–486. S471. doi: 10.1038/nn.3041. [DOI] [PMC free article] [PubMed] [Google Scholar]
- Shin J, Berg DA, Zhu Y, Shin JY, Song J, Bonaguidi MA, Enikolopov G, Nauen DW, Christian KM, Ming GL, et al. Single-Cell RNA-Seq with Waterfall Reveals Molecular Cascades underlying Adult Neurogenesis. Cell stem cell. 2015;17:360–372. doi: 10.1016/j.stem.2015.07.013. [DOI] [PMC free article] [PubMed] [Google Scholar]
- Silbereis JC, Pochareddy S, Zhu Y, Li M, Sestan N. The Cellular and Molecular Landscapes of the Developing Human Central Nervous System. Neuron. 2016;89:248–268. doi: 10.1016/j.neuron.2015.12.008. [DOI] [PMC free article] [PubMed] [Google Scholar]
- Takahashi K, Yamanaka S. Induction of Pluripotent Stem Cells from Mouse Embryonic and Adult Fibroblast Cultures by Defined Factors. Cell. 2006;126:663–676. doi: 10.1016/j.cell.2006.07.024. [DOI] [PubMed] [Google Scholar]
- Tasic B, Menon V, Nguyen TN, Kim TK, Jarsky T, Yao Z, Levi B, Gray LT, Sorensen SA, Dolbeare T, et al. Adult mouse cortical cell taxonomy revealed by single cell transcriptomics. Nature neuroscience. 2016 doi: 10.1038/nn.4216. [DOI] [PMC free article] [PubMed] [Google Scholar]
- Thompson CL, Ng L, Menon V, Martinez S, Lee CK, Glattfelder K, Sunkin SM, Henry A, Lau C, Dang C, et al. A high-resolution spatiotemporal atlas of gene expression of the developing mouse brain. Neuron. 2014;83:309–323. doi: 10.1016/j.neuron.2014.05.033. [DOI] [PMC free article] [PubMed] [Google Scholar]
- Thomsen ER, Mich JK, Yao Z, Hodge RD, Doyle AM, Jang S, Shehata SI, Nelson AM, Shapovalova NV, Levi BP, et al. Fixed single-cell transcriptomic characterization of human radial glial diversity. Nature methods. 2016;13:87–93. doi: 10.1038/nmeth.3629. [DOI] [PMC free article] [PubMed] [Google Scholar]
- Trapnell C, Cacchiarelli D, Grimsby J, Pokharel P, Li S, Morse M, Lennon NJ, Livak KJ, Mikkelsen TS, Rinn JL. The dynamics and regulators of cell fate decisions are revealed by pseudotemporal ordering of single cells. Nature biotechnology. 2014;32:381–386. doi: 10.1038/nbt.2859. [DOI] [PMC free article] [PubMed] [Google Scholar]
- Treutlein B, Brownfield DG, Wu AR, Neff NF, Mantalas GL, Espinoza FH, Desai TJ, Krasnow MA, Quake SR. Reconstructing lineage hierarchies of the distal lung epithelium using single-cell RNA-seq. Nature. 2014;509:371–375. doi: 10.1038/nature13173. [DOI] [PMC free article] [PubMed] [Google Scholar]
- Tropepe V, Sibilia M, Ciruna BG, Rossant J, Wagner EF, van der Kooy D. Distinct neural stem cells proliferate in response to EGF and FGF in the developing mouse telencephalon. Developmental biology. 1999;208:166–188. doi: 10.1006/dbio.1998.9192. [DOI] [PubMed] [Google Scholar]
- van de Leemput J, Boles NC, Kiehl TR, Corneo B, Lederman P, Menon V, Lee C, Martinez RA, Levi BP, Thompson CL, et al. CORTECON: a temporal transcriptome analysis of in vitro human cerebral cortex development from human embryonic stem cells. Neuron. 2014;83:51–68. doi: 10.1016/j.neuron.2014.05.013. [DOI] [PubMed] [Google Scholar]
- Vierbuchen T, Ostermeier A, Pang ZP, Kokubu Y, Sudhof TC, Wernig M. Direct conversion of fibroblasts to functional neurons by defined factors. Nature. 2010;463:1035–1041. doi: 10.1038/nature08797. [DOI] [PMC free article] [PubMed] [Google Scholar]
- Zeisel A, Munoz-Manchado AB, Codeluppi S, Lonnerberg P, La Manno G, Jureus A, Marques S, Munguba H, He L, Betsholtz C, et al. Brain structure. Cell types in the mouse cortex and hippocampus revealed by single-cell RNA-seq. Science. 2015;347:1138–1142. doi: 10.1126/science.aaa1934. [DOI] [PubMed] [Google Scholar]
- Zhang B, Horvath S. A general framework for weighted gene co-expression network analysis. Stat Appl Genet Mol Biol. 2005;4:Article17. doi: 10.2202/1544-6115.1128. [DOI] [PubMed] [Google Scholar]
Associated Data
This section collects any data citations, data availability statements, or supplementary materials included in this article.