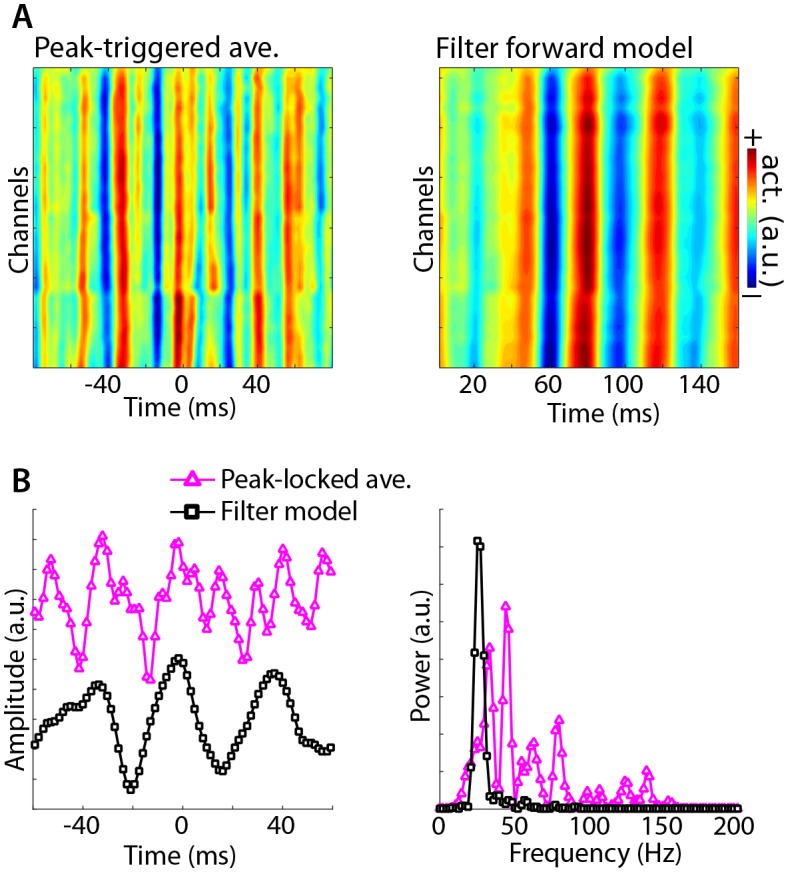
Figure 8. Illustration of Method 4 applied to empirical data from rodent hippocampus.

GED was used to identify a theta component (peak frequency 8 Hz), and peak times were identified. (A) illustrates the peak-triggered LFP trace over 32 channels (high-pass filtered at 20 Hz), and the forward model of the first gedCFC component. (B) illustrates the peak-locked average and the component model, averaged over all channels, in the time domain (left panel) and in the frequency domain (right panel). Amplitudes were scaled and y-axis-shifted for comparability.
