. 2017 Jan 16;6:e21510. doi: 10.7554/eLife.21510

Figure 1. Crystal structure of Prp43 in complex with U7-RNA and the ATP-analog ADP•BeF3-.

(a) Domain overview of ctPrp43. The bottom bar indicates the N-terminally truncated construct (ΔN, 61–764) used for crystallization. (b) Overall structure of ctPrp43ΔN•U7•ADP•BeF3-. Domains are colored according to a and the bound U7-RNA is shown in gray with two alternative conformations for nucleotides U1-U3. The ADP•BeF3- is bound in the cleft between the RecA domains. (c) Close-up of the bound U7-RNA. Residues involved in interactions are labeled according to the wild-type ctPrp43 sequence. The 5’ and 3’ end of the RNA is indicated. (d) Cross-section of the Prp43 RNA-binding tunnel. Prp43 is shown in surface representation and the RNA in ball-and-sticks mode. (e) Schematic figure of the Prp43-RNA interactions. Residues which interact with the RNA via their main chain are shown as triangles and residues which exhibit side chain interactions are presented as ellipses. The coloring of the residues corresponds to a. The alternative conformation of the first three nucleotides is shown light gray. Stacking interactions are highlighted by double lines and polar interactions by dotted lines.

DOI: http://dx.doi.org/10.7554/eLife.21510.002

Figure 1.

Figure 1—figure supplement 1. Omit maps of a fraction of the U7-RNA from the ctPrp43ΔN•U7•ADP•BeF3- complex structure and of the active site of ctPrp43ΔN•ADP•BeF3-(HR) (Figure 2a).

Figure 1—figure supplement 1.

(a) |Fo-Fc| omit map of nucleotides U3-U7 at 3σ level. The complete RNA molecule was omitted for map calculation. Coloring according to Figure 1a. (b) The ADP•BeF3-, the Mg2+ ion and five water molecules at the active site were omitted during map calculation. The |Fo-Fc| map is shown at 3σ. Coloring according to Figure 6a.
Figure 1—figure supplement 2. The two alternative conformations of the U7-RNA in the ctPrp43ΔN•U7•ADP•BeF3- complex structure.

Figure 1—figure supplement 2.

Coloring according to Figure 1a. Nucleotides U1-U3 are present in two alternative conformations (A and B) which exhibit after crystallographic refinement an occupancy of 54% and 46%, respectively. The first nucleotide of each conformation is labeled.
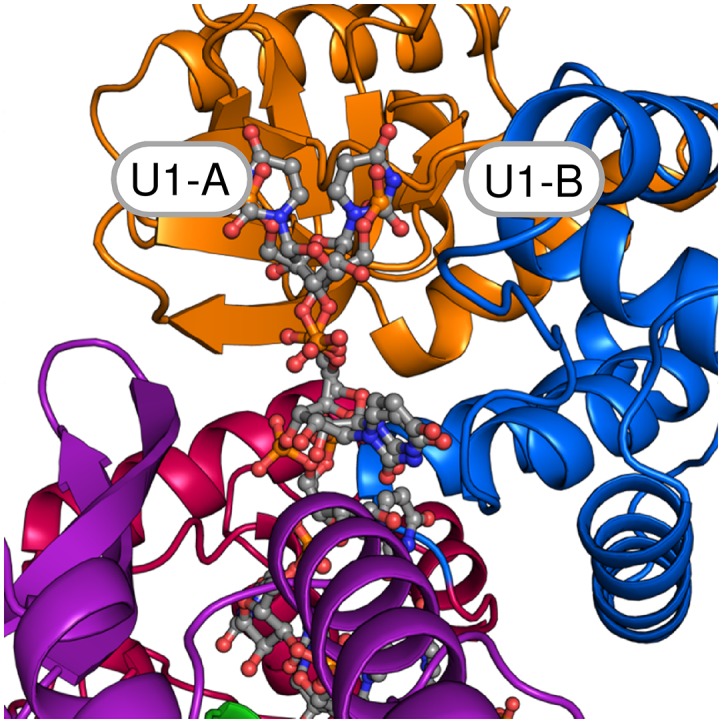
Figure 1—figure supplement 3. Overview of the B-factors of the U7-RNA in the ctPrp43ΔN•U7•ADP•BeF3- complex structure.

Figure 1—figure supplement 3.

B-factors of the bound RNA range from 37 to 159 Ų. The B-factors of U1 to U3 are clearly elevated compared to U4 to U7.
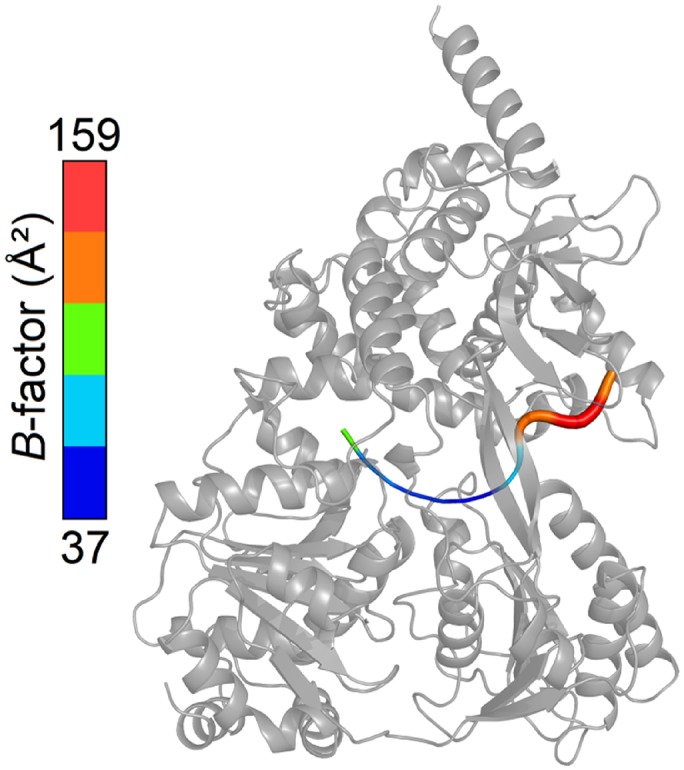
Figure 1—figure supplement 4. Schematic representation of the NS3 HCV- and MLE-RNA interaction networks.

Figure 1—figure supplement 4.

(a) Interactions between NS3 HCV•ADP•BeF3- (PDBid: 3o8r) and the bound U8-RNA are shown. Polar interactions are presented as dotted lines and stacking interactions as double lines. Residues which interact via their main chain are depicted as triangles and residues which interact with their side chain are shown as ellipses. RecA1 domain residues are labeled in green, RecA2 residues in purple and Domain 3 residues in blue. The 5’ and 3’ end of the RNA is labeled according to convention. Structurally conserved interactions (SCI) between main chain amides and the RNA which are also present in Prp43 are indicated as well as the conserved threonine side chain interactions from motif Ib and V. (b) Depiction of the MLE•ADP•AlF4- (PDBid: 5aor) and U10-RNA interaction network. Residues from the RecA1 are shown in green, RecA2 residues in purple, ratchet-like domain residues in blue and residues which are located in the OB-fold are presented in orange. Abbreviations were used as introduced in a. The first three nucleotides (U1–U3) present in the crystal structure of MLE were omitted in this figure, since these interactions are neither conserved in Prp43 nor in NS3 HCV.