Summary
The group A streptococcus (GAS, Streptococcus pyogenes) is a Gram-positive human pathogen that must adapt to unique host environments in order to survive. Links between sugar metabolism and virulence have been demonstrated in GAS, where mutants in the phosphoenolpyruvate-dependent phosphotransferase system (PTS) exhibited Streptolysin S (SLS)-mediated hemolysis during exponential growth. This early onset hemolysis correlated with an increased lesion size and severity in a murine soft tissue infection model when compared to parental M1T1 MGAS5005. To identify the PTS components responsible for this phenotype, we insertionally inactivated the 14 annotated PTS EIIC-encoding genes in the GAS MGAS5005 genome and subjected this library to metabolic and hemolysis assays to functionally characterize each EIIC. We found that a few EIIs had a very limited influence on PTS sugar metabolism, whereas others were fairly promiscuous. The mannose-specific EII locus, encoded by manLMN, was expressed as a mannose-inducible operon that exhibited the most influence on PTS sugar metabolism, including mannose. Importantly, components of the mannose-specific EII also acted to prevent the early onset of SLS-mediated hemolysis. Interestingly, these roles were not identical in two different M1T1 GAS strains, highlighting the possible versatility of the PTS to adapt to strain-specific needs.
Keywords: Mannose, Enzyme II, Streptolysin S, GAS, PTS, Hemolysis
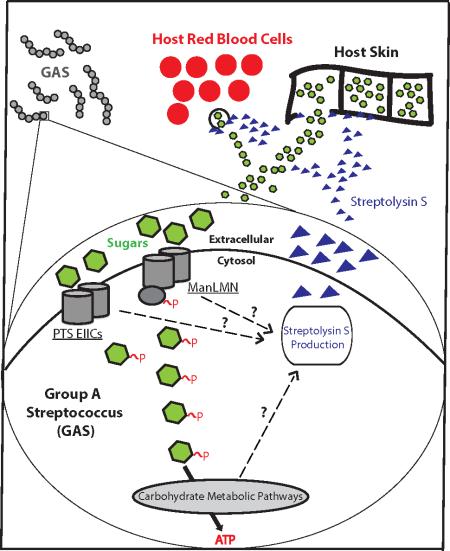
Graphical Abstract
Several sugar transporters (Enzyme IICs, EIIC) contribute to the timely expression of the toxin Streptolysin S (SLS), and are redundant for the transport of sugars. The Mannose-specific EII plays an important role in GAS for both PTS carbohydrate metabolism and Streptolysin S expression, potentially allowing for GAS to extract nutrients from the host in order to survive. Black dashed arrows represent the influence of EIIs and other components of carbon metabolism on SLS production.
Introduction
Human pathogens must be able to adapt to challenges found in their host (e.g., immunity, nutrients, etc) in order to survive and propagate. Thus, many microbes have developed extensive networks of factors that are used to evade the host immune system and obtain carbon sources during early stages of infection. Microbes must then coordinately express these virulence factors based on the specific requirements of a given environmental niche. Carbohydrates are abundant in human tissues, act as an important carbon source for bacterial pathogens, and can act as a signal for microbes to elicit different pathogenic responses. For example, Salmonella enterica uses L-arabinose to modulate the expression of genes in the Salmonella pathogenicity island 1, encoding a Type 3 secretion system critical during systemic infection (López-Garrido et al., 2015). Even many fungal pathogens rely on carbohydrate metabolic pathways (trehalose in particular) for survival in different hosts (Tournu et al., 2013, Foster et al., 2003, Lowe et al., 2009, Petzold et al., 2006, Ngamskulrungroj et al., 2009). Thus, microbial pathogens have developed ways to connect carbohydrate availability and metabolism in the host with overall pathogenesis.
The phosphoenolpyruvate-dependent phosphotransferase system (PTS) is a carbohydrate transport system present in most bacteria that couples the translocation of an incoming sugar with its subsequent phosphorylation (Deutscher et al., 2006). The PTS is split into two sets of proteins, with the first being the general cytosolic proteins, Enzyme I (EI) and HPr that are common to all PTS carbohydrates. The second set of PTS proteins are multiple sugar-specific Enzyme II (EII) complexes composed of two cytosolic components (EIIA and EIIB), as well as one or two membrane transporters (EIIC and EIID) (Shelburne et al., 2008b). To date, EIID components have only been found associated with Mannose-family EII systems (Zuniga et al., 2005). The PTS phosphorelay begins when EI is autophosphorylated at the expense of phosphoenolpyruvate (PEP), which will then phosphorylate HPr on its Histidine-15 residue. HPr then phosphorylates EIIA, which will phosphorylate EIIB, and the phosphate is then transferred to the incoming sugar transported by EIIC/D (Deutscher et al., 2006). The PTS also participates in signal transduction through the actions of EIIs and HPr. In the presence of a preferred carbon source, such as glucose, HPr kinase (HprK) will phosphorylate HPr on its Serine-46 residue. HPr-Ser~P, in conjunction with the carbon catabolite protein A (CcpA), elicits carbon catabolite repression (Deutscher et al., 2006). In the absence of an inducing sugar source, EIIB components can phosphorylate PTS-regulatory domains found within several transcriptional regulators, thereby changing their activity (Deutscher et al., 2006) and allowing the PTS to potentially influence the expression of a wide variety of genes.
Several PTS EII complexes are known to be important for the pathogenic processes for Gram-positive pathogens (Pridgeon et al., 2013, McAllister et al., 2012, Shelburne et al., 2008b, Iyer & Camilli, 2007). The mannose-specific EII, composed of ManL (EIIAB), ManM (EIIC) and ManN (EIID), repeatedly appears to play important roles in pathogenesis, leading to the suggestion that it helps facilitate bacterial residence in animals (Zuniga et al., 2005). Mannose-family EII complexes can have broad substrate specificities, making them potential candidates to influence pathogenesis by incorporating numerous nutritional inputs and acting as a sensor to induce other metabolic operons (Fleming & Camilli, 2016). In Streptococcus mutans, ΔmanL strains are not able to form biofilms in the presence of glucose, show reduced competency, and reduced acid tolerance (Abranches et al., 2006). Interestingly, the mannose-specific EII is actually the target for class IIa bacteriocins, highlighting the importance of carbohydrate metabolism to the survival of microbes in the host (Kjos et al., 2011). Therefore, PTS EII complexes have the potential to play important virulence roles in streptococcal pathogens.
Streptococcus pyogenes (Group A Streptococcus, GAS) normally colonizes the nasopharyngeal mucosa or the skin of its only known host, humans (Cunningham, 2000). These superficial infections can be treated with antibiotics, and are generally self limiting, although they can lead to the development of post-infection autoimmune sequelae. However, there are a number of serotypes that are able to access sterile sites via the bloodstream, leading to more invasive infections. This can lead to the development of life-threatening infections such as necrotizing fasciitis and streptococcal toxic shock syndrome (STSS), and post-infection autoimmune sequelae such as acute rheumatic fever (Cunningham, 2000). Neurological disorders, such as Tourette's, and pediatric autoimmune neuropsychiatric disorders associated with streptococcal infections (PANDAS), have also been associated with streptococcal infections (Esposito et al., 2014). Invasive GAS infections and sequelae are responsible for over 500,000 deaths worldwide every year (Carapetis et al., 2005).
Carbohydrate metabolism has been implicated in the pathogenesis of GAS with several PTS carbohydrate metabolic operons found to be important for GAS survival in human blood and blood related stresses (Valdes et al., 2016, Le Breton et al., 2013, Sachla et al., 2014). Our previous work showed that a PTS null mutant (ΔptsI) in the M1T1 GAS strain MGAS5005 resulted in an increased size and severity of lesions at the site of infection in a murine soft tissue infection model due to the early onset of expression and activity of Streptolysin S (SLS) during growth (Gera et al., 2014). However, the contribution of individual sugar-specific EII components in this link to virulence was not explored. In fact, the annotation of sugar-specific EII complexes in sequenced GAS genomes have seldom been experimentally verified. EII genes are often incorrectly annotated based on homology alone, exemplified by the initially annotated glucose-specific malT locus in M1 GAS that was shown experimentally to transport maltose (Shelburne et al., 2008b). In this study, we insertionally inactivated each predicted EIIC transporter gene present in the M1T1 MGAS5005 genome in order to characterize their metabolic profile and determined the EII complex that contribute to the early expression of SLS observed in the ΔptsI mutant. We identified the mannose-specific EII encoded by manLMN as an important EII that displayed a wide influence on sugar metabolism. Inactivation of this Mannose-family EII contributed to the early onset of SLS activity, and increased lesion severity in a strain specific manner.
Results
A PTS EIIC mutant library in M1T1 GAS MGAS5005 reveals redundancy of transporters for growth on PTS carbohydrates
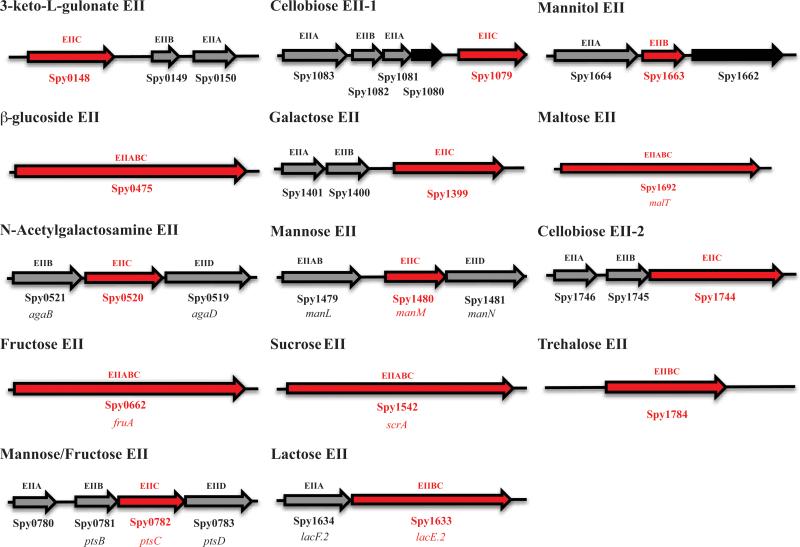
Although the PTS-specific carbohydrates necessary for growth of the M1T1 GAS strain MGAS5005 have been determined using a ΔptsI (EI) mutant (Gera et al., 2014), the sugar-specificities of each annotated PTS EII locus have not been experimentally validated on a comprehensive scale. Here, we insertionally inactivated the gene encoding the EIIC transporter within all 14 annotated EII loci in the M1T1 MGAS5005 genome to establish their individual sugar specificities (Fig. 1). Each mutation is polar, so an effect on the expression of downstream genes is possible. The annotated mannitol-specific EII locus (Spy_1664/Spy_1663) lacked a gene encoding an EIIC subunit; therefore, the EIIB gene was mutagenized instead (Fig. 1). As a control, each validated mutant was rescued back to the wild type genotype (see Experimental Procedures).
Figure 1. Predicted PTS EII loci present in the GAS M1T1 MGAS5005 annotated genome.
Genes encoding EII subunits are indicated in grey and hypothetical proteins are indicated in black. Sugar specificities are provided based on annotation. EIIC genes encoding sugar transporters targeted for mutagenesis are highlighted in red. When known, gene names are listed below Spy number. The two annotated cellobiose EII loci are labeled as 1 and 2 based on their order in the genome.
To confirm the PTS carbohydrates utilized by wild type (WT) MGAS5005, it was grown in chemically defined medium (CDM) with a given PTS carbohydrate as the sole carbon source (see Experimental Procedures). MGAS5005 only grew on 8 of the 11 established PTS carbohydrates (Gera et al., 2014) (Fig. S1A); therefore, the 3 sugars not supporting growth of the wild type MGAS5005 (e.g., cellobiose, galactose, and mannitol) were eliminated from further analysis (Fig. S1B). Although ascorbic acid was not known to be a PTS carbohydrate for GAS, a recent study found that the 3-keto-L-gulonate-specific EIIC (Fig. 1; Spy_0148) might actually transport ascorbic acid (Afzal et al., 2015). In support of this, the MGAS5005.ΔptsI mutantexhibited impaired growth compared to WT MGAS5005 in CDM + 1% ascorbic acid, indicating it is indeed a PTS-dependent carbohydrate for GAS (Fig. S1C).
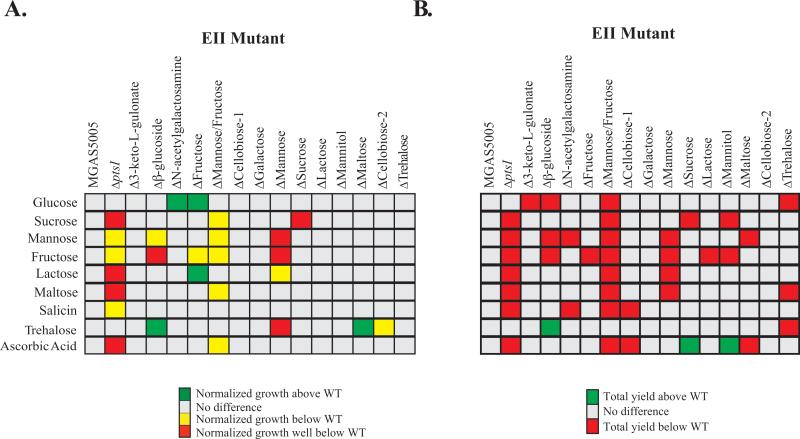
The MGAS5005 EIIC mutant library was then compared to WT MGAS5005 grown in CDM with each of the 9 PTS carbohydrates determined above (Fig. 2 and Fig. S2A-S2N). Six of the EIIC mutants (Fig. 1; Δ3-keto-L-gulonate, ΔCellobiose-1, ΔGalactose, ΔLactose, ΔMannitol, ΔTrehalose) grew comparable to MGAS5005 in all PTS carbohydrates tested (Fig. 2A, all clear boxes). Four EIIC mutants (Fig. 1; Δβ–glucoside, ΔN-acetylgalactosamine, ΔFructose, ΔMaltose) grew better than MGAS5005 in at least one PTS carbohydrate (Fig. 2A, green boxes). In addition, four EIIC mutants (Fig. 1; Δβ–glucoside, ΔFructose, ΔMannose/Fructose, ΔMannose) exhibited altered growth compared to MGAS5005 in more than one carbohydrate (Fig 2A, yellow/red/green boxes). Only the ΔSucrose EIIC mutant showed altered growth only in the carbohydrate for which it was annotated to transport, strongly indicating redundancy for transport of any given sugar (Fig. 2A). In fact, salicin, maltose, and ascorbic acid, were the only PTS carbohydrates tested that didn't show a significa nt defect in more than one EII mutant (Fig. 2A). Surprisingly, 2 EIIC mutants (ΔN-acetylgalactosamine, ΔFructose) showed increased growth profiles in glucose as compared to MGAS5005, which was unexpected given that the MGAS5005.ΔptsI mutant lacking PTS signaling grows comparable to WT in glucose (Fig. 2A).
Figure 2. Growth profiles of the PTS EII mutant library in MGAS5005.
(A) Normalized growth analyses were performed as fully described in Experimental Procedures. Growth in a particular PTS sugar of the mutant above WT (2 fold, green), below WT (2 fold, yellow), well below WT (>2 fold, red), or similar to WT (Grey) are indicated. (B) Total yield (ΔOD) was calculated as described in Experimental Procedures. ΔOD of mutants in a particular PTS sugar that were above WT (green, p-value <0.05) or below WT (red, p-value <0.05) are indicated. Only PTS sugars facilitating growth of MGAS5005 are shown. All results represent at least three independent biological replicates.
Total yield (ΔOD600) after 24 h of growth was used as another indicator of the impact of each EIIC on growth in PTS carbohydrates (Fig. 2B and Fig. S3A-I). Only two EIIC mutants (ΔGalactose, ΔCellobiose-2) exhibited the same total yield as WT MGAS5005 in every PTS carbohydrate tested. Overall, most of the EIIC mutants grew to a different yield than MGAS5005 in multiple PTS carbohydrates, again suggesting that there is an inherent redundancy among the EIIs for carbohydrate transport. This is further supported by the fact that reductions in total yield of many EIIC mutants showed intermediate phenotypes, instead of a total loss of growth, which is not indicative of a system where a given transporter was responsible for a single carbohydrate transport (Fig. 2B).
Carbohydrate utilization by the MGAS5005 PTS EIIC mutant library also supports redundancy in transport of PTS sugars
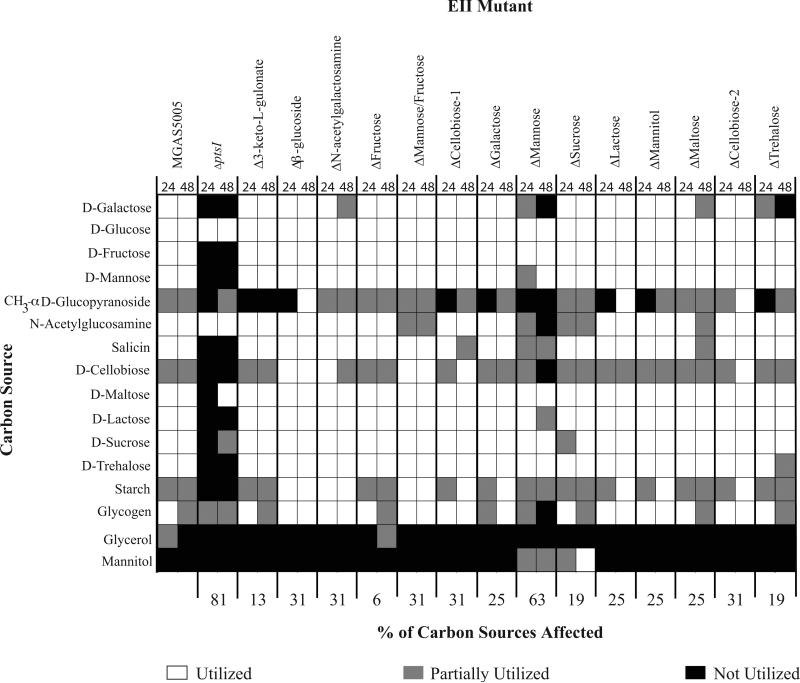
To ascertain if the growth phenotypes seen with the EIIC mutants were the result of altered uptake and metabolism of specific carbohydrates, the library was assayed for utilization of 49 different carbon sources using a BioMerieux API® 50 CH panel. This system detects changes in pH in the presence of each given carbon source as a sensitive readout for metabolic utilization, but does not require growth (see Experimental Procedures). As expected, MGAS5005.ΔptsI was unable to utilize most (81%) of the carbon sources metabolized by MGAS5005 (Fig. 3). Although overall growth in mannose, fructose, and trehalose were altered in several EIIC mutants (Fig. 2), utilization of these carbohydrates was largely unaffected (Fig. 3). As with the growth assays, overlap was evident among the EIIC loci for their ability to transport and utilize multiple PTS carbohydrates. Moreover, there appears to be significant interplay between different carbohydrate utilization pathways, as 10/14 of the EIIC mutants alter utilization of at least 25% of the carbohydrates tested (Fig. 3). Although neither of the 2 Cellobiose EIIC mutants (Fig. 1) had an extensive effect on the growth of GAS on PTS carbohydrates, these EIIC mutants showed the second largest effect on carbon utilization (31%), along with ΔMannose/Fructose and Δβ-Glucoside (Fig. 3). Finally, the mannose-specific EII mutant had the largest effect of carbon utilization (Fig. 3).
Figure 3. Carbohydrate utilization profile of the PTS EIIC mutant library in MGAS5005.
Utilization of select carbon sources as determined using the API®50CH system as described in Experimental Procedures. Only carbon sources that are utilized by at least one of the strains tested are shown. White boxes indicate utilization (+), grey boxes indicate partial utilization (+/−), and black boxes indicate no utilization (−). Readings for each strain are given for 24h (left box) and 48h (right box).
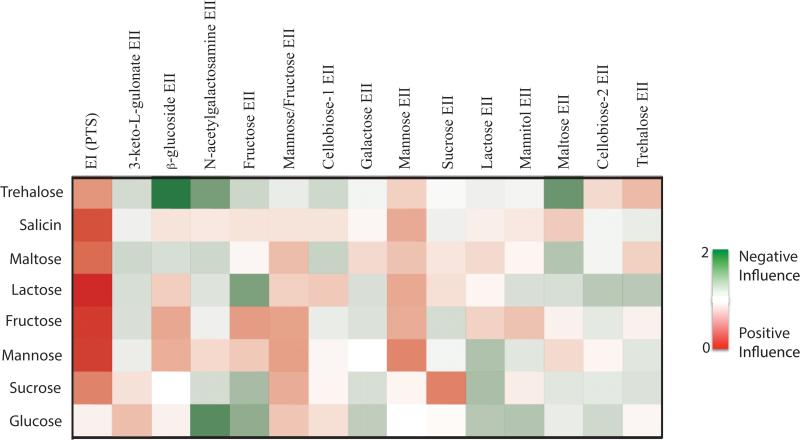
To represent the overall effect of an EIIC on the metabolism of PTS carbohydrates by GAS, we developed an Influence Score (Fig. 4), an arbitrary measure that combines both the growth and utilization data for each EIIC mutant to provide a visual representation of the overall impact of an EIIC protein on the metabolism of a PTS carbohydrate. An EIIC would show a positive influence (red) if its mutation resulted in a growth defect and/or inefficient utilization of a PTS carbohydrate compared to WT MGAS5005. In contrast, an EIIC would have a negative influence (green) if its mutation resulted in a growth/utilization profile above that of WT. Only PTS carbohydrates found in both the growth and utilization assays (Fig. 2 and 3) were used in determining the Influence Score and intensity of color reflects the relative impact. As expected, the complete PTS strongly influences the metabolism of all the PTS carbohydrates except for glucose (Fig. 4). Although there are certain instances where an EII has a strong influence on the metabolism of a given carbohydrate (i.e., Sucrose EII on sucrose), most of the EII complexes have an intermediate to minor influence on the metabolism of several carbohydrates; supporting redundancy among the EIIC systems in MGAS5005 for the transport and utilization of PTS carbohydrates (Fig. 4).
Figure 4. Influence of each EII on the metabolism of PTS carbohydrates.
Heat map of the relative influence of each EII on growth in a particular PTS sugar (Influence Score) was calculated as described in Experimental Procedures. Green indicates a negative influence of an EII for the metabolism of a PTS sugar, red indicates a positive influence of an EII for the metabolism of a PTS sugar, and white indicates no influence. Relative influence is reflected by intensity of color.
Multiple EIIC proteins contribute to the PTS-related growth phase expression of sagA and hemolytic activity in MGAS5005
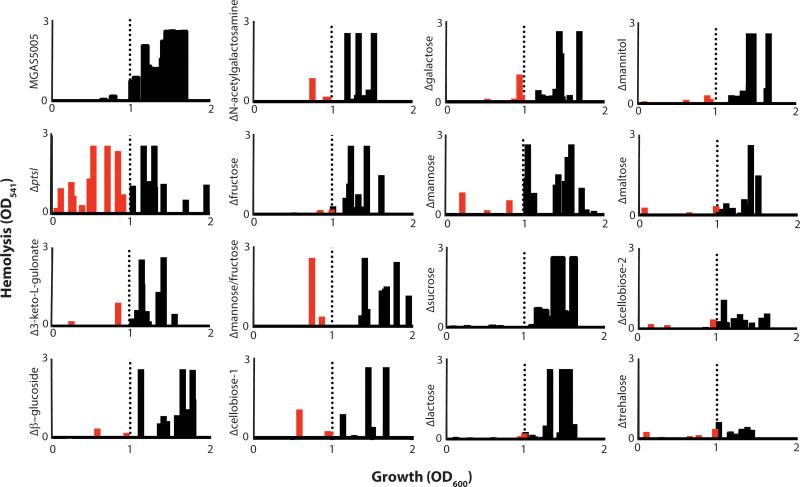
We previously found that a PTS-defective MGAS5005.ΔptsI mutant expressed sagA and produced Streptolysin S-mediated hemolytic activity much earlier in growth than WT MGAS5005, leading to increased lesion size and severity in a murine model of GAS soft tissue infection (Gera et al., 2014). Since the PTS is a carbohydrate transport system, we hypothesized that one or several specific EIIC mutants may contribute to the MGAS5005.ΔptsI hemolysis phenotype due to the reduced ability to metabolize specific carbohydrates. Thus, we assayed the onset of hemolysis for each of the EIIC mutants compared to WT MGAS5005 and the PTS-null MGAS5005.ΔptsI mutant (see Experimental Procedures). Hemolysis activity of cell-free supernatants was determined for each strain across growth and the results displayed as a hemolytic profile showing the occurrence of significant activity (OD541 > 0.2) on the Y-axis versus growth (OD600) on the X-axis (Fig. 5). WT MGAS5005 produces high levels of secreted hemolytic activity only at transition to stationary phase (OD600 ≥ 1.0; Fig. 5, black bars) whereas the PTS mutant showed high levels early in exponential phase and across growth (Fig. 5, red and black bars), as previously shown (Gera et al., 2014). Seven EIIC mutants (Δ3-Keto-L-Gulonate, Δβ-Glucoside, ΔN-Acetylgalactosamine, ΔMannose/Fructose, ΔCellobiose-1, ΔGalactose, ΔMannose,) exhibited at least one early time point with an appreciable amount of hemolysis (Fig. 5, red bars). However, no individual EIIC mutant fully recapitulated the hemolytic profile of the PTS mutant (Fig. 5). We conclude from these data that multiple PTS EIIC mutants combine to produce the early onset hemolysis phenotype observed in the MGAS5005.ΔptsI mutant. Of note, the ΔTrehalose and ΔCellobiose-2 EIIC mutants produced significantly lower hemolysis over all of growth compared to WT MGAS5005 or any of the other mutants, although the reason for this is unknown (Fig. 5). Three of the seven EIIC mutants found to produce early onset hemolytic activity were homologous to Mannose-family PTS transporters.
Figure 5. Hemolysis profile of the EII mutant library in MGAS5005.
Hemolytic activity of culture lysates against red blood cells (RBCs) was assayed as described in Experimental Procedures. Data from three biological replicates is shown comparing occurrence of hemolysis (defined as OD541 > 0.2) on the X-axis and the relative level of hemolytic activity observed on the Y-axis. Hemolysis at an OD600 above 1 was considered normal based on WT MGAS5005 (black bars to right of dotted line). Occurrence of hemolysis was noted as early if it occurred before OD600 of 1 (red bars left of dotted line).
Mannose-family EIIC loci exhibit the broadest impact on the metabolism of PTS carbohydrates and influence hemolysis in MGAS5005
Mannose-family members of bacterial EIIC proteins are known to transport the widest range of substrates compared to other PTS EIIC transporters (Zuniga et al., 2005). Of the 14 EIIC mutants tested in our MGAS5005 library, only ΔMannose and ΔMannose/Fructose (Fig. 1) showed growth defects and total yields below or significantly below WT in at least four different PTS carbohydrates (Fig. 2AB). Of the two, the mannose EIIC (manM) exhibited the greatest influence over carbon utilization of any other PTS system, with 63% of carbon sources displaying altered utilization patterns in the ΔMannose mutant compared to MGAS5005 (Fig. 3). Although ΔN-acetylgalactosamine represents a third mannose family EIIC present in the MGAS5005 genome (Fig. 1), it only impacted one to two substrates for growth and utilization. Therefore, the Mannose and the Mannose/Fructose EIIC transporters have the broadest impact on the metabolism of PTS sugars in MGAS5005 (Fig. 4), suggesting their central role in the GAS physiology. Since ΔMannose (Fig. 1, manM) had the greatest influence on PTS carbohydrate metabolism, we decided to further examine its role in GAS physiology and virulence.
manLMN forms an operon that is induced in the presence of mannose
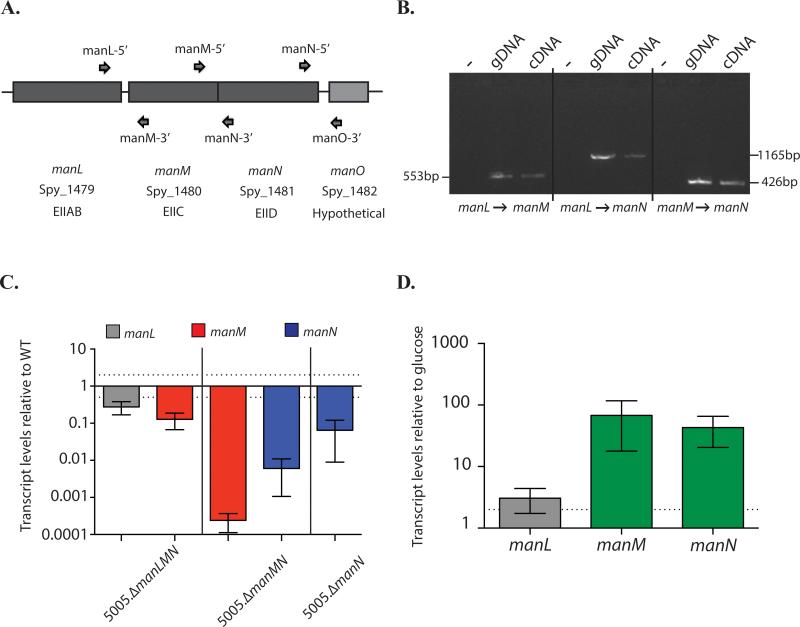
The mannose-specific EII is made up of three distinct subunits: EIIAB (manL, cytosolic), EIIC (manM, membrane transporter), and an EIID (manN, membrane transporter exclusive to Mannose-family EII systems) (Fig. 6A). The transcriptional architecture of manLMN was interrogated using RT-PCR to determine if these genes are expressed as an operon, using the primers as shown in Fig 6A. At the end of the predicted operon is a gene (manO) encoding a hypothetical protein; however, only manLMN were found to be co-transcribed (Fig 6B, data not shown). As a result, insertional inactivation mutants of the manL and manM, would be expected to be polar, affecting the expression of the downstream operon genes (Fig 6C). Since this EII is annotated as mannose-specific, we hypothesized that the expression of manLMN should be induced in the presence of mannose. As expected, manM and manN are both induced when MGAS5005 is grown in CDM + 1% mannose as compared to growth in glucose (Fig. 6D). manL is not as highly induced as manM and manN when MGAS5005 is grown in mannose (Fig. 6D), suggesting the presence of a second promoter between manL and manM that is more highly induced in the presence of mannose.
Figure 6. Transcriptional architecture of the mannose PTS EII operon.
(A) Graphical representation of the mannose-specific EII genetic locus. Primers for RT-PCR are also shown (arrows) (B) RT-PCR was performed on RNA isolated from MGAS5005 grown to late-logarithmic phase in THY using primers in gene pairs as indicated below. Bands indicate genes are transcribed together. (C) Polarity of each mannose EII subunit was assessed using qPCR. Primers are located in the middle of each gene. (D) Induction of the mannose operon when GAS is grown in mannose was determined. RNA was isolated in MGAS5005 grown in glucose and mannose, and relative transcript levels were compared using qPCR. Each bar is the average of 3 independent biological replicates, depicted with the standard error. Dotted lines represent 2 fold difference in expression.
The mannose-specific EII subunits have varying influences on the metabolism of PTS carbohydrates in different M1T1 strains
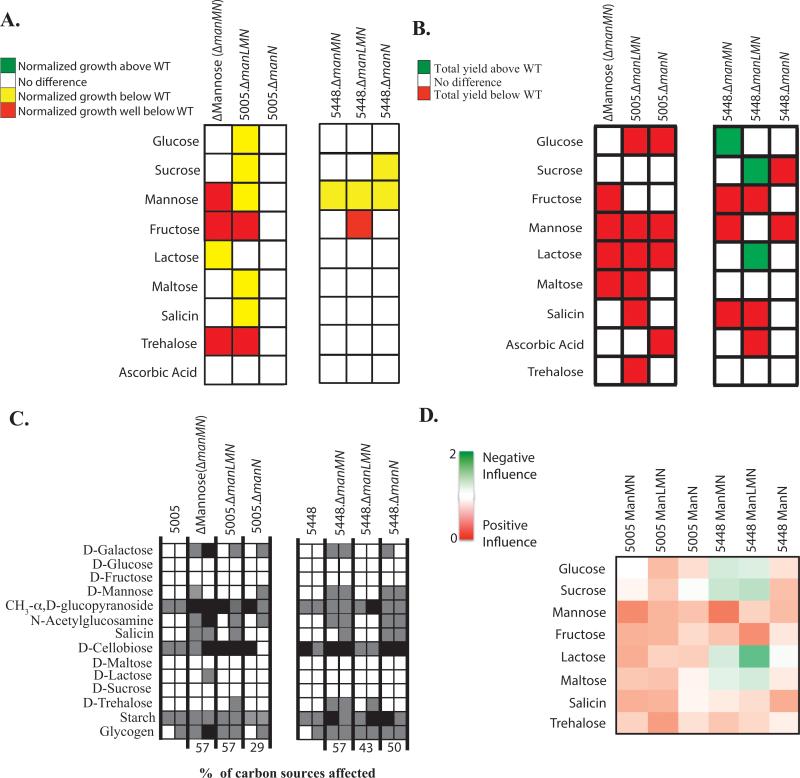
The mannose-specific EII subunit mutants in MGAS5005 were assayed for their individual influence on the metabolism of PTS sugars. Since the EIIC ManM was established earlier as a promiscuous transporter (Fig. 2-4), we were interested to see if this was consistent for the EIIAB and EIID subunits as well. Surprisingly, MGAS5005.ΔmanLMN did not grow comparable to WT MGAS5005 in glucose, sucrose, maltose, and salicin, despite having no such phenotype in the ΔMannose EIIC mutant (Fig. 2 and 7A). MGAS5005.ΔmanLMN grew in lactose similar to WT, which was not the case for the ΔMannose EIIC mutant. However, both strains did have a reduced total yield in lactose (Fig. 7AB). MGAS5005.ΔmanN had no effect on the overall growth of GAS in PTS carbohydrates, but did affect the total yield in 4 PTS carbohydrates. Of these, the only sugar that is specific to ManN was ascorbic acid (Fig. 7AB). As expected, total yield in mannose was affected in all three mutant strains, further validating this EII as mannose-specific (Fig. 7B).
Figure 7. Metabolic profile of the mannose EII subunit mutants.
(A) Growth curve analyses were performed as fully described in Experimental Procedures for manLMN mutants in 5448 (right) or MGAS5005 (left). Growth in a particular PTS sugar of the mutant above WT (green), below WT (yellow), significantly below WT (red), or similar to WT (white) are indicated. (B) Change in growth (ΔOD) of manLMN mutants was calculated as described in Experimental Procedures. ΔOD of mutants in a particular PTS sugar that were significantly above WT (green, p-value <0.05) or below WT (red, p-value <0.05) are indicated. Only PTS sugars facilitating growth of MGAS5005 are shown. All results represent at least three independent biological replicates. (C) Utilization of select carbon sources by manLMN mutants as determined using the API®50CH system and described in Experimental Procedures. Only carbon sources that are utilized by at least one of the strains tested are shown. White boxes indicate utilization (+), grey boxes indicate partial utilization (+/−), and black boxes indicate no utilization (−). Readings for each strain are given for 24h (left box) and 48h (right box). (D) Heat map of the relative influence of manLMN mutants on growth in a particular PTS sugar (Influence Score) was calculated as described in Experimental Procedures. Green indicates a negative influence of an EII for the metabolism of a PTS sugar, red indicates a positive influence of an EII for the metabolism of a PTS sugar, and white indicates no influence. Relative influence is reflected by intensity of color.
In contrast, the same manL, manM, and manN mutants introduced into another M1T1 strain, 5448 (covS+), had a different influence on the metabolism of PTS carbohydrates. 5448.ΔmanMN and 5448.ΔmanLMN had altered growth in fewer PTS carbohydrates than their respective counterparts in the covS-deficient MGAS5005 (Fig. 7A). In fact, 5448.ΔmanMN and 5448.ΔmanLMN grew better in 3 PTS carbohydrates, indicating that ManL and ManM negatively influence the metabolism of these carbohydrates by an unknown mechanism (Fig. 7B). In addition, although both sets of mutants in MGAS5005 and 5448 appear to influence the utilization of the same number of carbon sources, they do vary in the degree in which they affect utilization (Fig. 7C). MGAS5005 mannose-specific EII components had a largely positive influence on PTS sugar metabolism, whereas these proteins in 5448 exhibited either a positive or negative influence, depending on the specific sugar (Fig. 7D). Overall, the influence of ManL, ManM, and ManN on the metabolism of PTS carbohydrates varied between M1T1 GAS strains and suggests a versatile EII that may adapt to the specific needs of the individual genetic background.
ΔMannose EIIC induces hemolysis early in growth, although ManL and ManN contribute in a strain-specific manner
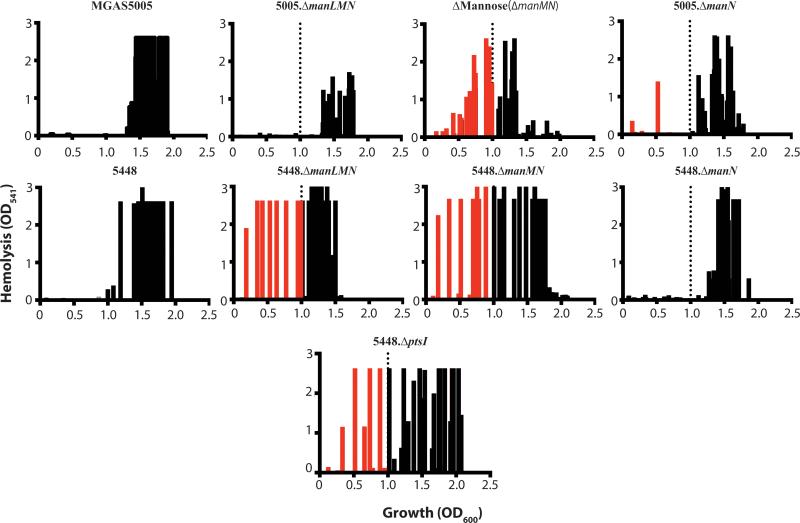
The individual subunits of the mannose-specific EII complex (ManLMN) were interrogated for their role in early onset of hemolysis. In order to more accurately profile the point of growth where hemolysis began for each of the mutants, supernatants from samples taken every 20 minutes were tested. In MGAS5005, early hemolysis was observed in the ΔMannose EIIC mutant, as expected from the initial screen in the EII mutant library, and slightly in MGAS5005.ΔmanN. The overall level of hemolysis in MGAS5005.ΔmanLMN was relatively lower compared to WT MGAS5005, which was not the case for 5448.ΔmanLMN compared to WT 5448. Although 5448.ΔmanMN also exhibited the early hemolytic activity, 5448.ΔmanN presented hemolytic profile similar to 5448 and different from that observed for the same mutant in MGAS5005 (Fig. 8). Therefore, ManM plays a consistent role in the regulation of growth-phase dependent expression of SLS; however the contribution of ManL and ManN to this phenotype appears to be strain specific.
Figure 8. Hemolytic activity of the mannose EII subunit mutants.
Hemolytic activity of culture lysates against red blood cells (RBCs) for manLMN mutants in 5448 and MGAS5005 was assayed as described in Experimental Procedures. Data from three biological replicates is shown comparing occurrence of hemolysis (defined as OD541 > 0.2) on the X-axis and the relative level of hemolytic activity observed on the Y-axis. Hemolysis at an OD600 above 1 was considered normal based on WT 5448 or MGAS5005 (black bars to right of dotted line). Occurrence of hemolysis was noted as early if it occurred before OD600 of 1 (red bars left of dotted line).
Contribution of ManMN (EIICD) to the pathogenesis of M1T1 MGAS5005 in a soft tissue infection model
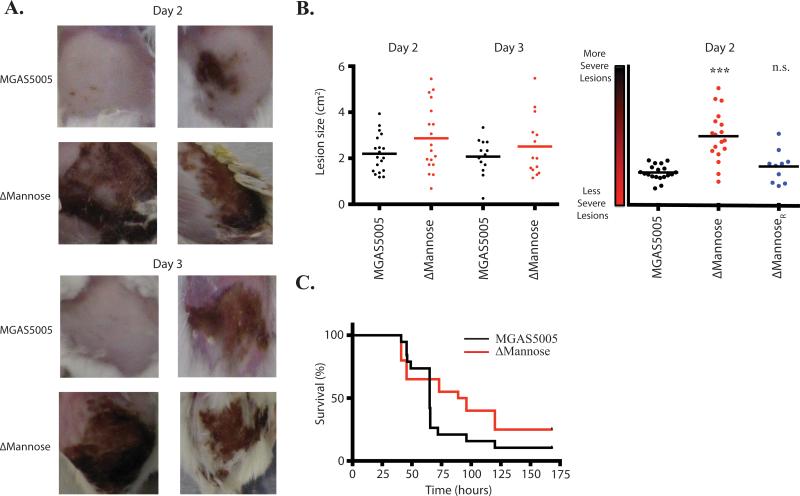
The pathogenesis of the ΔMannose EIIC mutant was assessed in a murine soft tissue infection model, where lesion size and survival from invasive disease was monitored as described (see Experimental Procedures). MGAS5005 lacking a functional PTS (MGAS5005.ΔptsI) was previously shown to elicit larger and more severe lesions than those induced by MGAS5005 in the subcutaneous model (Gera et al., 2014). Although the ΔMannose EIIC mutant exhibited similar lesion sizes to that of MGAS5005, the severity of the lesions in the mutant was increased significantly as compared to MGAS5005 and the ΔMannoseR rescued strain (Fig. 9AB). As was the case for MGAS5005.ΔptsI, the increased localized lesion severity did not lead to increased mortality (Fig. 9C). Rather, survival was slightly increased in the ΔMannose EIIC mutant compared to WT MGAS5005. Thus, the loss of ManMN (EIICD) results in enhanced necrosis during soft-tissue infection.
Figure 9. Contribution to virulence of the mannose EII subunits mutants.
The mannose EIIC subunit mutant was assayed using a murine subcutaneous infection model. Lesion size and survival of mice were monitored for 7 days. Each strain was tested in at least 10 mice. (A) Depicted representative images of lesions taken at 2 and 3 days post infection. (B) Lesion size and severity was measured using ImageJ. Each data point represents a single mouse lesion measured at each time point. (C) Survival was monitored for 7 days. Significance was determined as described in Experimental Procedures.
Discussion
In this study, we generated a PTS EIIC mutant library based on the annotated loci in the M1T1 GAS strain MGAS5005 to help assign the carbohydrate-specific targets for each transporter and to uncover those that contribute to the growth phase expression of Streptolysin S (SLS). By experimentally verifying growth and metabolism of PTS sugars, we discovered that each EII has varying influences on the metabolism of PTS sugars, with Mannose-family EIIs having the broadest influence. Several EIIC mutants, including the Mannose-family EIIs, contributed to an early onset of SLS-mediated hemolysis during growth in vitro and increased severity of skin lesions in vivo, as previously observed with a the PTS-defective MGAS5005.ΔptsI GAS mutant. Characterization of the mannose-specific EIIABCD components (manLMN) in two different M1T1 GAS strains revealed that they played a strain-specific role for PTS sugar metabolism and growth phase-related production of SLS-mediated hemolysis.
The sugar-specificities of a few individual EII systems have been assessed in streptococci, revealing imperfect annotations of their carbohydrate targets (Shelburne et al., 2008b, Bidossi et al., 2012). Applying an extensive metabolic panel to the full complement of EII loci identified in the GAS genome, we found that the level of influence that any given EII had on the metabolism of each PTS carbohydrate varied across the board (Fig 4). In fact, several EIIC transporters appear to have very little influence on PTS sugar metabolism (Fig 4), either because they are not involved in sugar transport or that the substrates of these EIIC components are shared between multiple EII complexes. Some of these EIIs (e.g., Trehalose-specific EII, N-acetylgalactosamine-specific EII, Cellobiose-specific EII-1) are either lacking a key component gene or have multiple genes encoding a single subunit; indicating that they may not be involved in sugar transport (Fig. 1). The annotated Galactose EII appears to have virtually no effect on PTS carbohydrate metabolism (Fig 4). The lacD.1 gene, encoding a tagatose-bisphosphate aldolase, was shown previously to regulate SpeB expression, and no longer participated directly in carbohydrate metabolism (Loughman & Caparon, 2006). Since the galactose-specific EII is found at this genetic locus, it may no longer be contributing to carbohydrate uptake. Instead, it may have adapted to regulate SLS-mediated hemolysis as the ΔGalactose EIIC mutant exhibited early hemolytic activity (Fig. 5). Several EIIs negatively influenced the metabolism of PTS carbohydrates, indicating that perhaps GAS uses EIICs to prioritize the hierarchal metabolism of less preferred carbohydrates (Fig 4). It is clear, however, that annotation alone does not accurately define the sugar specificity of a particular EII, and that each must be experimentally verified.
We identified the Mannose-specific EII system as a central component to the metabolism of a large number of PTS carbohydrates in MGAS5005. In Streptococcus pneumoniae, a ΔmanLMN mutant was recently shown to be unable to grow on non-preferred carbohydrates due to the lack of induction of other metabolic operons (Fleming & Camilli, 2016). In contrast, ManLMN has been shown to have a large number of substrates in other bacteria and plays a more direct role in metabolism of these sugars (Port et al., 2014, Tong et al., 2011). The exact mechanism by which the mannose-specific EII affects the metabolism of other carbohydrates in GAS is not known. In MGAS5005, there were 5 sugars whose metabolism was differentially affected between ΔmanLMN and the ΔMannose EIICD (manMN) mutant (Fig 7A). Thus, an intact manL (EIIAB) alone facilitates optimal growth of GAS on maltose, salicin, glucose, and sucrose. Lack of manL prevents GAS from growing in these sugars efficiently, but it does allow for wild type growth in lactose (Fig 7A). This would suggest that either ManL (EIIAB) can interact with other EII systems, or that ManL (EIIAB) interacts with a protein(s) that influence other metabolic pathways. ManN (EIID) in MGAS5005 had very little influence on PTS sugar metabolism, likely due to the presence of an intact EIIABC that would still allow for transport of PTS substrates.
The specific roles of the ManLMN subunits were not consistent between the two M1T1 strains tested, MGAS5005 and 5448, even though their manLMN gene sequences are identical. The ΔMannose EIIC mutant had a much more limited effect on the growth of GAS in PTS carbohydrates in 5448 compared to the same manMN mutant in MGAS5005 (Fig 7). Overall, Mannose EII component mutants in 5448 only affected growth of GAS in 1 or 2 sugars, which was not the case for the same mutants in MGAS5005, with the exception of MGAS5005.ΔmanN (Fig. 7). Differences in overall PTS sugar metabolism have been observed between different GAS strains, specifically M14 HSC5 and M1T1 MGAS5005 (Port et al., 2014). A mutation in the fructose-specific EII (ΔfruA) in MGAS5005 exhibited increased growth in both glucose and lactose, which was not seen for the same mutant in 5448 (Valdes et al., 2016). We have also observed differences in carbon utilization between MGAS5005 and 5448 (data not shown), indicating that different strains may require different nutrients and have subsequently altered the roles of similar proteins. Thus, GAS strains may be able to infect several different host niches because of their metabolic versatility.
Seven different PTS EIIC mutants in M1T1 MGAS5005 were found to result in SLS-mediated hemolytic activity early in the growth phase (Fig. 5). Since no single EIIC mutant fully recapitulated the early hemolytic activity phenotype seen with the PTS-defective MGAS5005.ΔptsI, there appears to be an additive effect of these EIIs. The mechanism for how these EIICs may influence SLS release is currently being investigated. Given that there are no PTS sugars commonly influenced by all seven EIIC identified, the possibility that the lack of utilization of a single PTS carbohydrate is responsible for hemolysis is unlikely. This does not rule out the possibility of a non-PTS carbon source that is able to be utilized by these EIIs, a distinct possibility as MGAS5005.ΔptsI and ΔMannose EIIC mutant also affects the utilization of several non-PTS carbon sources (Gera et al., 2014 and data not shown). It is also possible that these seven EIIs interact with a common set of PTS-regulatory domain (PRD)-containing regulators, where disruption of this regulatory interaction could lead to early hemolysis. Studies have shown that EIIBs are capable of interacting with other regulators that may influence pathogenesis (Joyet et al., 2013). Whichever the mechanism, it appears that components of carbohydrate metabolic networks are important for timely hemolytic activity in GAS. Interestingly, GAS mutants in the catabolite control protein CcpA (ΔccpA) exhibited early and sustained hemolysis (Kinkel & McIver, 2008; Shelburne et al., 2008a), although this does not appear to involve CcpA directly (Kietzman & Caparon, 2010). Analyses on these different pathways are currently underway to help uncover the mechanism by which the PTS regulates SLS-mediated hemolysis.
The role of ManL and ManN, but not ManM, in regulating hemolytic activity is strain specific. A ΔmanLMN mutant in 5448 exhibited early hemolysis, which was not seen for the same mutant produced in MGAS5005. However, ΔmanN in MGAS5005 exhibited early hemolytic activity to a certain extent, which was not seen for the same respective mutant in 5448. One explanation could be the CovS status of each strain. MGAS5005 is a covS mutant whereas 5448 is wild type for covS, so the presence of a functional CovS may influence the roles of ManL and ManN. To address this possibility, the roles of ManLMN in hemolytic activity are currently being evaluated in 5448AP (CovS−).
The lesions that develop from ΔMannose EII system GAS infections in a mouse model of soft tissue disease are more severe in their necrosis than those that develop from a wild type MGAS5005 infection (Fig. 9). Although the lesion sizes from ΔMannose mutant infections trend larger than those from MGAS5005 infections, the differences are not statistically significant (Fig. 9B). Since 6 other EIIC mutants exhibited early hemolytic activity as well, this suggests that the increased lesion sized observed in MGAS5005.ΔptsI infections could be the result of the additive contribution of several EIIs on SLS expression (Fig. 5). As seen with the PTS-defective MGAS5005.ΔptsI mutant (Gera et al., 2014), a ΔMannose EIIC mutant does not impact lethality compared to MGAS5005 in vivo (Fig. 9). Thus, the influence of the PTS on GAS pathogenesis may be localized to the site of infection, indicating the potential for GAS to use specific carbon metabolic pathways in each distinct host niche in order to govern its pathogenesis.
In conclusion, GAS PTS EII systems vary in their influence on the metabolism of PTS carbohydrates, with several contributing to the regulation of hemolytic activity. The Mannose-specific EIIC plays a central role in PTS carbohydrate metabolism and regulates SLS-mediated hemolysis. This could be a mechanism to obtain sugars in nutrient poor host conditions. Although ManM acts to reduce the lesion severity in soft tissue infections, the overall role of the PTS to mediate lesion severity appears to be the synergistic effect of multiple EIIs.
Experimental Procedures
Bacterial strains and media
Streptococcus pyogenes (GAS) serotype M1T1 strains 5448 (Chatellier et al., 2000) and MGAS5005 (Sumby et al., 2005) were isolated from patients with invasive GAS infection. GAS strains were cultured in either Todd-Hewitt medium supplemented with 0.2% yeast extract (THY) or in chemically defined medium (CDM) (Alpha Biosciences). Fresh sodium bicarbonate (59.51 μM) and L-cysteine (11.68 μM) were added to CDM before use. The carbon source (0.5% glucose or 1% all other PTS sugars) was added prior to GAS inoculation. Escherichia coli strain DH5α (hsdR17 recA1 gyrA endA1 relA1) was used as a vector for the construction of mutagenic plasmids (Table S2) and was grown in Luria-Bertani (LB) broth with or without antibiotics. Spectinomycin (Sp) was used at 100 μg ml−1 for both E. coli and GAS, and Kanamycin (Km) was used at 50 μg ml−1 for E. coli and 300 μg ml−1 for GAS.
DNA manipulations
PCR was performed using Accuprime Pfx (Life Technologies) for cloning and using Taq DNA polymerase (NEB) for diagnostic assays, according to the respective manufacturer's protocol. DNA sequencing was done through Genewiz, Inc. Genomic DNA was extracted from GAS using the Master-Pure complete DNA and RNA purification kit for Gram-positive bacteria (Epicentre). Plasmids were isolated from E.coli using the Wizard Plus SV miniprep kit (Promega). The Wizard SV gel and PCR cleanup kit (Promega) was used to purify DNA fragments from agarose gels.
Generation of annotated EII mutant library in MGAS5005
The annotated EII mutant library was generated using a temperature sensitive pCRS integrative plasmid as previously described (Le Breton & McIver, 2013). Briefly, mutagenic pCRS plasmids were created by inserting an ~500 bp region of internal homology for each EIIC into SmaI-cut pCRS. Insert orientation and accuracy were determined by BamH1 digestion and sequencing, respectively. The resulting mutagenic pCRS plasmids were then transformed into electrocompetent MGAS5005 and plated at 30°C, 5% CO2 for 2 days. Transformants were transferred to THY plates containing spectinomycin (Sp100) at 30°C for 1 day, passaged for 1 day in THY broth containing Sp100 at 37°C, 5% CO2 to allow for integration, and then plated on THY plates containing Sp100 for 1 day. Colonies were checked for proper insertion of the mutagenic plasmid by PCR using a specific mutant primer and the plasmid primers 1201, 1211, pvuIIR, or pvuIIF (Table S3). To generate rescue strains of each mutant isogenic to the wild type (WT), mutants were passaged twice at 30°C in THY broth without antibiotic for 1 day, and then plated on THY plates at 37°C, 5% CO2 and checked for spectinomycin sensitivity.
Stable insertional inactivation of mannose EII subunits in MGAS5005 and 5448
Stable insertional mutants were created using the pSinS (repA deleted) mutagenic approach described previously (Le Breton et al., 2015) . Briefly, mutagenic pSinS plasmids were created by cloning an ~500 bp region of homology of each EII subunit into SmaI-cut pSinS. Insert orientation and accuracy were determined by BamH1 digestion and sequencing, respectively. The resulting mutagenic pSinS plasmids were transformed into electrocompetent 5448 cells containing pHlpK (provides the repAts gene to pSinS) and plated on THY agar containing Sp100 and Km300 at 30°C, 5% CO2 for 2 days. Transformants were transferred into THY broth containing Sp100 and Km300 for 1 day, pelleted, and washed in saline for 2 h at 37°C, 5% CO2, then plated on THY agar containing Sp100. Positive mutants showed spectinomycin resistance and kanamycin sensitivity. Mutants were confirmed by PCR using a specific mutant primer and 1201 & 1211 (Table S3).
Carbon Growth assays
Growth of GAS was monitored using a FLUOstar Omega microplate spectrophotometer (BMG), with OD600 measurements taken every 30 min for 24 h. Plates were shaken 10 s before measurements were taken. Overnight cultures of GAS (10 mL) were grown in THY (with antibiotic if required), pelleted, washed in saline, and adjusted to an OD600 of 0.2 in saline. 50 μl aliquots were added to each well of a 24-well plate (Corning/Costar) containing CDM with 1% of a PTS carbohydrate (0.5% for glucose). Plates were covered with plate tape (Bio-Rad) prior to incubation in the microplate spectrophotometer.
Growth curves were then analyzed as follows. The OD600 measurements of the mutant were divided by the OD600 measurements of the WT at each time point to yield a set of % WT. The median and the interquartile range was calculated for each % WT data set determined for each strain in a particular PTS carbon source. Strains were determined to have a significant growth defect in carbon sources in which growth was more than 2-fold below WT. Strains were determined to have growth above WT in carbon sources that have 2-fold growth above WT. ΔOD was determined by subtracting the max OD600 from the initial OD600. Data shown is the average of at least 3 biological replicates, done in duplicate. Significance was determined by unpaired student's t-test (p-value <0.05).
Carbon Metabolic profiles
Carbon metabolic profiles were determined using the API® 50 CH system (Biomérieux) using the procedure described previously (Valdes et al., 2016). Briefly, strains were cultured overnight on blood agar plates, resuspended in 1ml saline, and vortexed for 3 min. Strains were then diluted and added to 10 mls of API 50 CHL medium (Biomérieux), before being added to each of 50 cupules present in the assay kit. Utilization scores for each carbon source were determined at 24 and 48 hours, with strain given a “+” for utilization, “+/−” for partial utilization, and “−” for no utilization. Utilization scores were then calculated by scoring a “+” as a 1, “+/−” as 0.5, and “−” as 0. With two measurements per assay, scores ranged from 0-2.
Influence Score
The potential impact an EII may have on the metabolism of a carbon source was described by determining an Influence Score as follows:
Influence Score
The Influence Score is an arbitrary value for each EII in each PTS carbohydrate that has no bearing on the actual metabolic potential or efficiency of each EII on a particular carbohydrate. It represents a qualitative method to visualize the potential impact an EII might have on the transport and metabolism of a PTS carbohydrate by combining the results of all the growth and metabolic assays.
qRT-PCR
Quantitative real-time PCR (qRT-PCR) experiments were performed on total RNA isolated from GAS strains grown to late-logarithmic phase using TritonX-100 isolation as described previously (Sung et al., 2003). Isolated RNA was then treated with DNaseI. 25 ng of DNase-treated RNA was then added to a SYBR green master mix (Applied Biosystems) with 6.5 μl of each gene-specific real-time primer from a 20 nM stock using the one-step protocol on a Light Cycler 480 (Roche). Real-time primers (Table S3) were designed using the interactive tool Primer3 (http://biotools.umassmed.edu/bioapps/primer3_www.cgi). Data shown is the combination of at least 3 biological replicates. Significance was determined by 2-fold expression changes.
Mapping the transcriptional unit of the mannose EII operon
RT-PCR was performed on 500 ng of DNase-treated total RNA with M-MuLV reverse transcriptase (NEB) using the manufacturer's protocol. Briefly, 3’ primers for each gene in the operon (Table S3) were used in the RT reaction performed for 1 h at 42°C, followed by enzyme inactivation at 90°C for 10 min. PCR with Taq polymerase was then performed using the relevant primer pairs. PCR parameters were as follows: 5 min at 95°C (initial activation); 45 cycles of 30 s at 95°C; 3 minutes at 55°C (60°C for full operon cDNA); 1.5 min at 72°C (PCR); and 5 min at 72°C (final extension).
Hemolysis Assay
The hemolysis assay was carried out as previously described with some minor modifications (Gera et al., 2014). GAS was grown in THY supplemented with 10% heat inactivated serum (horse or fetal bovine). Samples were taken at 1 h and then every 20 min from 2 h to 10 h. Samples were then pelleted and 50 μl of the supernatant was added to 950 μl of difibrinated sheep red blood cells (RBC). RBCs were prepared as follows: 500 μl of sheep blood was washed three times in phosphate-buffered saline (PBS). Once the supernatant was added to the washed RBCs, these mixtures were incubated for 1 h at 37°C and then centrifuged at 3000 x g to clear intact RBCs. The OD541 of the supernatant was then measured to determine the release of hemoglobin once the RBCs were lysed. A modified version of this assay was carried out for the initial screen of the EII mutant library, where samples were only taken every hour from 1 h to 8 h. Only OD541 above 0.2 were considered positive for RBC lysis. Data shown is compiled from at least 3 biological replicates.
Subcutaneous Murine Infection Model
All animal work was performed in an AAALAC-accredited ABSL-2 facility at the University of Maryland, College Park. IACUC-approved protocols (R-16-05) for humane treatment of animal subjects in accordance with the Office of Laboratory Animal Welfare (OLAW) at NIH, Public Health Service, and the Guide for the Care and Use of Laboratory Animals guidelines were used. Extreme care was taken to limit the distress and pain to the animals.
The subcutaneous murine infection model was carried out as previously described (Geraet al., 2014). Briefly, overnight GAS cultures were used to inoculate 75 ml of THY at a dilution of 1:20. This was incubated statically at 37°C, 5% CO2 until late-logarithimic phase (Klett ~100). A cell suspension of ~3 × 10⁹ CFU ml−1, as determined by microscope counts, was used to infect 5-7 week old female CD-1 mice (Charles River Laboratories). Inoculation counts were verified by plating for viable colonies on THY plates. Mice were anesthetized with ketamine, hair was removed from a 3-cm2 area of one of the haunches with Nair (Carter Products), and 100 μl of GAS suspension in saline was injected subcutaneously. Mice were monitored three times daily for 7 days and were euthanized by CO2 asphyxiation upon signs of morbidity. Lesion sizes were measured at 36 h post infection using Image J. Data were analyzed by GraphPad Prism software and an unpaired two-tailed t test was used to test for significance (α= .05). Lesion severity was determined by calculating the mean red pixel intensity among all pixels present in the lesion selection (ImageJ). Survival significance was determined by Mantel-Cox log rank test (p-value < 0.05)
Supplementary Material
Acknowledgements
We would like to thank Luis Alberto Vega for critical reading of the manuscript. NIH/NIAID T32 training grant (AI089621) provided funding to GSS and NIH/NIAID (AI047298) provided funding to GSS, YLB, EI, and KSM.
Footnotes
Author Contributions
GSS, KG, and KSM designed the study, GSS, YLB, and EI acquired and analyzed the data, and GSS, YLB, and KSM wrote the manuscript.
Conflict of Interest
The authors declare no conflict of interest.
References
- Abranches J, Candella MM, Wen ZT, Baker HV, Burne RA. Different roles of EIIABMan and EIIGlc in regulation of energy metabolism, biofilm development, and competence in Streptococcus mutans. Journal of Bacteriology. 2006;188:3748–3756. doi: 10.1128/JB.00169-06. [DOI] [PMC free article] [PubMed] [Google Scholar]
- Afzal M, Shafeeq S, Henriques-Normark B, Kuipers OP. UlaR activates expression of the ula operon in Streptococcus pneumoniae in the presence of ascorbic acid. Micriobiology. 2015:41–49. doi: 10.1099/mic.0.083899-0. [DOI] [PubMed] [Google Scholar]
- Bidossi A, Mulas L, Decorosi F, Colomba L, Ricci S, Pozzi G, Deutscher J, Viti C, Oggioni MR. A functional genomics approach to establish the complement of carbohydrate transporters in Streptococcus pneumoniae. PLoS One. 2012;7:e33320. doi: 10.1371/journal.pone.0033320. [DOI] [PMC free article] [PubMed] [Google Scholar]
- Carapetis JR, Steer AC, Mulholland EK, Weber M. The global burden of group A streptococcal diseases. Lancet Infectious Diseases. 2005;5:685–694. doi: 10.1016/S1473-3099(05)70267-X. [DOI] [PubMed] [Google Scholar]
- Chatellier S, Ihendyane N, Kansal RG, Khambaty F, Basma H, Norrby-Teglund A, Low DE, McGeer A, Kotb M. Genetic relatedness and superantigen expression in group A streptococcus serotype M1 isolates from patients with severe and nonsevere invasive diseases. Infection and Immunity. 2000;68:3523–3534. doi: 10.1128/iai.68.6.3523-3534.2000. [DOI] [PMC free article] [PubMed] [Google Scholar]
- Cunningham MW. Pathogenesis of group A streptococcal infections. Clinical Microbiology Reviews. 2000;13:470–511. doi: 10.1128/cmr.13.3.470-511.2000. [DOI] [PMC free article] [PubMed] [Google Scholar]
- Deutscher J, Francke C, Postma PW. How phosphotransferase system-related protein phosphorylation regulates carbohydrate metabolism in bacteria. Microbiol Mol Biol Rev. 2006;70:939–1031. doi: 10.1128/MMBR.00024-06. [DOI] [PMC free article] [PubMed] [Google Scholar]
- Esposito S, Bianchini S, Baggi E, Fattizzo M, Rigante D. Pediatric autoimmune neuropsychiatric disorders associated with streptococcal infections: an overview. European Journal of Clinical Microbiology and Infectious Diseases. 2014;33:2105–2109. doi: 10.1007/s10096-014-2185-9. [DOI] [PubMed] [Google Scholar]
- Fleming E, Camilli A. ManLMN is a glucose transporter and central metabolic regulator in Streptococcus pneumoniae. Molecular Microbiology. 2016 doi: 10.1111/mmi.13473. [DOI] [PMC free article] [PubMed] [Google Scholar]
- Foster AJ, Jenkinson JM, Talbolt NJ. Trehalose synthesis and metabolism are required at different stages of plant infection by Magnaporthe grisea. EMBO J. 2003;22:225–235. doi: 10.1093/emboj/cdg018. [DOI] [PMC free article] [PubMed] [Google Scholar]
- Gera K, Le T, Jamin R, Eichenbaum Z, McIver KS. The Phosphoenolpyruvate Phosphotransferase System in Group A Streptococcus Acts To Reduce Streptolysin S Activity and Lesion Severity during Soft Tissue Infection. Infection and Immunity. 2014;82:1192–1204. doi: 10.1128/IAI.01271-13. [DOI] [PMC free article] [PubMed] [Google Scholar]
- Iyer R, Camilli A. Sucrose metabolism contributes to in vivo fitness of Streptococcus pneumoniae. Molecular Microbiology. 2007;66:1–13. doi: 10.1111/j.1365-2958.2007.05878.x. [DOI] [PMC free article] [PubMed] [Google Scholar]
- Joyet P, Bouraoui H, Ake FMD, Derkaoui M, Zebre C, Cao TN, Ventroux M, Ness;er S, Noirot-Gros M, Deutscher J, Milohanic E. Transcription regulators controlled by interaction with enzyme IIB componentsof the phosphoenolpyruvate:sugar phosphotransferase system. Biochimica et Biophysica Acta. 2013;1834:1415–1424. doi: 10.1016/j.bbapap.2013.01.004. [DOI] [PubMed] [Google Scholar]
- Kietzman CC, Caparon MG. CcpA and LacD.1 affect temporal regulation of Streptococcus pyogenes virulence genes. Infection and Immunity. 2010;78:241–252. doi: 10.1128/IAI.00746-09. [DOI] [PMC free article] [PubMed] [Google Scholar]
- Kinkel TL, McIver KS. CcpA-mediated repression of streptolysin S expression and virulence in the group A streptococcus. Infection and Immunity. 2008;76:3451–3463. doi: 10.1128/IAI.00343-08. [DOI] [PMC free article] [PubMed] [Google Scholar]
- Kjos M, Nes IF, Diep DB. Mechanisms of Resistance to Bacteriocins Targeting the Mannose Phosphotransferase System. Applied and Environmental Microbiology. 2011;77:3335–3342. doi: 10.1128/AEM.02602-10. [DOI] [PMC free article] [PubMed] [Google Scholar]
- Le Breton Y, Belew AT, Valdes KM, Islam E, Curry P, Tettelin H, Shirtliff ME, El-Sayed NM, McIver KS. Essential Genes in the Core Genome of the Human Pathogen Streptococcus pyogenes. Scientific Reports. 2015;5:9838. doi: 10.1038/srep09838. [DOI] [PMC free article] [PubMed] [Google Scholar]
- Le Breton Y, McIver KS. Genetic Manipulation of Streptococcus pyogenes (The Group A Streptococcus, GAS). Current Protocols in Microbiology. 2013 doi: 10.1002/9780471729259.mc09d03s30. In Press. [DOI] [PMC free article] [PubMed] [Google Scholar]
- Le Breton Y, Mistry P, Valdes KM, Quigley J, Kumar N, Tettelin H, McIver KS. Genome-wide identification of genes required for fitness of group a streptococcus in human blood. Infection and Immunity. 2013;81:862–875. doi: 10.1128/IAI.00837-12. [DOI] [PMC free article] [PubMed] [Google Scholar]
- López-Garrido J, Puerta-Fernández E, Cota I, Casadesús J. Virulence Gene Regulation by L-Arabinose in Salmonella enterica. Genetics. 2015;200:807–819. doi: 10.1534/genetics.115.178103. [DOI] [PMC free article] [PubMed] [Google Scholar]
- Loughman JA, Caparon M. Regulation of SpeB in Streptococcus pyogenes by pH and NaCl: a model for in vivo gene expression. Journal of Bacteriology. 2006;188:399–408. doi: 10.1128/JB.188.2.399-408.2006. [DOI] [PMC free article] [PubMed] [Google Scholar]
- Lowe RG, Lord M, Rybak K, Trengove RD, O. R.P., Solomon PS. Trehalose biosynthesis is involved in sporulation of Stagonospora nodorum. Fungal Genet Biol. 2009;46:381–389. doi: 10.1016/j.fgb.2009.02.002. [DOI] [PubMed] [Google Scholar]
- McAllister LJ, Ogunniyi AD, Stroeher UH, Paton JC. Contribution of a genomic accessory region encoding a putative cellobiose phosphotransferase system to virulence of Streptococcus pneumoniae. PLoS One. 2012;7:e32385. doi: 10.1371/journal.pone.0032385. [DOI] [PMC free article] [PubMed] [Google Scholar]
- Ngamskulrungroj P, Himmelreich U, Breger JA, Wilson C, Chayakulkeeree M, Krockenberger MB, Malik R, Daniel HM, Toffaletti D, Djordjevic JT, Mylonakis E, Meyer W, Perfect JR. The trehalose synthesis pathway is an integral part of the virulence composite for Cryptococcus gattii. Infection and Immunity. 2009;77:4584–4596. doi: 10.1128/IAI.00565-09. [DOI] [PMC free article] [PubMed] [Google Scholar]
- Petzold EW, Himmelreich U, Mylonakis E, Rude T, Toffaletti D, Cox GM, Miller JL, Perfect JR. Characterization and regulation of the trehalose synthesis pathway and its importance in the pathogenicity of Cryptococcus neoformans. Infection and Immunity. 2006;74:5877–5887. doi: 10.1128/IAI.00624-06. [DOI] [PMC free article] [PubMed] [Google Scholar]
- Port GC, Vega LA, Nylander AB, Caparon MG. Streptococcus pyogenes Polymyxin B-Resistant Mutants Display Enhanced ExPortal Integrity. Journal of Bacteriology. 2014;196 doi: 10.1128/JB.01596-14. [DOI] [PMC free article] [PubMed] [Google Scholar]
- Pridgeon JW, Li Y, Yildirim-Aksoy M, Song L, Klesius PH, Srivastava KK, Reddy PG. Fitness cost, gyrB mutation, and absence of phosphotransferase system fructose specific IIABC component in novobiocin-resistant Streptococcus iniae vaccine strain ISNO. Veterinary microbiology. 2013;165:384–391. doi: 10.1016/j.vetmic.2013.04.001. [DOI] [PubMed] [Google Scholar]
- Sachla AJ, Le Breton Y, Akhter F, McIver KS, Eichenbaum Z. The crimson conundrum: heme toxicity and tolerance in GAS. Front Cell Infect Microbiol. 2014;4:159. doi: 10.3389/fcimb.2014.00159. [DOI] [PMC free article] [PubMed] [Google Scholar]
- Shelburne SA, 3rd, Keith D, Horstmann N, Sumby P, Davenport MT, Graviss EA, Brennan RG, Musser JM. A direct link between carbohydrate utilization and virulence in the major human pathogen group A Streptococcus. Proceedings of the National Academy of Sciences of the United States of America. 2008a;105:1698–1703. doi: 10.1073/pnas.0711767105. [DOI] [PMC free article] [PubMed] [Google Scholar]
- Shelburne SA, 3rd, Keith DB, Davenport MT, Horstmann N, Brennan RG, Musser JM. Molecular characterization of group A Streptococcus maltodextrin catabolism and its role in pharyngitis. Molecular Microbiology. 2008b;69:436–452. doi: 10.1111/j.1365-2958.2008.06290.x. [DOI] [PMC free article] [PubMed] [Google Scholar]
- Sumby P, Porcella SF, Madrigal AG, Barbian KD, Virtaneva K, Ricklefs SM, Sturdevant DE, Graham MR, Vuopio-Varkila J, Hoe NP, Musser JM. Evolutionary origin and emergence of a highly successful clone of serotype M1 group A streptococcus involved multiple horizontal gene transfer events. Journal of Infectious Diseases. 2005;192:771–782. doi: 10.1086/432514. [DOI] [PubMed] [Google Scholar]
- Sung K, Khan SA, Nawaz MS, Khan AA. A simple and efficient Triton X-100 boiling and chloroform extraction method of RNA isolation from Gram-positive and Gram-negative bacteria. FEMS Microbiology Letters. 2003;229:97–101. doi: 10.1016/S0378-1097(03)00791-2. [DOI] [PubMed] [Google Scholar]
- Tong H, Zeng L, Burne RA. The EIIABMan Phosphotransferase System Permease Regulates Carbohydrate Catabolite Repression in Streptococcus gordonii. Applied and Environmental Microbiology. 2011;77:1857–1965. doi: 10.1128/AEM.02385-10. [DOI] [PMC free article] [PubMed] [Google Scholar]
- Tournu H, Fiori A, Van Dijck P. Relevance of Trehalose in Pathogenecity: Some General Rules, Yet Many Exceptions. PLOS PATHOGENS. 2013;9:e1003447. doi: 10.1371/journal.ppat.1003447. [DOI] [PMC free article] [PubMed] [Google Scholar]
- Valdes KM, Sundar GS, Vega LA, Belew AT, Islam E, Binet R, El-Sayed NM, Le Breton Y, McIver KS. The fruRBA operon is necessary for Group A Streptococcal growth in fructose and for resistance to neutrophil killing during growth in whole human blood. Infection and Immunity. 2016 doi: 10.1128/IAI.01296-15. [DOI] [PMC free article] [PubMed] [Google Scholar]
- Zuniga M, Comas I, Linaje R, Monedero V, Yebra MJ, Esteban CD, Deutscher J, Perez-Martinez G, Gonzalez-Candelas F. Horizontal Gene Transfer in the Molecular Evolution of Mannose PTS Transporters. Molecular Biology and Evolution. 2005;22:1673–1685. doi: 10.1093/molbev/msi163. [DOI] [PubMed] [Google Scholar]
Associated Data
This section collects any data citations, data availability statements, or supplementary materials included in this article.


