

Abstract
Objectives
To estimate (1) family‐centered care (FCC) and shared decision‐making (SDM) prevalence, and (2) associations of FCC and SDM (FCC/SDM) with health care outcomes among U.S. children.
Data Source
The Medical Expenditure Panel Survey Household Component (MEPS‐HC), a nationally representative survey of the noninstitutionalized, civilian population.
Study Design
Secondary analyses of prospectively collected data on 15,764 U.S. children were conducted to examine FCC/SDM prevalence in year 1 and associations of FCC/SDM in year 1 with health services utilization, medical expenditures, and unmet health care needs in year 2.
Data Collection/Extraction Methods
We combined four MEPS‐HC longitudinal files from 2007 to 2011.
Principal Findings
FCC/SDM prevalence in year 1 varied from 38.6 to 93.7 percent, and it was lower for composites with more stringent scoring approaches. FCC/SDM composites with stringent scoring approaches in year 1 were associated with reduced unmet needs in year 2. FCC/SDM, across all year 1 composites, was not associated with health services utilization or medical expenditures in year 2. FCC/SDM year 1 subcomponents describing consensus building and mutual agreement were consistently associated with unmet health care needs in year 2.
Conclusions
FCC/SDM composites with stringent scoring approaches measuring consensus building and mutual agreement may have the greatest utility for pediatric health care quality improvement efforts.
Keywords: Family‐centered care, health services utilization, medical expenditures, shared decision making, unmet health care needs
Family‐centered care (FCC) and shared decision making (SDM) are increasingly noted as central tenants of health care quality. In addition to serving as important determinants of health care quality outcomes (Raphael et al. 2011), FCC and SDM have intrinsic value for children, their families, and the health system by shifting the care delivery paradigm from paternalistic to mutualistic (Roter and Hall 1992; Charles, Gafni, and Whelan 1999; Lewis, DeVellis, and Sleath 2002; Shields, Pratt, and Hunter 2006). FCC and SDM have been highlighted in federal legislation (Children's Health Insurance Program Reauthorization Act 2009; Patient Protection and Affordable Care Act 2010), population health priorities (U.S. Department of Health and Human Services 2014), child health measurement frameworks (Center for Medicaid and CHIP Services, Centers for Medicare & Medicaid Services 2015; U.S. Department of Health and Human Services, Health Resources and Services Administration, Maternal and Child Health Bureau n.d.), and by national health care organizations (Institute of Medicine 2001; Medical Home Initiatives for Children With Special Needs Project Advisory Committee 2004; Committee on Hospital Care and Institute for Patient‐ and Family‐Centered Care 2012).
FCC is defined as an innovative approach to pediatric health care planning, delivery, and evaluation wherein families are valued and treated as partners by health care providers (Arango 2011; Committee on Hospital Care and Institute for Patient‐ and Family‐Centered Care 2012). SDM is defined as a process by which families and children are involved by health care providers in bidirectionally exchanging information, building consensus, and reaching agreement about the treatment and other types of health services children need (Charles, Gafni, and Whelan 1997, 1999; Gabe, Olumide, and Bury 2004). Although FCC and SDM have been defined as distinctive pediatric health care quality constructs (U.S. Department of Health and Human Services, Health Resources and Services Administration, Maternal and Child Health Bureau n.d.), SDM has also been defined as one FCC component (Arango 2011; Kuo et al. 2012a).
To date, different pediatric health care conceptualizations of FCC and SDM (FCC/SDM hereinafter) have contributed to varying measurement approaches and may therefore help to explain research findings on FCC/SDM effectiveness. That is, past child health services research on associations of FCC/SDM with pediatric health care outcomes has yielded somewhat limited, though generally positive findings. More specifically, a systematic review of FCC for children with special health care needs (CSHCN) found limited evidence of FCC effectiveness for certain pediatric health care outcomes such as cost and transition to adulthood but positive associations of FCC with improved access to care, satisfaction, family–provider communication, efficient health services use (e.g., reduced hospitalizations), health status, and family functioning (Kuhlthau et al. 2011). A systematic review and meta analysis of SDM in pediatrics found SDM was associated with increased parent knowledge and decreased decisional conflict, but it found little evidence of SDM associations with other pediatric health care outcomes (Wyatt et al. 2015). As health systems and health care providers aim to promote the health of children and their families by delivering high‐quality care through performance measurement and quality improvement initiatives, it is important to understand how different ways of measuring FCC/SDM correlate with different health care outcomes.
This study therefore compared several FCC/SDM measurement approaches that have been described in published studies during the past decade (Table 1) (Brousseau et al. 2007; Fiks et al. 2010, 2012a,b; Kuo, Frick, and Minkovitz 2011; Raphael et al. 2011; Romaire, Bell, and Grossman 2012a,b), using the Medical Expenditure Panel Survey Household Component (MEPS‐HC). The MEPS‐HC was selected given its recurrence since 1996 and the public availability of data on a nationally representative sample of U.S. children. Measures were specifically compared in terms of (1) FCC/SDM prevalence estimates and (2) predictive validity with respect to health services utilization, medical expenditures, and unmet health care needs.
Table 1.
Summary of Family‐Centered Care and Shared Decision‐Making Composite Measures Using the Medical Expenditure Panel Survey Household Component
| Composite Measures | |||||
|---|---|---|---|---|---|
| FCC 1 | SDM 1 | PCMH FCC | FCC 2 | SDM 2 | |
| Individual items (survey module) | |||||
| Thinking about the types of medical, traditional, and alternative treatments that (Parent for Child) are happy with, how often does {a medical person at} (PROVIDER) show respect for these treatments? (AC) | X | X | |||
| If there were a choice between treatments, how often would {a medical person at} (PROVIDER) ask (Parent for Child) to help make the decision? (AC) | X | X | X | ||
| Does {a medical person at} (PROVIDER) present and explain all options to (Parent for Child)? (AC) | X | X | X | ||
| Does {someone at} (PROVIDER) usually ask about prescription medications and treatments other doctors may give them? (AC) | X | ||||
| In the last 12 months, how often did doctors or other health providers spend enough time with (Your Child)? (CS) | X | X | X | X | X |
| In the last 12 months, how often did (Your Child)'s doctors or other health providers show respect for what you had to say? (CS) | X | X | X | X | X |
| In the last 12 months, how often did (Your Child)'s doctors or other health providers explain things in a way that was easy to understand? (CS) | X | X | X | X | X |
| In the last 12 months, how often did (Your Child)'s doctors or other health providers listen carefully to you? (CS) | X | X | X | X | X |
| Item set origin | Item set is from the Consumer Assessment of Healthcare Providers and Systems (CAHPS) Health Plan Version 4.0—Child Questionnaires “How Well Doctors Communicate” composite measure. | Item set was selected by Fiks et al. (2010, 2012a,b) to reflect key concepts of shared decision making including involvement, information sharing, consensus building and agreement, from a widely used SDM definition (Charles, Gafni, and Whelan 1997). | Item set was selected by Romaire and colleagues to reflect the family‐centered care PCMH domain included in the American Academy of Pediatrics' definition (2012). | Item set is from the Consumer Assessment of Healthcare Providers and Systems (CAHPS) Health Plan Version 4.0—Child Questionnaires “How Well Doctors Communicate” composite measure. | Item set was selected by Fiks et al. (2010, 2012a,b) to reflect key concepts of shared decision making including involvement, information sharing, consensus building and agreement, from a widely used SDM definition (Charles, Gafni, and Whelan 1997). |
| Measure denominator | Children aged 0–17 years, with ≥1 doctor's visit in the past 12 months, and complete data on all four items | Children aged 0–17 years, with a USC, and who were not missing data on >6 items in the set | Children aged 0–17 years, with a USC, and who were not missing data on >6 items in the set | Children aged 0–17 years with complete data on all four items | Children aged 0–17 years, with a USC, and who were not missing data on >6 items in the set |
| Measure numerator | Children aged 0–17 years with a score of ≥3 on all four items | Children who scored ≥3 on each of the seven items for which they had data on | Children whose mean score across all seven items using a 0 to 100 scale was ≥75 | Children with a mean score of >3.5 across all four items | Children whose mean score across all seven items for which they had data was ≥3.9 |
| Source(s) a |
(Bethell, Read, and Brockwood 2004; Brousseau et al. 2007; Kuo, Frick, and Minkovitz 2011; Raphael et al. 2011) Brousseau et al. (Items); Bethell et al. (Scoring) |
(Bethell, Read, and Brockwood 2004; Fiks et al. 2010, 2012a,b) Fiks et al. (Items); Bethell et al. (Scoring) |
(Romaire, Bell, and Grossman 2012a,b) Romaire et al. (Items and Scoring) |
(Brousseau et al. 2007; Kuo, Frick, and Minkovitz 2011; Raphael et al. 2011) Brousseau et al. (Items and Scoring) |
(Fiks et al. 2010, 2012a,b) Fiks et al. 2010 (Items and Cut‐off described) |
Source(s) refers to the researchers who selected the item set and/or developed the scoring approach as indicated in parentheses.
AC, Access to Care module; CS, Child Preventive Health Supplement; FCC, family‐centered care; PCMH, patient‐centered medical home; SDM, shared decision making; USC, usual source of care.
Measures were hypothesized to produce different prevalence estimates of FCC/SDM, similar to previous research showing that patient‐centered medical home (PCMH) measures vary by scoring approach (Bethell, Read, and Brockwood 2004). Additionally, based on behavioral models of health services utilization (Aday and Andersen 1974; Andersen 1995, 2008) and child health promotion frameworks (Mistry et al. 2012), FCC/SDM across measures was hypothesized to be more consistently associated with unmet health care needs rather than with health services utilization or medical expenditures in the subsequent year. Measure subcomponents describing consensus building and mutual agreement between families and health care providers (Charles, Gafni, and Whelan 1997; Fiks et al. 2010, 2012a,b) were further expected to be associated with fewer unmet health care needs the following year as compared to information sharing subcomponents, because consensus building and mutual agreement may be more indicative of the underlying FCC and SDM constructs than information sharing alone, which in and of itself may only be indicative of verbal family–provider communication.
Methods
Study Design and Data Source
This was a secondary analysis of publicly available, prospectively collected data from the MEPS‐HC panels 12–15 (2007–2011). The MEPS‐HC uses the previous year's National Health Interview Survey sampling frame and is annually administered by the Agency for Healthcare Research and Quality through an overlapping panel design. One adult reports all data for household members including children (aged <18 years) over five rounds spanning approximately 30 months (roughly 2 years of data are available for each participant). Person‐reported data are supplemented by surveys of health care providers, insurers, and employers (Ezzati‐Rice, Rohde, and Greenblatt 2008; Agency for Healthcare Research and Quality n.d.). Overall response rates for the MEPS‐HC panels 12–15 ranged from 53.5 to 59.3 percent (Agency for Healthcare Research and Quality 2013). The investigators' Institutional Review Board determined this study did not qualify as human subjects research.
Study Sample
A total of 17,383 children aged 0–17 years were initially identified from panels 12–15. Of these children, 1,619 (8.2 percent) were excluded because they were missing data for all eight items previously used to measure FCC/SDM in the first survey year (year 1). The final study sample included 15,674 U.S. children aged 0–17 years with any data on the eight FCC/SDM items in year 1.
Health care Outcomes
Health services utilization, medical expenditures, and unmet health care needs measures were constructed according to past research on FCC/SDM (Kuo, Bird, and Tilford 2011; Kuo, Frick, and Minkovitz 2011; Raphael et al. 2011; Fiks et al. 2012b; Romaire, Bell, and Grossman 2012a,b) (Appendix SA2). All health care outcomes were assessed once in year 1 and again in year 2. Health services utilization measures included annual number of office‐based visits, dental visits, emergency department (ED) visits, and prescription medication fills. Medical expenditures measures included annual office‐based, dental, prescription medication, ED, as well as total and out‐of‐pocket expenditures. Parent‐reported data on child utilization and expenditures were supplemented by surveys of health care providers, insurers, and pharmacies. Unmet health care needs were assessed based on whether each child experienced any unmet need for illness or injury‐related, routine, or necessary care in addition to any difficulty the parent experienced reaching the child's provider by telephone or after regular business hours (evenings and weekends) during the past 12 months. Unmet health care need items were rated on a 4‐point Likert scale and were included in the MEPS‐HC Access to Care or Child Preventive Health Supplement sections, which are administered once in round 2 (year 1) and then again in round 4 (year 2) of the survey period.
Independent Variables
According to a review of past research on FCC or SDM prevalence and/or effectiveness among U.S. children using the MEPS‐HC, we used five composite measures including three assessing FCC and two assessing SDM (Kuo, Frick, and Minkovitz 2011; Romaire, Bell, and Grossman 2012a,b; Raphael et al. 2011; Bethell, Read, and Brockwood 2004; Fiks et al. 2010, 2012a,b). As shown in Table 1, composite measures differed in terms of item set, scoring approach, and sample inclusion criteria. Different combinations of six ordinal and two binary items from the Access to Care and/or Child Health Supplement sections were used to construct the five composite measures. The four Child Preventive Health Supplement section items were adapted from the Agency for Healthcare Research and Quality Consumer Assessment of Healthcare Providers and Systems Health Plan Survey 4.0—Child Questionnaires “How Well Doctors Communicate” composite measure items (Agency for Healthcare Research and Quality 2008). Seven of these eight items were categorized as indicative of involvement, information sharing, consensus building, and/or mutual agreement based on past research (Fiks et al. 2010, 2012a,b). We determined the other item (“Doctor or other health care providers usually ask about prescription medications and treatments other doctors may give the child”), which was not previously categorized, to be most indicative of information sharing. Involvement, information sharing, consensus building, and mutual agreement were considered to be the FCC/SDM subcomponents for this study's purposes.
Covariates were identified as predisposing characteristics, enabling resources, or health care need factors according to previous FCC/SDM research (Bethell, Read, and Brockwood 2004; Denboba et al. 2006; Thompson et al. 2009; Coker, Rodriguez, and Flores 2010; Fiks et al. 2010, 2012a,b; Guerrero et al. 2010; Kuo, Bird, and Tilford 2011; Kuo, Frick, and Minkovitz 2011; Raphael et al. 2011; Romaire, Bell, and Grossman 2012a,b; Smalley et al. 2014; Strickland et al. 2014). Covariates used to characterize the study sample and controlled for in multivariable analysis included child age, sex, race/ethnicity, primary household language, household income relative to the federal poverty level (FPL), highest parent education level, census region, urbanness (i.e., metropolitan statistical region vs. nonmetropolitan statistical region), health insurance status and type, special health care needs status assessed by the CSHCN Screener (Bethell et al. 2002a,b), illness/injury care need(s), specialty care need, and overall health status (Appendix SA2). All covariates were treated as time‐fixed, using responses for children in year 1. Panel indicator variables were additionally included in multivariable regression analyses because data were collected for each panel during different time frames (Romaire, Bell, and Grossman 2012a,b).
Statistical Analyses
For each of the eight FCC/SDM items used in this study, 2.1–5.1 percent of the study sample had missing data. Therefore, multivariate normal imputation with five datasets was used for these variables to minimize nonresponse bias on estimates computed and inferences made (Little and Rubin 2002; Sterne et al. 2009; White, Royston, and Wood 2011; Acock 2012). Additional information on the imputation models used is available upon request.
Descriptive statistics were computed to determine distributions of predisposing, enabling, and health care need factors among all children initially identified in the dataset as well as among children included versus excluded from the study sample. Simple logistic regression models were fit to determine if there were statistically significant differences in the distributions of these factors between children included versus excluded from the study sample. Among the study sample, simple logistic regression was further used to determine differences in the distributions of these factors between children whose families experienced SDM versus children whose families did not experience SDM in year 1, according to the most stringently scored SDM composite measure (SDM 2, see Table 1). Prevalence of FCC/SDM using each composite and the eight individual items was also computed among children in year 1.
Descriptive bivariate statistics were computed and simple regression models were then fit to determine unadjusted associations of FCC/SDM in year 1, using each composite measure, with each health care outcome in year 2 (these results are available upon request). To estimate associations of FCC/SDM in year 1, using each composite measure, with each health care outcome in year 2 controlling for covariates, multivariable regression models were subsequently fit. Two‐part multivariable regression models were fit to estimate associations of (1) FCC/SDM in year 1 with the probability of any health care utilization or any medical expenditures in year 2, and (2) FCC/SDM in year 1 with the mean rate of health care utilization among children with any utilization or the mean medical expenditures among children with any expenditures. Multivariable negative binomial regression was used to estimate the mean rate of health care utilization in year 2, given over dispersion of the distributions for data on each health care utilization variable among the study sample. Multivariable regression with a log link and gamma family was used to estimate mean expenditures in year 2. Multivariable logistic regression was used to model the associations of FCC/SDM in year 1 with the probability of each unmet health care need in year 2. Lastly, separate multivariable logistic regression models were fit to examine associations of the FCC/SDM subcomponents in year 1 with each unmet health care need in year 2.
A lagged dependent variable (LDV) model approach was used for all multivariable regression models to reduce selection bias, confounding, and regression to the mean by controlling for an earlier (lagged, year 1) measure of each dependent variable modeled (Allison 1990; Keele and Kelly 2006; Berger et al. 2009; Blair, Raver, and Berry 2014). The LDV approach was also used to model health care outcomes based on past research, suggesting that health care outcomes for U.S. adults and children may follow an inertia over relatively short time periods (Monheit 2003; Cohen and Yu 2006; Liptak et al. 2006). An autoregressive distributed lag model with the following general form similar to a partial adjustment model for a continuous dependent variable, such as total annual medical expenditures, was fit for each health care outcome in year 2 regressed on the health care outcome in year 1, the given FCC/SDM variable in year 1, and all covariates in year 1 (King and Thomas 2003; Keele and Kelly 2006):
Variance inflation factors and other diagnostics were obtained to check model assumptions. The Holm method, a step‐down multiple test procedure, was used to determine which associations remained statistically significant after controlling for the family‐wise error rate in multivariable regression models (Holm 1979; Aicken and Gensler 1996). All statistical analyses were performed in Stata 13.1 (StataCorp 2013), and survey weights were applied in all analyses to account for the survey's complex and clustered sampling design (Machlin et al. 2010).
Results
Sample Characteristics
Study sample characteristics in year 1 (2007–2010) are displayed in Table 2. Children excluded from the study, because they did not have any data on the FCC/SDM items, were significantly more likely than those in the study sample to have been aged 12–17 years (for the excluded sample: n = 643), Hispanic, lived in a non‐English‐speaking household, had a household income <FPL, had a parent with less than high school education, been uninsured, lacked a usual source of care (USC),1 and had no special health care needs. Comparison of study sample characteristics associated with SDM in year 1 (according to the SDM 2 measure) showed children who were Hispanic versus white, non‐Hispanic; lived in a Spanish versus English‐speaking household; had a household income <FPL versus ≥400 percent FPL; had public versus any private insurance; or had a parent with less than high school education versus an advanced degree were least likely to have experienced SDM.
Table 2.
Predisposing, Enabling, and Need Factors among U.S. Children Aged 0–17 years, 2007–2010
| US Children, 2007–2010 | Study Sample | SDM a in Year 1 | Excluded Sample | SDM versus No SDM p‐value | Excluded versus Included p‐value | ||
|---|---|---|---|---|---|---|---|
| No SDM | SDM | ||||||
| Frequency | 17,383 | 15,764 | 8,530 | 6,244 | 1,619 | − | − |
| % (Among full child population) | 100.0% | 91.8% | 53.5% | 33.6% | 8.2% | ||
| Predisposing factors | |||||||
| Age, years | |||||||
| 0–5 (n = 5,734) | 33.5% | 33.6% | 32.6% | 35.5% | 32.9% | .05 | .025 |
| 6–11 (n = 5,887) | 32.9% | 33.4% | 34.2% | 33.2% | 27.50% | .65 | <.001 |
| 12–17 (n = 5,762) | 33.6% | 33.0% | 33.2% | 31.30% | 39.70% | Referent | Referent |
| Sex | |||||||
| Male (n = 8,946) | 51.1% | 51.2% | 50.7% | 51.8% | 50.0% | .29 | .39 |
| Female (n = 8,437) | 48.90% | 48.80% | 49.30% | 48.2% | 50.0% | Referent | Referent |
| Race/ethnicity | |||||||
| White, NH (n = 5,857) | 55.0% | 56.1% | 54.1% | 61.0% | 43.1% | Referent | Referent |
| Hispanic (n = 6,162) | 22.7% | 21.9% | 24.0% | 18.2% | 31.2% | <.001 | <.001 |
| Black, NH (n = 3,753) | 14.1% | 13.9% | 13.3% | 13.5% | 16.5% | .23 | .001 |
| Other race, NH (n = 1,611) | 8.3% | 8.2% | 8.6% | 7.3% | 9.2% | .008 | .012 |
| Enabling factors | |||||||
| Household language | |||||||
| English (n = 12,566) | 82.9% | 84.0% | 82.5% | 86.9% | 68.2% | Referent | Referent |
| Spanish (n = 3,764) | 12.9% | 12.1% | 13.3% | 9.5% | 24.6% | <.001 | <.001 |
| Other (n = 793) | 4.2% | 3.9% | 4.1% | 3.6% | 7.2% | .40 | <.001 |
| Household income level | |||||||
| 0–99% FPL (n = 5,425) | 21.7% | 21.0% | 21.5% | 18.6% | 29.1% | <.001 | <.001 |
| 100–199% FPL (n = 4,591) | 22.3% | 21.7% | 21.9% | 20.7% | 29.6% | .022 | <.001 |
| 200–399% FPL (n = 4,648) | 32.0% | 32.3% | 32.6% | 32.8% | 28.4% | .05 | .001 |
| ≥400% FPL (n = 2,719) | 24.0% | 25.0% | 24.0% | 27.9% | 12.8% | Referent | Referent |
| Highest parent education | |||||||
| <HS (n = 3,199) | 11.3% | 10.6% | 11.7% | 8.7% | 19.3% | .005 | <.001 |
| HS diploma/GED (n = 7,726) | 42.4% | 41.9% | 41.5% | 40.9% | 47.8% | .51 | <.001 |
| Bachelor's degree (n = 2,444) | 19.4% | 19.8% | 19.5% | 21.1% | 14.3% | .92 | .35 |
| Advanced degree (n = 1,424) | 12.9% | 13.3% | 13.2% | 14.0% | 7.7% | Referent | Referent |
| Other degree (n = 1,878) | 14.1% | 14.4% | 14.1% | 15.3% | 10.8% | .91 | .24 |
| Health insurance | |||||||
| Any private (n = 7,933) | 58.9% | 60.7% | 59.7% | 64.4% | 38.4% | Referent | Referent |
| Public insurance only (n = 8,120) | 33.9% | 33.8% | 34.8% | 30.7% | 35.6% | .002 | <.001 |
| Uninsured (n = 1,330) | 7.2% | 5.6% | 5.5% | 4.9% | 26.1% | .14 | <.001 |
| Census region | |||||||
| Northeast (n = 2,390) | 16.9% | 17.6% | 16.9% | 19.8% | 6.9% | Referent | Referent |
| Midwest (n = 3,430) | 21.5% | 21.9% | 22.6% | 21.5% | 15.7% | .07 | .018 |
| South (n = 6,236) | 37.7% | 37.1% | 34.5% | 39.5% | 47.2% | .83 | <.001 |
| West (n = 4,649) | 23.9% | 23.4% | 26.0% | 19.3% | 30.2% | <.001 | <.001 |
| Urbanness | |||||||
| MSA (n = 15,069) | 84.8% | 84.7% | 85.4% | 83.6% | 86.1% | .16 | .41 |
| Non‐MSA (n = 2,314) | 15.2% | 15.3% | 14.6% | 16.4% | 13.9% | Referent | Referent |
| Usual source of care | |||||||
| No USC (n = 2,117) | 10.8% | 5.1% | 0 | 0 | 94.9% | − | <.001 |
| USC (n = 14,836) | 89.2% | 95.0% | 100.0% | 100.0% | 5.1% | Referent | |
| Health care need factors | |||||||
| CSHCN status | |||||||
| No (n = 13,879) | 80.5% | 79.5% | 78.6% | 80.3% | 94.7% | Referent | Referent |
| Yes (n = 3,079) | 19.5% | 20.5% | 21.4% | 19.7% | 5.3% | .09 | <.001 |
| Specialty care need | |||||||
| No (n = 14,526) | 82.6% | 81.5% | 80.7% | 82.2% | 97.8% | Referent | Referent |
| Yes (n = 2,562) | 17.4% | 18.5% | 19.3% | 17.8% | 2.2% | .1 | <.001 |
| Injury or illness care need | |||||||
| No (n = 13,633) | 78.0% | 76.9% | 76.8% | 76.9% | 93.1% | Referent | Referent |
| Yes (n = 3,471) | 22.0% | 23.1% | 23.2% | 23.1% | 6.9% | .92 | <.001 |
| Overall health status | |||||||
| Excellent/Very good (n = 13,609) | 82.6% | 82.8% | 81.6% | 85.1% | 79.9% | Referent | Referent |
| Good, fair, or poor (n = 3,526) | 17.4% | 17.3% | 18.4% | 14.9% | 20.1% | .002 | .09 |
A dash indicates the statistic was not applicable for the given variable(s).
The SDM 2 measure (Fiks et al. 2010; Table 1) was used to define no SDM (mean score of <3.9 on seven items in year 1) versus SDM receipt (mean score ≥3.9 on seven items in year 1).
CSHCN, children with special health care needs; FPL, federal poverty level; HS; high school; MSA, metropolitan statistical area; NH; non‐Hispanic.
Source: Combined Longitudinal Medical Expenditure Panel Survey Household Component Data Files from 2007 to 2011.
Family‐Centered Care and Shared Decision‐Making Prevalence Estimates
Estimates of FCC/SDM among children in year 1 (2007–2010) varied across the composite measures (Figure 1): FCC ranged from 72.9 percent (95 percent CI: 71.7 percent, 74.2 percent) to 93.7 percent (95 percent CI: 93.1 percent, 94.3 percent), and SDM ranged from 38.6 percent (95 percent CI: 37.0 percent, 40.3 percent) to 93.2 percent (95 percent CI: 92.5 percent, 93.9 percent). Prevalence of FCC/SDM in year 1 also varied among children according to each individual item. While children were least likely to have had a provider who always asked their family members to help make treatment decisions (57.0 percent; 95 percent CI: 55.2 percent, 58.7 percent) and who always respected their family members' preferred treatments (59.7 percent; 95 percent CI: 57.8 percent, 61.6 percent), they were most likely to have had a provider who explained all treatment options (95.1 percent; 95 percent CI: 94.6 percent, 95.7 percent) and who asked about treatments and/or medications received from other providers (79.6 percent; 95 percent CI: 78.2 percent, 80.9 percent).
Figure 1.
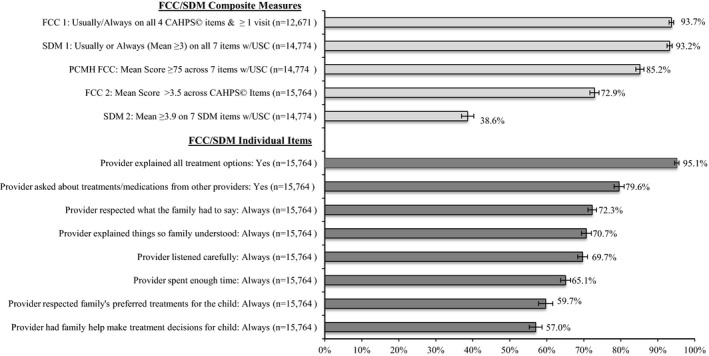
Percentage of U.S. Children Who Received FCC or SDM in Year 1 (95 percent Confidence Interval Shown), by Composite Measures and Individual Items
Notes: FCC, family‐centered care; MEPS‐HC, Medical Expenditure Panel Survey Household Component; SDM, shared decision making; USC, usual source of care.
Source: Combined MEPS‐HC Longitudinal Data Files, 2007–2010.
Associations of FCC/SDM in Year 1 with Health Services Utilization and Medical Expenditures in Year 2
For health services utilization outcomes, results from the multivariable regression models showed no statistically significant associations between FCC/SDM in year 1 and the probability of having any outpatient, dental, prescription drug, or ED utilization in year 2 among U.S. children (Table 3). Multivariable regression model results showed that FCC in year 1, according to the PCMH FCC measure, was associated with a higher mean rate of outpatient visit utilization in year 2 among children with any outpatient visits in year 2 (aIRR: 1.07 [95 percent CI: 1.00, 1.14] p = .048). A positive association was also found of FCC in year 1, according to the FCC 1 composite measure, with mean prescription drug fills in year 2 among children with any prescription drug fills in year 2, such that those with FCC in year 1 had a 19 percent higher mean rate of prescription drug fills in year 2 than those without FCC in year 1 (aIRR: 1.19 [95 percent CI: 1.07, 1.34] p = .002). After applying the Holm method, neither of these associations remained statistically significant.
Table 3.
Associations of FCC and SDM in Year 1 with Health Services Utilization and Medical Expenditures in Year 2 among U.S. Children: Two‐Part Modela Results (Part 1: Adjusted Odds Ratios of Having Any Visit or Expenditure, Part 2: Adjusted Incidence Rate Ratio of Visits among Children with Any or Adjusted Coefficient of Expenditures among Children with Any [95% Confidence Intervals])
| Health Services Utilization, Year 2 | ||||||||||||
|---|---|---|---|---|---|---|---|---|---|---|---|---|
| Part 1: Any Outpatient Visits aOR | Part 2: Outpatient Visits aIRR | Part 1: Any Dental Visits aOR | Part 2: Dental Visits aIRR | Part 1: Any Prescription Fills aOR | Part 2: Prescription Fills aIRR | Part 1: Any ED Visits aOR | Part 2: ED Visits aIRR | |||||
| FCC/SDM composites year 1b | ||||||||||||
| FCC 1 | 0.95 (0.75, 1.19) | 1.07 (0.98, 1.18) | 1.02 (0.81, 1.28) | 1.00 (0.90, 1.11) | 0.96 (0.79, 1.16) | 1.19 (1.07, 1.34)** | 0.85 (0.63, 1.13) | 0.90 (0.79, 1.01) | ||||
| SDM 1 | 1.00 (0.80, 1.25) | 1.05 (0.95, 1.15) | 1.00 (0.81, 1.24) | 1.03 (0.93, 1.13) | 1.05 (0.86, 1.29) | 1.11 (0.97, 1.26) | 1.00 (0.78, 1.29) | 0.96 (0.86, 1.07) | ||||
| PCMH FCC | 1.04 (0.88, 1.23) | 1.07 (1.00, 1.14)* | 1.05 (0.90, 1.23) | 1.02 (0.95, 1.10) | 1.07 (0.91, 1.25) | 1.05 (0.96, 1.15) | 0.97 (0.80, 1.18) | 0.97 (0.91, 1.04) | ||||
| FCC 2 | 0.97 (0.86, 1.10) | 1.01 (0.93, 1.09) | 1.07 (0.95, 1.20) | 1.01 (0.95, 1.08) | 1.05 (0.94, 1.18) | 1.02 (0.95, 1.09) | 0.98 (0.83, 1.16) | 1.01 (0.95, 1.07) | ||||
| SDM 2 | 1.03 (0.91, 1.16) | 0.95 (0.89, 1.02) | 0.93 (0.81, 1.06) | 0.98 (0.93, 1.04) | 1.03 (0.92, 1.15) | 1.03 (0.96, 1.10) | 0.90 (0.76, 1.06) | 1.00 (0.95, 1.06) | ||||
| Medical Expenditures, Year 2 | ||||||||||||
|---|---|---|---|---|---|---|---|---|---|---|---|---|
| Part 1: Any Outpatient Expenditures aOR | Part 2: Outpatient Expenditures β | Part 1: Any Dental Expenditures aOR | Part 2: Dental Expenditures β | Part 1: Any Prescription Expenditures aOR | Part 2: Prescription Expenditures β | Part 1: Any ED Expenditures aOR | Part 2: ED Expenditures β | Part 1: Any Total Expenditures aOR | Part 2: Total Expenditures β | Part 1: Any Out‐of‐Pocket Expenditures aOR | Part 2: Out‐of‐Pocket Expenditures β | |
| FCC/SDM composites year 1 | ||||||||||||
| FCC 1 | 0.95 (0.76, 1.20) | 0.11 (−0.08, 0.30) | 1.01 (0.81, 1.27) | −0.07 (−0.30, 0.17) | 0.98 (0.80, 1.19) | 0.21 (−0.03, 0.46) | 0.83 (0.62, 1.11) | −0.02 (−0.29, 0.24) | 0.85 (0.66, 1.10) | 0.08 (−0.10, 0.26) | 0.96 (0.77, 1.20) | 0.14 (−0.10, 0.38) |
| SDM 1 | 1.00 (0.79, 1.25) | 0.04 (−0.16, 0.25) | 0.99 (0.80, 1.24) | −0.06 (−0.35, 0.22) | 1.07 (0.87, 1.31) | 0.07 (−0.24, 0.38) | 1.00 (0.77, 1.29) | −0.08 (−0.34, 0.19) | 0.98 (0.75, 1.28) | 0.10 (−0.09, 0.29) | 1.10 (0.88, 1.38) | 0.10 (−0.25, 0.45) |
| PCMH FCC | 1.04 (0.87, 1.23) | 0.13 (0.00, 0.27) | 1.03 (0.88, 1.20) | −0.03 (−0.22, 0.16) | 1.08 (0.93, 1.27) | 0.11 (−0.15, 0.38) | 0.98 (0.81, 1.19) | 0.01 (−0.18, 0.20) | 1.03 (0.83, 1.29) | 0.07 (−0.06, 0.20) | 1.14 (0.94, 1.38) | 0.08 (−0.16, 0.32) |
| FCC 2 | 0.97 (0.86, 1.09) | −0.03 (−0.15, 0.08) | 1.05 (0.94, 1.18) | −0.04 (−0.20, 0.12) | 1.06 (0.95, 1.18) | −0.04 (−0.21, 0.12) | 0.97 (0.82, 1.14) | −0.09 (−0.25, 0.07) | 1.01 (0.87, 1.16) | −0.05 (−0.15, 0.06) | 0.95 (0.83, 1.09) | 0.01 (−0.13, 0.16) |
| SDM 2 | 1.02 (0.91, 1.15) | −0.07 (−0.17, 0.03) | 0.91 (0.80, 1.04) | −0.09 (−0.23, 0.06) | 1.03 (0.92, 1.15) | −0.09 (−0.26, 0.08) | 0.91 (0.77, 1.08) | −0.10 (−0.24, 0.03) | 0.92 (0.80, 1.06) | −0.12 (−0.23, −0.01)* | 0.92 (0.82, 1.04) | −0.15 (−0.28, −0.01)* |
All models were adjusted for child age, sex, race/ethnicity, household language, household income level, highest parent education level earned, health insurance status/type, census region, urbanness, children with special health care needs status, illness or injury care need, specialty care need, overall health status, panel, as well as the probability of the given utilization/expenditures type (Part 1 Models) or mean utilization/expenditures of the given type (Part 2 Models) during year 1.
Measure definitions: FCC 1 = Usually or Always on all four CAHPS© items; SDM 1 = Usually or Always on all seven items; PCMH FCC = Mean Score ≥75 across seven items; FCC 2 = Mean Score >3.5 across CAHPS© items; and SDM 2 = Mean Score ≥3.9 across seven items.
aIRR, adjusted incidence rate ratio; aOR, adjusted odds ratio; CAHPS, Consumer Assessment of Healthcare Providers and Systems; ED, emergency department; FCC, family‐centered care; PCMH, patient‐centered medical home; SDM, shared decision making.
*Significant effect at the p < .05 level; **Significant effect at the p < .01 level. Associations did not remain statistically significant at the p < .05 level after applying the Holm method.
Source: Combined Longitudinal Medical Expenditure Panel Survey Household Component Data Files from 2007 to 2011.
For annual medical expenditure outcomes, no statistically significant associations were found between FCC/SDM in year 1 and the probability of any medical expenditure in year 2 among U.S. children (Table 3). Shared decision making in year 1, as assessed by the SDM 2 composite measure, was associated with reduced mean total (β = −0.12 [95 percent CI: −0.23, −0.01] p = .033) and reduced mean out‐of‐pocket medical (β = −0.15 [95 percent CI: −0.28, −0.01] p = .032) expenditures in year 2 among children who had any total or any out‐of‐pocket medical expenditures in year 2. These associations did not remain statistically significant after accounting for multiple comparisons.
Associations of FCC/SDM in Year 1 with Unmet Health Care Needs in Year 2
For unmet health care need outcomes, the probability of experiencing any unmet need for routine care or difficulty contacting the child's provider by telephone in year 2 was generally negatively associated with FCC/SDM in year 1, across the five composite measures (Table 4). FCC in year 1, as assessed with the PCMH FCC measure, was associated with the smallest reductions in the adjusted odds of unmet health care needs during year 2. No associations of PCMH FCC in year 1 with unmet health care needs in year 2 remained statistically significant after accounting for multiple comparisons. FCC/SDM in year 1, as assessed by the FCC 2 and SDM 2 composites, was associated with the greatest reduction in the adjusted odds of each unmet health care need in year 2 among U.S. children. Although only SDM in year 1, as assessed by the SDM 2 composite, remained significantly associated with reduced adjusted odds of experiencing any difficulty contacting the child's provider after regular business hours in year 2 after accounting for multiple comparisons.
Table 4.
Effects of FCC/SDM Composites and Subcomponents in Year 1 on Unmet Health Care Needs in Year 2 among U.S. Children, Adjusted Odds Ratios (95% Confidence Intervals)a
| Unmet Health Care Needs, Year 2 | |||||
|---|---|---|---|---|---|
| Illness/Injury Care Unmet Need aOR | Routine Care Unmet Need aOR | Necessary Care, Tests, and/or Treatment Unmet Need aOR | Difficulty Contacting Child's Provider by Phone aOR | Difficulty Contacting Child's Provider after Hours aOR | |
| FCC/SDM composites, year 1b | |||||
| FCC 1 | 0.57 (0.38, 0.83)** | 0.62 (0.49, 0.78) *** | 0.72 (0.54, 0.97)* | 0.61 (0.48, 0.77) *** | 0.77 (0.59, 1.02) |
| SDM 1 | 0.66 (0.44, 0.98)* | 0.65 (0.51, 0.81) *** | 0.58 (0.44, 0.78) *** | 0.61 (0.48, 0.76) *** | 0.89 (0.70, 1.15) |
| PCMH FCC | 0.64 (0.46, 0.87)** | 0.74 (0.62, 0.91)** | 0.70 (0.55, 0.88)** | 0.76 (0.64, 0.90)** | 0.80 (0.65, 0.97)* |
| FCC 2 | 0.51 (0.40, 0.64) *** | 0.58 (0.50, 0.66) *** | 0.47 (0.39, 0.57) *** | 0.76 (0.65, 0.88) ** | 0.79 (0.66, 0.94)** |
| SDM 2 | 0.44 (0.32, 0.61) *** | 0.59 (0.50, 0.70) *** | 0.45 (0.37, 0.60) *** | 0.67 (0.58, 0.78) *** | 0.78 (0.66, 0.91) ** |
| FCC/SDM subcomponents, year 1 | |||||
| Information sharing | |||||
| Provider explained all options: Yes | 0.83 (0.54, 1.27) | 0.86 (0.65, 1.15) | 0.75 (0.52, 1.07) | 0.65 (0.51, 0.84) ** | 1.02 (0.73, 1.42) |
| Provider asked about treatments/ prescriptions from other providers: Yes | 0.78 (0.58, 1.06) | 1.06 (0.88, 1.27) | 0.93 (0.75, 1.16) | 0.94 (0.81, 1.09) | 0.93 (0.78, 1.11) |
| Provider spent enough time with child: Always | 0.64 (0.50, 0.82) *** | 0.67 (0.58, 0.77) *** | 0.62 (0.50, 0.75) *** | 0.76 (0.66, 0.89) ** | 0.83 (0.70, 0.97)* |
| Information sharing and consensus building | |||||
| Provider listened carefully to child's family: Always | 0.59 (0.46, 0.74) *** | 0.68 (0.59, 0.78) *** | 0.55 (0.46, 0.67) *** | 0.80 (0.69, 0.93)** | 0.84 (0.72, 0.96)* |
| Provider explained things in a way the child's family could understand: Always | 0.57 (0.45, 0.72) *** | 0.67 (0.58, 0.77) *** | 0.53 (0.45, 0.63) *** | 0.81 (0.69, 0.94)** | 0.84 (0.72, 0.99)* |
| Consensus building | |||||
| Provider respected family's preferred treatments for the child: Always | 0.44 (0.33, 0.59) *** | 0.60 (0.52, 0.70) *** | 0.55 (0.45, 0.67) *** | 0.72 (0.63, 0.83) *** | 0.80 (0.67, 0.95)* |
| Consensus building and agreement | |||||
| Provider showed respect for what the child's family had to say: Always | 0.55 (0.43, 0.70) *** | 0.67 (0.58, 0.77) *** | 0.57 (0.48, 0.68) *** | 0.82 (0.72, 0.95)** | 0.84 (0.72, 0.99)* |
| Agreement and involvement | |||||
| Provider asked the child's family to help make treatment decisions: Always | 0.55 (0.42, 0.71) *** | 0.69 (0.60, 0.80) *** | 0.65 (0.53, 0.80) *** | 0.76 (0.59, 0.88) *** | 0.81 (0.69, 0.95)** |
All models adjusted for the following factors: child age, sex, race/ethnicity, household income, primary household language, insurance status, highest parent education level census region, urbanness, children with special health care needs status, illness/injury care need, specialty care need, overall health status, and panel.
Measure definitions: FCC 1 = Usually or Always on all four CAHPS© items; SDM 1 = Usually or Always on all seven items; PCMH FCC = Mean Score ≥75 across seven items; FCC 2 = Mean Score >3.5 across CAHPS© items; and SDM 2 = Mean Score ≥3.9 across seven items.
aOR, adjusted odds ratio; CI, confidence interval; FCC, family‐centered care; PCMH, patient‐centered medical home; SDM, shared decision making.
*Significant effect at the p < .05 level; **Significant effect at the p < .01 level; ***Significant effect at the p < .001 level. Bolded results indicate that the association remained statistically significant after applying the Holm method.
Source: Combined Longitudinal Medical Expenditure Panel Survey Household Component Data Files from 2007 to 2011.
For the FCC/SDM subcomponents in year 1, the adjusted odds of experiencing any difficulty contacting the child's provider after regular business hours in year 2 was not always reduced, and associations of FCC/SDM subcomponents in year 1 with any difficulty contacting the child's provider after regular business hours in year 2 did not remain statistically significant after accounting for multiple comparisons. Two items identified as indicative of information sharing between children's families and providers in year 1 (e.g., “Provider explained all options” and “Provider asked about treatments and/or prescriptions given to child by other providers”) were least likely (relative to the other items) to be significantly associated with unmet health care needs in year 2 (Table 4). One item indicative of information sharing in year 1 (i.e., “Provider spent enough time with child during visits”) was, however, consistently associated with reduced adjusted odds of experiencing four unmet health care needs assessed in year 2. One item indicative of the consensus building subcomponent (“Provider respected family's preferred treatments for the child”) and one item indicative of the involvement and mutual agreement subcomponents (“Provider asked the child's family to help make treatment decisions”) in year 1 were also consistently associated with reduced adjusted odds of four unmet health care needs in year 2 among U.S. children.
Discussion
In this study, we found that FCC/SDM prevalence varied considerably (from 39 to >90 percent) depending on the measurement strategy selected, which means that existing measurement approaches could result in different interpretations of health care quality even when the same data are used. For this reason, coming to a “consensus” definition of FCC/SDM in pediatrics may be of significant importance, particularly determining whether FCC and SDM are distinct yet interrelated or if SDM is one FCC component. Of the measurement strategies we investigated, the more stringent measurement strategies—specifically, approaches using higher mean thresholds—yielded lower FCC and SDM prevalence estimates. However, these more stringent measurement strategies were the only ones that had consistent associations with unmet health care needs. Less stringent FCC/SDM composite measures also had concerning ceiling effects: for instance, FCC 1 and SDM 1 showed less than 10 percent of U.S. children did not receive FCC and SDM in year 1. High rates of FCC/SDM may reduce the ability detect meaningful change in the FCC and SDM experiences of children and their families, especially when measured over short periods of time, which is often the case in QI initiatives. For this reason, the results of this study suggest that providers and policy makers should choose a more stringent FCC/SDM measurement approach (e.g., FCC 2 or SDM 2) if they wish to correlate FCC/SDM with unmet health care needs or follow FCC/SDM over time.
Overall, this study's findings are consistent with past research. Prior cross‐sectional studies using composites similar to the FCC 1 composite in this study showed similar associations with unmet health care needs (Hargraves, Hays, and Cleary 2003; Kuo, Frick, and Minkovitz 2011). Associations with health services utilization and medical expenditures in year 2 in this study were directionally similar to associations demonstrated in past research (Kuo, Bird, and Tilford 2011; Raphael et al. 2011; Fiks et al. 2012a; Romaire, Bell, and Grossman 2012a); however, this study's findings about utilization and expenditures were not statistically significant in contrast to some past research (Raphael et al. 2011; Fiks et al. 2012a; Romaire, Bell, and Grossman 2012a,b). Methodological differences between this study and past research may explain some of these differences. Methodological considerations include the use of different MEPS‐HC file types (i.e., consolidated vs. longitudinal), study sample definitions (e.g., CSHCN only vs. all children aged <18 years), modeling approaches (e.g., change/gain score approach vs. LDV approach), correction (or lack thereof) for multiple comparisons (increased type I error rate), and treatment of covariates (e.g., controlling vs. not controlling for potential confounders) along with the treatment of missing data (e.g., multiple imputation vs. complete case analysis). Alternatively, it may be that FCC/SDM exerts a greater proximal influence on health care experiences such as unmet health care needs than on health services utilization and medical expenditures. Evidence reviews on FCC, SDM, and patient–provider communication (Dwamena et al. 2012; Shields et al. 2012; Wyatt et al. 2015) as well as theoretical behavioral health care utilization models (Andersen 1995, 2008) support this temporal relationship.
Study findings further suggest that FCC/SDM consensus building and mutual agreement subcomponents may more consistently influence unmet health care needs than information sharing alone. For this reason, providers and policy makers should emphasize these SDM components when seeking to improve outcomes. Promising practices and recommendations, such as those provided by the Institute for Patient‐ and Family‐Centered Care (Johnson et al. 2008) and others (Committee on Hospital Care and Institute for Patient‐ and Family‐Centered Care 2012; Kuo et al. 2012a), may be useful to providers and policy makers focused on promoting consensus building and mutual agreement.
Despite a growing consensus that FCC and SDM are valuable pediatric health care quality measures (Committee on Hospital Care and Institute for Patient‐ and Family‐Centered Care 2012; U.S. Department of Health and Human Services 2014; U.S. Department of Health and Human Services, Health Resources and Services Administration, Maternal and Child Health Bureau n.d.), the clinical utility of some FCC/SDM subcomponents remains unclear. For instance, some clinicians may view the FCC/SDM item “Provider explained all treatment options” as irrelevant because family members who are not clinicians themselves cannot accurately judge if all available treatment options were explained. Likewise, explaining treatment alternatives may not be necessary when treatment of a particular condition is relatively straightforward, so a certain level of nonreceipt of that item may be acceptable. Moreover, certain parents may be more likely to remain resistant to recommended preventive care for their children such as routine immunizations when providers emphasize consensus building and mutual agreement (Opel et al. 2013). As a result, the construct validity of the eight MEPS‐HC items used to assess FCC/SDM requires further study. More comprehensive measures of related pediatric care delivery processes (i.e., care coordination) could be considered in such construct validation studies (McDonald et al. 2012). Better defining expectations and experiences related to FCC and SDM from the perspectives of children, their family members, and health care providers using the MEPS‐HC as well as items from other, related instruments could also improve the construct validity of FCC/SDM measures.
Including or excluding certain children from the denominators of FCC/SDM measures may also affect the interpretation of FCC/SDM rates. To be included in the SDM and PCMH FCC composite measures in this study, a USCa had to be indicated for children. On average, between 2007 and 2010, approximately 11 percent of U.S. children did not have a USC. Common reasons for individuals indicating they or their other household members (including children) do not have a USC in the MEPS‐HC include never getting sick, costs, and recently having moved (Kirby 2010). The FCC/SDM construct being operationalized with the SDM and PCMH FCC composites may therefore be limited to FCC/SDM for children with a USC. The FCC construct assessed by the FCC 1 composite may be similarly limited insofar as children who did not have one or more doctor's visits within the past 12 months are excluded. Thus, it may be necessary for policy makers and clinicians assessing FCC and SDM to weigh whether they are interested in FCC and SDM experiences more globally or more specifically in relationship with the child's USC or “doctor's” visit(s) that occurred in the past year.
This study has several main limitations that should be considered in interpreting its findings. Although the study design was prospective in nature and the LDV modeling approach used may have reduced the influence of selection bias and regression to the mean, the data were observational thereby limiting causal inference (Shadish, Cook, and Campbell 2002). The LDV approach may bias estimates of explanatory variables downward (Achen 2000). This bias may, however, not be significant if the underlying process is dynamic in nature (Keele and Kelly 2006), as health care outcomes may be for individuals in the United States (Monheit 2003; Cohen and Yu 2006; Liptak et al. 2006). Additionally, FCC/SDM was only assessed from the perspective of parents or other adult family members of children, an important perspective to capture, but one potentially divergent from children and their health care providers (Gabe, Olumide, and Bury 2004; Shields, Pratt, and Hunter 2006; Fiks et al. 2011). This study also focused on FCC/SDM measures developed from MEPS‐HC items. We recognize that other FCC/SDM composite measures—some of which use similar items to those examined here—have been developed using health plan and other national surveys (e.g., the National Survey of Children's Health, the National Survey of Children with Special Health Care Needs) as well as for different child subpopulations and/or anchored to more specific care experiences (e.g., ADHD management) (Brinkman et al. 2011; Kuo et al. 2012b; McDonald et al. 2012; Butler et al. 2014; Smalley et al. 2014). Lastly, neither CSHCN nor CSHCN subgroups were separately analyzed as has been done in some past research (Kuo, Bird, and Tilford 2011; Raphael et al. 2011; Fiks et al. 2012b; Romaire, Bell, and Grossman 2012b) given this study's focus on children overall and because initial analyses suggested receipt of FCC/SDM in year 1 was not significantly different between CSHCN and non‐CSHCN.
Conclusions
Comparison of FCC/SDM composite measures in this study suggests that using measures with more stringent scoring approaches and that include items indicative of consensus building and mutual agreement may have the greatest utility for health systems aiming to improve pediatric health care quality. This is because FCC/SDM composites with more stringent scoring approaches yielded lower FCC/SDM prevalence estimates in year 1, potentially making meaningful improvement easier to detect, and were shown to be consistently associated with reduced unmet health care needs in year 2 among U.S. children. This study's results additionally showed that the FCC/SDM consensus building and mutual agreement subcomponents in year 1 were more consistently associated with reduced unmet health care needs in year 2 relative to the information sharing subcomponent alone.
Future research on the construct validity of existing parent‐reported FCC/SDM measures is needed, particularly for performance measurement efforts seeking to connect care experiences to long‐term patient reported outcomes (Magasi et al. 2012; Bevans et al. 2014). It will also be important to incorporate clinical perspectives and expertise to ensure measures are perceived as meaningful and are ultimately used by pediatric providers. Development and more standardized use of valid, comprehensive measures may contribute to greater understanding of how FCC/SDM can best promote the delivery of quality care and positively shape health trajectories.
Supporting information
Appendix SA1: Author Matrix.
Appendix SA2: Health Care Outcomes and Covariates Examined in Relation to FCC/SDM Measures Using the MEPS‐HC.
Acknowledgments
Joint Acknowledgment/Disclosure Statement: This project was supported by the Agency for Healthcare Research and Quality Junior Summer Fellows Program. The views expressed in this article are those of the authors, and no official endorsement by the U.S. Department of Health and Human Services or the Agency for Healthcare Research and Quality is intended or should be inferred. We thank Drs. Sheryl Thorburn, Adam Branscum, and Kari‐Lyn Sakuma for their constructive feedback on an initial draft of the manuscript, as well as Drs. Ernest Moy and Denise Dougherty for their initial involvement in the study's conceptualization. We also thank Dr. Barbara Schone for her thoughtful feedback on a revised version of this manuscript.
Disclosures: None.
Disclaimers: None.
Note
In the MEPS‐HC, usual source of care is defined as “whether or not [individuals] or their family member had a particular doctor's office, clinic, health center, or other place (excluding hospital emergency rooms) to go to for medical care when ill or for health‐related advice. Individuals who indicated they had a particular place [are] considered to have a usual source of care” (p. 2; Kirby 2010).
References
- Achen, C. H. 2000. “Why Lagged Dependent Variables Can Suppress the Explanatory Power of Other Independent Variables.” Ann Arbor 10 (1): 1206–48. [Google Scholar]
- Acock, A. 2012. “What to Do about Missing Values” In APA Handbook of Research Methods in Psychology, edited by Cooper H., Camic P., Long D., Panter A., Rindskopf D., and Sher K., pp. 27–50. Washington, DC: American Psychological Association. [Google Scholar]
- Aday, L. A. , and Andersen R.. 1974. “A Framework for the Study of Access to Medical Care.” Health Services Research 9 (3): 208–20. [PMC free article] [PubMed] [Google Scholar]
- Agency for Healthcare Research and Quality . 2008. Reporting Measures for the CAHPS® Health Plan Survey 4.0. Reporting Kit 1108. Rockville, MD: Agency for Healthcare Research and Quality; [accessed on September 8, 2014]. Available at https://cahps.ahrq.gov/surveys-guidance/hp/about/1108_HP40_Reporting_Measures_2008.pdf [Google Scholar]
- Agency for Healthcare Research and Quality . 2013. “MEPS‐HC Response Rates by Panel” [accessed on September 8, 2014]. Available at http://meps.ahrq.gov/survey_comp/hc_response_rate.jsp
- Agency for Healthcare Research and Quality . n.d. “MEPS‐HC Sample Design and Collection Process.” MEPS‐HC Panel Design and Data Collection Process [accessed on September 8, 2014]. Available at http://www.meps.ahrq.gov/survey_comp/hc_data_collection.jsp
- Aicken, M. , and Gensler H.. 1996. “The Bonferroni vs Holm Methods.” American Journal of Public Health 86: 726–8. [DOI] [PMC free article] [PubMed] [Google Scholar]
- Allison, P. 1990. “Change Scores as Dependent Variables in Regression Analysis.” Sociology Methodology 20 (1): 93–114. [Google Scholar]
- Andersen, R. 1995. “Revisiting the Behavioral Model and Access to Medical Care: Does It Matter?” Journal of Health and Social Behavior 36 (1): 1–10. [PubMed] [Google Scholar]
- Andersen, R. . 2008. “National Health Surveys and the Behavioral Model of Health Services Use.” Medical Care 46: 647–53. [DOI] [PubMed] [Google Scholar]
- Arango, P. 2011. “Family‐Centered Care.” Academic Pediatrics 11: 97–9. [DOI] [PubMed] [Google Scholar]
- Berger, L. M. , Bruch S. K., Johnson E. I., James S., and Rubin D.. 2009. “Estimating the ‘“Impact”’ of out‐of‐Home Placement on Child Well‐Being: Approaching the Problem of Selection Bias.” Child Development 80 (6): 1856–76. [DOI] [PMC free article] [PubMed] [Google Scholar]
- Bethell, C. D. , Read D., and Brockwood K.. 2004. “Using Existing Population‐Based Data Sets to Measure the American Academy of Pediatrics Definition of Medical Home for All Children and Children with Special Health Care Needs.” Pediatrics 113 (5 Suppl): 1529–37. [PubMed] [Google Scholar]
- Bethell, C. D. , Read D., Neff J., Blumberg S. J., Stein R. E., Sharp V., and Newacheck P. W.. 2002a. “Comparison of the Children with Special Health Care Needs Screener to the Questionnaire for Identifying Children with Chronic Conditions–revised.” Ambulatory Pediatrics 2 (1): 49–57. [DOI] [PubMed] [Google Scholar]
- Bethell, C. D. , Read D., Stein R. E., Blumberg S. J., Wells N., and Newacheck P. W.. 2002b. “Identifying Children with Special Health Care Needs: Development and Evaluation of a Short Screening Instrument.” Ambulatory Pediatrics 2 (1): 38–48. [DOI] [PubMed] [Google Scholar]
- Bevans, K. B. , Moon J., Carle A. C., Mara C. A., Lai J.‐S., DiMarco L., Muller N., and Woods D.. 2014. “Patient Reported Outcomes as Indicators of Pediatric Health Care Quality.” Academic Pediatrics 14 (5S): S90–6. [DOI] [PubMed] [Google Scholar]
- Blair, C. , Raver C., and Berry D. J.. 2014. “Two Approaches to Estimating the Effect of Parenting on the Development of Executive Function in Early Childhood.” Developmental Psychology 50 (2): 554–65. [DOI] [PMC free article] [PubMed] [Google Scholar]
- Brinkman, W. B. , Hartl J., Rawe L. M., Sucharew H., Britto M. T., and Epstein J. N.. 2011. “Physicians' Shared Decision‐Making Behaviors in Attention Deficit/Hyperactivity Disorder Care.” Archives of Pediatrics & Adolescent Medicine 165 (11): 1013–9. doi:10.1001/archpediatrics.2011.154. [DOI] [PMC free article] [PubMed] [Google Scholar]
- Brousseau, D. C. , Hoffmann R. G., Nattinger A. B., Flores G., Zhang Y., and Gorelick M.. 2007. “Quality of Primary Care and Subsequent Pediatric Emergency Department Utilization.” Pediatrics 119 (6): 1131–8. [DOI] [PubMed] [Google Scholar]
- Butler, A. M. , Elkins S., Kowalkowski M., and Raphael J. L.. 2014. “Shared Decision Making among Parents of Children with Mental Health Conditions Compared to Children with Chronic Physical Conditions.” Maternal and Child Health Journal 19 (2): 410–18. doi:10.1007/s10995‐014‐1523‐y. [DOI] [PubMed] [Google Scholar]
- Center for Medicaid and CHIP Services, Centers for Medicare & Medicaid Services . 2015. “Core Set of Children's Health Care Quality Measures for Medicaid and CHIP (child Core Set): Technical Specifications and Resource Manual for Federal Fiscal Year 2015” [accessed on March 15, 2016]. Available at https://www.medicaid.gov/Medicaid-CHIP-Program-Information/By-Topics/Quality-of-Care/Downloads/Medicaid-and-CHIP-Child-Core-Set-Manual.pdf
- Charles, C. , Gafni A., and Whelan T.. 1997. “Shared Decision‐Making in the Medical Encounter: What Does It Mean? (or It Takes at Least Two to Tango).” Social Science & Medicine 44 (5): 681–92. [DOI] [PubMed] [Google Scholar]
- Charles, C. , Gafni A., and Whelan T.. 1999. “Decision‐Making in the Physician‐Patient Encounter: Revisiting the Shared Treatment Decision‐Making Model.” Social Science & Medicine 49: 651–61. [DOI] [PubMed] [Google Scholar]
- Children's Health Insurance Program Reauthorization Act . 2009. “Children's Health Insurance Program Reauthorization Act, 111‐3” [accessed on March 15, 2016]. Available at http://www.gpo.gov/fdsys/pkg/BILLS-111hr2enr/pdf/BILLS-111hr2enr.pdf
- Cohen, S. B. , and Yu W.. 2006. The Persistence in the Level of Health Expenditures over Time: Estimates for the U.S. Population, 2002–2003. Statistical Brief 124. Rockville, MD: Agency for Healthcare Research and Quality; [accessed on March 15, 2016]. Available at http://meps.ahrq.gov/mepsweb/data_files/publications/st124/stat124.pdf [PubMed] [Google Scholar]
- Coker, T. R. , Rodriguez M. A., and Flores G.. 2010. “Family‐Centered Care for US Children with Special Health Care Needs: Who Gets It and Why?” Pediatrics 125 (6): 1159–67. [DOI] [PubMed] [Google Scholar]
- Committee on Hospital Care and Institute for Patient‐ and Family‐Centered Care . 2012. “Patient‐ and Family‐Centered Care and the Pediatrician's Role.” Pediatrics 129 (2): 394–404. [DOI] [PubMed] [Google Scholar]
- Denboba, D. , McPherson M. G., Kenney M. K., Strickland B., and Newacheck P. W.. 2006. “Achieving Family and Provider Partnerships for Children with Special Health Care Needs.” Pediatrics 118: 1607–15. [DOI] [PubMed] [Google Scholar]
- Dwamena, F. , Holmes‐Rovner M., Gaulden C. M., Jorgenson S., Sikorskii A., Lewin S., Smith R. C., Coffey J., Olomu A., and Beasley M.. 2012. “Interventions for Providers to Promote a Patient‐Centred Approach in Clinical Consultations (Review).” Cochrane Database of Systematic Reviews 12: CD003267. doi:10.1002/14651858.CD003267.pub2. [DOI] [PMC free article] [PubMed] [Google Scholar]
- Ezzati‐Rice, T. M. , Rohde F., and Greenblatt J.. 2008. Sample Design of the Medical Expenditure Panel Survey Household Component, 1998–2007. Methodology Report 22. Rockville, MD: Agency for Healthcare Research and Quality. [Google Scholar]
- Fiks, A. G. , Guevara J. P., Localio A., Alessandrini E., and Asch D.. 2010. “Shared Decision‐Making in Pediatrics: A National Perspective.” Pediatrics 126 (2): 306. [DOI] [PMC free article] [PubMed] [Google Scholar]
- Fiks, A. G. , Hughes C. C., Gafen A., Guevara J. P., and Barg F. K.. 2011. “Contrasting Parents' and Pediatricians' Perspectives on Shared Decision‐Making in ADHD.” Pediatrics 127: e188–96. doi:10.1542/peds.2010‐1510. [DOI] [PMC free article] [PubMed] [Google Scholar]
- Fiks, A. G. , Mayne S. A., Localio R., Alessandrini E. A., and Guevara J. P.. 2012a. “Shared Decision‐Making and Health Care Expenditures among Children with Special Health Care Needs.” Pediatrics 129: 99–107. [DOI] [PMC free article] [PubMed] [Google Scholar]
- Fiks, A. G. , Mayne S., Localio A. R., Feudtner C., Alessandrini E. A., and Guevara J. P.. 2012b. “Shared Decision Making and Behavioral Impairment: A National Study among Children with Special Health Care Needs.” BMC Pediatrics 12: 153. [DOI] [PMC free article] [PubMed] [Google Scholar]
- Gabe, J. , Olumide G., and Bury M.. 2004. “‘It Takes Three to Tango’: A Framework for Understanding Patient Partnership in Paediatric Clinics.” Social Science & Medicine 59: 1071–9. [DOI] [PubMed] [Google Scholar]
- Guerrero, A. D. , Chen J., Inkelas M., Rodriguez H. P., and Ortega A. N.. 2010. “Racial and Ethnic Disparities in Pediatric Experiences of Family‐Centered Care.” Medical Care 48 (4): 388–93. [DOI] [PMC free article] [PubMed] [Google Scholar]
- Hargraves, J. L. , Hays R. D., and Cleary P. D.. 2003. “Psychometric Properties of the Consumer Assessment of Health Plans Study (CAHPS) 2.0 Adult Core Survey.” Health Services Research 38 (6): 1509–27. [DOI] [PMC free article] [PubMed] [Google Scholar]
- Holm, S. 1979. “A Simple Sequentially Rejective Multiple Test Procedure.” Scandinavian Journal of Statistics 6 (2): 65–70. [Google Scholar]
- Institute of Medicine . 2001. Crossing the Quality Chasm: A New Health System for the 21st Century. Washington, DC: National Academy Press; [accessed on September 2, 2014]. Available at http://www.nap.edu/books/0309072808/html/ [Google Scholar]
- Johnson, B. , Abraham M., Conway J., Simmons L., Edgman‐Levitan S., Sodomka P., Schlutcter J., and Ford D.. 2008. Partnering with Patients and Families to Design a Patient and Family‐Centered Health Care System: Recommendations and Promising Practices. Bethesda, MD: Institute for Patient‐ and Family‐Centered Care. [Google Scholar]
- Keele, L. , and Kelly N. J.. 2006. “Dynamic Models for Dynamic Theories: The Ins and Outs of Lagged Dependent Variables.” Political Analysis 14 (2): 186–205. [Google Scholar]
- King, R. G. , and Thomas J. K.. 2003. Partial Adjustment without Apology. NBER Working Paper Series 9946. Cambridge, MA: National Bureau of Economic Research; [accessed on December 1, 2015]. Available at http://www.nber.org/papers/w9946 [Google Scholar]
- Kirby, J. B. 2010. Main Reason for Not Having a Usual Source of Care: Differences by Race/Ethnicity, Income, and Insurance Status, 2007. Statistical Brief 308. Rockville, MD: Agency for Healthcare Research and Quality; [accessed on March 15, 2016]. Available at http://meps.ahrq.gov/mepsweb/data_files/publications/st308/stat308.shtml [Google Scholar]
- Kuhlthau, K. A. , Bloom S., Cleave J. V., Knapp A. A., Romm D., Klatka K., Homer C. J., Newacheck P. W., and Perrin J. M.. 2011. “Evidence for Family‐Centered Care for Children with Special Health Care Needs: A Systematic Review.” Academic Pediatrics 11 (2): 136–43. [DOI] [PubMed] [Google Scholar]
- Kuo, D. Z. , Bird T. M., and Tilford J. M.. 2011. “Associations of Family‐Centered Care with Health Care Outcomes for Children with Special Health Care Needs.” Maternal and Child Health Journal 15 (6): 794–805. [DOI] [PubMed] [Google Scholar]
- Kuo, D. Z. , Frick K. D., and Minkovitz C. S.. 2011. “Association of Family‐Centered Care with Improved Anticipatory Guidance Delivery and Reduced Unmet Needs in Child Health Care.” Maternal and Child Health Journal 15 (8): 1228–37. [DOI] [PubMed] [Google Scholar]
- Kuo, D. Z. , Houtrow A. J., Arango P., Kuhlthau K. A., Simmons J. M., and Neff J. M.. 2012a. “Family‐Centered Care: Current Applications and Future Directions in Pediatric Health Care.” Maternal and Child Health Journal 16: 297–305. doi:10.1007/s10995‐011‐0751‐7. [DOI] [PMC free article] [PubMed] [Google Scholar]
- Kuo, D. Z. , Sisterhen L. L., Sigrest T. E., Biazo J. M., Aitken M. M., and Smith C. E.. 2012b. “Family Experiences and Pediatric Health Services Use Associated with Family‐Centered Rounds.” Pediatrics 130: 299–305. doi:10.1542/peds.2011‐2623. [DOI] [PMC free article] [PubMed] [Google Scholar]
- Lewis, M. A. , DeVellis B. M., and Sleath B.. 2002. “Social Influence and Interpersonal Communication” In Health Behavior and Health Education: Theory, Research, and Practice, edited by Glanz K., Rimer B. K., and Viswanath K., pp. 240–64. San Francisco, CA: Jossey‐Bass. [Google Scholar]
- Liptak, G. S. , Shone L. P., Auinger P., Dick A. W., Ryan S. A., and Szilagyi P. G.. 2006. “Short‐Term Persistence of High Health Care Costs in a Nationally Representative Sample of Children.” Pediatrics 118 (4): e1001–9. [DOI] [PubMed] [Google Scholar]
- Little, R. , and Rubin D.. 2002. Statistical Analysis with Missing Data Second. Hoboken, NJ: Wiley‐InterScience. [Google Scholar]
- Machlin, S. , Chowdhury S., Ezzati‐Rice T. M., DiGaetano R., Goksel H., Wun L., Yu W., and Kashihara D.. 2010. Estimation Procedures for the Medical Expenditure Panel Survey Household Component. Methodology Report 24. Rockville, MD: Agency for Healthcare Research and Quality; [accessed on September 8, 2014]. Available at http://www.meps.ahrq.gov/mepsweb/data_files/publications/mr24/mr24.pdf [Google Scholar]
- Magasi, S. , Ryan G., Revicki D., Lenderking W., Hays R. D., Brod M., Snyder C., Boers M., and Cella D.. 2012. “Content Validity of Patient‐Reported Outcome Measures: Perspectives from a PROMIS Meeting.” Quality of Life Research 21: 739–46. [DOI] [PubMed] [Google Scholar]
- McDonald, K. , Schultz E., Pineda N., Lonhart J., Chapman T., and Davies S.. 2012. Care Coordination Accountability Measures for Primary Care Practice. AHRQ Publication No. 12‐0019‐EF. Rockville, MD: Stanford University Center for Primary Care and Outcomes Research. [Google Scholar]
- Medical Home Initiatives for Children with Special Needs Project Advisory Committee . 2004. “Health Care System and/or Improve the Health of All Children Policy Statement: Organizational Principles to Guide and Define the Child.” Pediatrics 113 (4): 1545–7. [PubMed] [Google Scholar]
- Mistry, K. B. , Minkovitz C. S., Riley A. W., Johnson S. B., Grason H. A., Dubay L. C., and Guyer B.. 2012. “A New Framework for Childhood Health Promotion: The Role of Policies and Programs in Building Capacity and Foundations of Early Childhood Health.” American Journal of Public Health 102: 1688–96. [DOI] [PMC free article] [PubMed] [Google Scholar]
- Monheit, A. C. 2003. “Persistence in Health Expenditures in the Short Run: Prevalence and Consequences.” Medical Care 41 (7 Suppl.): III‐53–III‐4. [DOI] [PubMed] [Google Scholar]
- Opel, D. J. , Heritage J., Taylor J. A., Mangione‐Smith R., Sallas H. S., DeVere V., Zhou C., and Robinson J. D.. 2013. “The Architecture of Provider‐Parent Vaccine Discussions at Health Supervision Visits.” Pediatrics 132 (6): 1037–46. [DOI] [PMC free article] [PubMed] [Google Scholar]
- Patient Protection and Affordable Care Act . 2010. “Patient Protection and Affordable Care Act, 111‐148” [accessed on March 15, 2016]. Available at https://www.gpo.gov/fdsys/pkg/PLAW-111publ148/pdf/PLAW-111publ148.pdf
- Raphael, J. L. , Mei M., Brousseau D. C., and Giordano T. P.. 2011. “Associations between Quality of Primary Care and Health Care Use among Children with Special Health Care Needs.” Archives of Pediatrics & Adolescent Medicine 165 (5): 399–404. [DOI] [PubMed] [Google Scholar]
- Romaire, M. A. , Bell J. F., and Grossman D. C.. 2012a. “Health Care Use and Expenditures Associated with Access to the Medical Home for Children and Youth.” Medical Care 50 (3): 262–9. [DOI] [PubMed] [Google Scholar]
- Romaire, M. A. , Bell J. F., and Grossman D. C.. 2012b. “Medical Home Access and Health Care Use and Expenditures among Children with Special Health Care Needs.” Archives of Pediatrics & Adolescent Medicine 166 (4): 323–30. [DOI] [PubMed] [Google Scholar]
- Roter, D. L. , and Hall J. A.. 1992. Doctors Talking with Patients, Patients Talking with Doctors: Improving Communication in Medical Visits. Westport, CT: Auburn House. [Google Scholar]
- Shadish, W. R. , Cook T. D., and Campbell D. T.. 2002. Experimental and Quasi‐Experimental Designs for Generalized Causal Inference. Boston, MA: Houghton Mifflin. [Google Scholar]
- Shields, L. , Pratt J., and Hunter J.. 2006. “Family Centred Care: A Review of Qualitative Studies.” Journal of Clinical Nursing 15 (10): 1317–23. [DOI] [PubMed] [Google Scholar]
- Shields, L. , Zhou H., Pratt J., Taylor M., Hunter J., and Pascoe E.. 2012. “Family‐Centred Care for Hospitalised Children Aged 0‐12 Years (Review).” Cochrane Database of Systematic Reviews 12: CD004811. doi:10.1002/14651858.CD004811.pub3. [DOI] [PMC free article] [PubMed] [Google Scholar]
- Smalley, L. P. , Kenney M. K., Denboba D., and Strickland B.. 2014. “Family Perceptions of Shared Decision‐Making with Health Care Providers: Results of the National Survey of Children with Special Health Care Needs, 2009–2010.” Maternal and Child Health Journal 18: 1316–27. doi:10.1007/s10995‐013‐1365‐z. [DOI] [PubMed] [Google Scholar]
- StataCorp . 2013. Stata Statistical Software: Release 13. College Station, TX: StataCorp LP. [Google Scholar]
- Sterne, J. , White I., Carlin J., Spratt M., Royston P., Kenward M., Wood A., and Carpenter J.. 2009. “Multiple Imputation for Missing Data in Epidemiological and Clinical Research: Potential and Pitfalls.” British Medical Journal 339: 157–60. [DOI] [PMC free article] [PubMed] [Google Scholar]
- Strickland, B. B. , Jones J. R., Newacheck P. W., Bethell C. D., Blumberg S. J., and Kogan M. R.. 2014. “Assessing Systems Quality in a Changing Health Care Environment: The 2009–10 National Survey of Children with Special Health Care Needs.” Maternal and Child Health Journal 19 (2): 353–61. [DOI] [PMC free article] [PubMed] [Google Scholar]
- Thompson, L. A. , Knapp C. A., Saliba H., Giunta N., Shenkman E. A., and Nackashi J.. 2009. “The Impact of Insurance on Satisfaction and Family‐Centered Care for CSHCN.” Pediatrics 124: S420–7. [DOI] [PubMed] [Google Scholar]
- U.S. Department of Health and Human Services . 2014. “Healthy People 2020” [accessed on September 2, 2014]. Available at http://www.healthypeople.gov/2020/topicsobjectives2020/objectiveslist.aspx?topicId=26
- U.S. Department of Health and Human Services, Health Resources and Services Administration, Maternal and Child Health Bureau . n.d. “Achieving & Measuring Success: A National Agenda for Children with Special Health Care Needs” [accessed on September 2, 2014]. Available at http://www.mchb.hrsa.gov/programs/specialneeds/achievingsuccess.html
- White, I. R. , Royston P., and Wood A. M.. 2011. “Multiple Imputation Using Chained Equations: Issues and Guidance for Practice.” Statistics in Medicine 30: 377–99. [DOI] [PubMed] [Google Scholar]
- Wyatt, K. D. , List B., Brinkman W. B., Lopez G. P., Asi N., Erwin P., Wang Z., Garces J. P. D., Montori V. M., and LeBlanc A.. 2015. “Shared Decision Making in Pediatrics: A Systematic Review and Meta‐Analysis.” Academic Pediatrics 15 (6): 573–83. [DOI] [PubMed] [Google Scholar]
Associated Data
This section collects any data citations, data availability statements, or supplementary materials included in this article.
Supplementary Materials
Appendix SA1: Author Matrix.
Appendix SA2: Health Care Outcomes and Covariates Examined in Relation to FCC/SDM Measures Using the MEPS‐HC.