

Abstract
Objective
The median time required to perform a surgical procedure is important in determining payment under Medicare's physician fee schedule. Prior studies have demonstrated that the current methodology of using physician surveys to determine surgical times results in overstated times. To measure surgical times more accurately, we developed and validated a methodology using available data from anesthesia billing data and operating room (OR) records.
Data Sources
We estimated surgical times using Medicare 2011 anesthesia claims and New York Statewide Planning and Research Cooperative System 2011 OR times. Estimated times were validated using data from the National Surgical Quality Improvement Program. We compared our time estimates to those used by Medicare in the fee schedule.
Study Design
We estimate surgical times via piecewise linear median regression models.
Principal Findings
Using 3.0 million observations of anesthesia and OR times, we estimated surgical time for 921 procedures. Correlation between these time estimates and directly measured surgical time from the validation database was 0.98. Our estimates of surgical time were shorter than the Medicare fee schedule estimates for 78 percent of procedures.
Conclusions
Anesthesia and OR times can be used to measure surgical time and thereby improve the payment for surgical procedures in the Medicare fee schedule.
Keywords: Intraservice time, Medicare, resource‐based relative value scale
In 2014, an estimated $87 billion was paid for services furnished to Medicare beneficiaries by physicians and other practitioners using the resource‐based relative value scale (RBRVS) (Centers for Medicare & Medicaid Services [CMS] 2014). Under the RBRVS, each medical service that clinicians provide has an associated Current Procedural Terminology (CPT) code that is valued in relative value units (RVUs) (Hsiao et al. 1988a,b). Work RVUs measure a physician's personal time and effort associated with the procedure. RVUs are converted into a payment using a dollar‐per‐RVU conversion factor. Medicare's current process for valuing services relies on recommendations of the American Medical Association/Specialty Society Relative Value Scale Update Committee (RUC).
There have been concerns that many physician services are misvalued in the RBRVS. In this context, value refers to the relationship between RVUs allocated and resources required to perform a service, rather than the benefit a patient receives. If a procedure is overvalued (i.e., RVUs allocated are too high), physicians may have a monetary incentive to provide it over a more appropriate alternative; if a procedure is undervalued, the service may be hard to obtain. Moreover, systematic over‐ or undervaluing of procedures that each specialty furnishes can distort overall compensation levels across specialties. The impact of misvaluation goes beyond Medicare because private insurers, Medicaid, and even the Veterans Health Administration use the RBRVS's RVUs for payment or measuring productivity.
One key driver of valuation is the time required to perform the service, or surgical time (also called intraservice or skin‐to‐skin time). For some procedures (e.g., cardiac catheterization) where there is no incision per se, surgical time captures a similar concept (e.g., the time elapsed between entry and exit into the blood vessel). Surgical time explains 91 percent of the variation in total work RVUs assigned to a procedure (Wynn et al. 2015). The surgical time estimates used by the RUC and Medicare come primarily from physician surveys conducted by physician specialty societies. These surveys often have low sample sizes (less than 30 for 10 percent of the surveys), and the median response rate was 2.2 percent in payment year 2015 (Government Accountability Office [GAO] 2015).
Prior studies have shown that the surgical times used by Medicare and the RUC are systematically higher than the times objectively measured using chart abstraction and operating room records (McCall, Cromwell, and Braun 2006; Rich 2007; Cromwell et al. 2010). The Medicare Payment Advisory Commission (MedPAC) has recommended that instead of surveys Medicare use “data collected from physician offices and other settings where practitioners provide care” (Medicare Payment Advisory Commission 2011). This paper is motivated by MedPAC's recommendation. The valuation of surgical procedures could be improved if both Medicare and the RUC had access to an objective estimate of surgical time for a given procedure using readily available data. Data availability is critical to make the valuation process transparent and also to allow for regular measurements of surgical times to capture changes from improved technology or changing patient populations. A 2015 report from the Government Accounting Office on the RBRVS emphasized the need for a more transparent process using better data.
Direct measures of surgical time are not widely available. We described a method for estimating surgical time using Medicare claims for anesthesia services and a publicly available dataset that contains operating room (OR) times. Our methods build upon and extend work done by Silber et al. (2007, 2011), who proposed using anesthesia claims to determine surgical times. We expand Silber's methods to cover a broader range of procedures including shorter procedures (for which naïve application of the Silber methodology yields negative surgical time estimates). Furthermore, we also expand the methodology to apply to operating room times, which allows for broader application of the methodology.
To validate the surgical time estimates, we compare our estimates to surgical times measured directly. Our validation dataset is not easily accessible by Medicare or the public. Finally, we compare the time estimates from our analyses to the time estimates currently used by Medicare and the RUC to value physician services.
Methods
Anesthesia, Operating Room, and Surgical Times
To estimate surgical times, we must quantify the relationships between anesthesia, OR, and surgical times. Anesthesia time refers to the time that an anesthesia provider bills for his or her services with a Medicare patient. According to Medicare billing instructions, “it is defined as the period during which an anesthesia practitioner is present with the patient. It starts when the anesthesia practitioner begins to prepare the patient for anesthesia services in the operating room or an equivalent area and ends when the anesthesia practitioner is no longer furnishing anesthesia services to the patient, that is, when the patient may be placed safely under postoperative care. Anesthesia time is a continuous time period from the start of anesthesia to the end of an anesthesia service.” OR time starts when a patient enters the operating room and concludes when the patient is moved to a recovery room. Surgical time refers to the “intraservice” or “skin‐to‐skin” time, starting when the physician makes the first incision and ends when sutures are finished.
While anesthesia and OR times are related to surgical time, they are not equivalent to surgical time. The estimated surgical time is typically a fraction of the anesthesia time because anesthesia is given before the surgery begins and concludes after the procedure has finished. OR time includes positioning, which is not a portion of Medicare's definition of the surgical time and also includes time from the closing of incision until the patient leaves the OR.
One fundamental difficulty that motivated this research is that no single data source has time data that cover the full CPT system. Therefore, we have had to use multiple sources, which we now describe.
Data
Primary Sources of Time Observations: Medicare Anesthesia Claims and SPARCS
Our goal was to use data sources readily available to Medicare and other groups. We used two such data sources. The first is all 2011 anesthesia claims billed for a Medicare beneficiary. Medicare anesthesia claims are billed in complete, or fractions of, 15‐minute increments. Using the beneficiary identifier and date and place of service, these data can be linked to the relevant surgery and its CPT code. Following Silber's methodology, if multiple anesthesia claims are found for a beneficiary on a given day, we used the longest anesthesia time. Given that the anesthesia time is used to determine anesthesia payment, there are legal consequences if anesthesia times are misreported. We therefore believe that it is a reliable source of time information, though Silber et al. (2011) report evidence that some anesthesia providers tend to round up to the nearest 15‐minute increment, as evidenced by a 5‐minute average difference between charted and billed anesthesia times. Across all procedures, this data source provides 3.6 million time observations.
By definition, the anesthesia claims data only include surgical services that involve an anesthesia provider. Many surgical services do not regularly include anesthesia or typically are performed with conscious sedation. Hence, we also used data from the New York Statewide Planning and Research Cooperative System (SPARCS) system. SPARCS collects “patient level detail on patient characteristics, diagnoses and treatments, services, and charges for every hospital discharge, ambulatory surgery patient, and emergency department admission in New York State” (New York State Department of Health, 2007). Both hospitals and ambulatory surgery centers in New York report on outpatient procedures including the CPT code and the OR time: “This time should have been calculated from actual entry into the ambulatory surgery operating room and should have ended at actual departure from the ambulatory surgery operating room” (New York State Department of Health, 2009). The online Supplemental Materials (Data S1) describe our data cleaning and processing steps. SPARCS does not collect OR times for inpatient procedures. SPARCS provides 1.06 million time observations.
Data to Develop the Transformations: NSAS and NSQIP
To develop our transformations from anesthesia time to OR time and from OR time to surgical time, we use two data sources. The first is the 2006 National Survey of Ambulatory Surgery (NSAS), which records OR times and surgical times, but not anesthesia times. This data source from the National Center for Health Statistics covers a wide range of procedures that are performed in hospital ambulatory settings or freestanding ambulatory surgery centers, but not the inpatient setting (Hair, Hussey, and Wynn 2012). It is not feasible to use the NSAS data to estimate CPT‐level procedure times as NSAS records procedures according to an alternative coding system, the ICD‐9 system. NSAS provides 35,155 observations.
Second, we use data from the National Surgical Quality Improvement Program (NSQIP), which is used primarily for quality improvement for participating hospitals. The American College of Surgeons administers NSQIP. NSQIP contains all three relevant time elements (anesthesia, OR, and surgical) at the CPT level. In contrast to the NSAS, which covers shorter procedures, the NSQIP focuses on major procedures performed in ambulatory facility settings or in the hospital under general, spinal, or epidural anesthesia (Khuri 2005). NSQIP data were used to estimate the anesthesia‐to‐OR transformation. NSQIP data were not used as a regular data source for surgical times as these are not easily accessible to Medicare or the public and cover a more limited set of procedures. NSQIP provides 107,220 observations.
Validation Data: NSQIP
NSQIP contains surgical times at the CPT level and therefore we are able to estimate times directly for the surgical services that it covers. We believe this is a reasonable validation dataset. In our validation, we use the OR and anesthesia time from the external data sources, and we only use the NSQIP in the development to estimate the anesthesia‐to‐OR transformation; we do not use it to derive the OR‐to‐surgical time. We limit the validation analysis to those procedure codes where there are 100 or more observations of a single procedure in the NSQIP data and our primary time data file. We applied a minimum sample size to eliminate estimates that are overly impacted by sampling variation. The data contain at least 100 anesthesia time observations for 179 distinct CPT codes.
Current Time Estimates: Medicare Fee Schedule Values
In addition to the empirical data sources discussed above, we also compare time estimates that result from the methods developed in this paper to existing surgical times used by Medicare and the RUC. These are the surgical times used to value physician work, and they are based on physician surveys conducted by the specialty societies. We limit the analysis to procedures with at least 200 observations from the combined Medicare anesthesia claims and SPARCS data to minimize sampling variation. For the SPARCS and anesthesia files, we only included times for a single procedure. The 921 procedures (of 6202 covered in the Medicare fee schedule) accounted for 67.9 percent of the total Medicare RVUs in 2013 billed for surgeries and procedures.
Analyses
Our methods build on the work of Silber et al. (2007, 2011), who studied the feasibility of using Medicare anesthesia data to estimate surgical times that were manually abstracted from patients' charts. They found that anesthesia claim times were predictive of anesthesia times that were also abstracted from patients' charts (5.1 minute median absolute error) and surgical times (13.8 minute median absolute error). Silber's 2011 estimate of the formula to transform from an observed Medicare anesthesia time to the estimated surgical time is described by:
| (1) |
where and t a are estimated surgical times and billed anesthesia times, respectively (in minutes). Their research suggests that, in aggregate, the Medicare anesthesia data may be an excellent source of typical surgical times, even if there are errors for individual clinical encounters.
Using the Silber transformation for the broad range of surgical procedures in the CPT system creates some problems. The Silber transformation was derived using longer procedures: anesthesia times that are 27 minutes or shorter are transformed to negative surgical times (Figure 1). Second, the Silber transformation uses a single formula. It could be argued that the transformation should vary based on other characteristics of an individual procedure such as anesthesia type or body system (e.g., brain surgery, orthopedic surgery). Finally, Silber and colleagues focused on using the anesthesia time to estimate the surgical time for a given surgical encounter. Our focus is slightly different. We use data from individual procedures to estimate the time for a given procedure code. The valuation of procedures under the RBRVS is specific to an individual CPT code.
Figure 1.
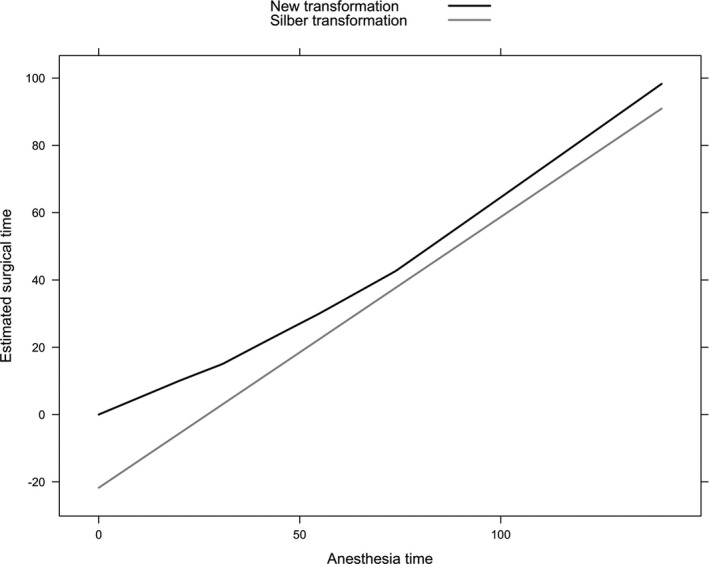
Comparison of Silber and Proposed Transformation of Anesthesia Time to Surgical Time
To estimate surgical times, we have two steps. We estimate a transformation from anesthesia‐to‐OR time. We also estimate an OR‐to‐surgical time transformation. The full anesthesia‐to‐surgical time transformation is then performed in a two‐step process by first transforming to OR time and then to surgical time. It might be preferable to estimate surgical times from anesthesia times in one step using a single data source. However, given the available data discussed above, we did not have access to data that allowed us to satisfactorily perform the one‐step estimation.
Notation
We introduce notation for three transformations: OR‐to‐surgical time, anesthesia‐to‐surgical time, and anesthesia‐to‐OR time. We denote functions that describe these transformations as f O→S, f A→S, and f A→O, respectively. For example, if we have a surgical encounter whose observed OR time is t, the value f O→S(t) is defined to estimate the surgical time for that observation. Similarly, if the observed time t′ relates to an anesthesia time, the value f A→O(t′) is defined to estimate the OR time for that procedure. The composition of two functions can be used to estimate the surgical time from the observed anesthesia time, as f A→S(t′) = f O→S(f A→O(t′)).
We will also consider transformations that depend on other characteristics such as anesthesia type and body system. We denote these additional characteristics as x so that, for instance, f O→S(t ; x) might allow for the relative amount of OR time devoted to the surgery itself to depend both on the OR time and another characteristic such as the type of anesthesia employed during the procedure.
Piecewise Linear Median Regression Models
One could assume that these transformations are linear as in the Silber estimate of f A→S , so that f A→S(t) = α+tβ for parameters α and β. While that works well for the relatively long procedures, we are interested in covering a broad range of procedures in our work. Assuming that the transformation function is linear produces either nonsensical negative time estimates for shorter procedures or poor predictions for longer procedures. Consequently, we consider piecewise linear models that allow for less rigid relationships between the various time elements. These models result in a continuous curve to describe the relationship between two time elements, but one where the slope of the curve changes at several points. Said another way, the curve is described by connected line segments, as with the black curve in Figure 1.
Although not reported, we also investigated B‐spline regression models that allow more nonlinear relationships between the time elements. We found that the simpler piecewise regression yields results that are virtually indistinguishable from the more complex B‐spline regression models.
Another consideration in building our models is the presence of long, anomalous surgical time observations that we believe may represent data errors. To minimize sensitivity of our models to such outlying observations, we employ median regression (Koenker and Bassett 1978; Koenker 2005). Median regression is qualitatively the same as standard linear regression except the fitted values describe the conditional medians of the response distribution, rather than conditional means. Furthermore, the available data also include some OR and anesthesia times that are very long (e.g., over 24 hours). Some of these times may be misreports (and because such observations would be “high‐leverage” points in regression models), we only estimate the f O→S transformation using the lower 95 percent of the OR time observations and extrapolate for longer observed times.
Results
Estimating OR Times from Anesthesia Times
Using the NSAS data, we estimated the OR‐to‐surgical time transformation (f O→S). To understand the relationship between these two time elements, we begin with exploratory analyses with linear models of the form:
| (2) |
To understand potential nonlinearities in the relationship between OR and surgical times, we fit this model on a sliding, 30‐minute window of OR times. For example, we first fit the model to observed OR times between 1 and 30 minutes, and then between 2 and 31 minutes, and so on. If the model is truly linear, we expect the parameter estimates to be relatively stable for the various windows. Because these data include outlying observations, we use robust median regressions so that the estimated surgical time in Equation (2) should be interpreted as a median, rather than a mean.
Figure S1 displays the results of these sliding windows. Scanning from left to right, the slope and intercept estimates are stable across the 30‐minute windows that are centered at times of 30 minutes or less. The estimates then go through a period of transition, with the intercept (α) decreasing and the slope (β) increasing until the window is centered around 70 minutes, at which point the parameters are relatively stable.
Hence, we estimate a transformation that is piecewise linear between 0 and 30 minutes, between 30 and 70 minutes, and 70 and 132 minutes. We estimate the regression parameters using data in the 0 to 30 minute range and the 70 to 132 minute range, and specify the transformation between 30 and 70 minutes so that the transformation is continuous and piecewise linear. In our data, 95 percent of observations are 132 minutes or shorter. Beyond 132 minutes, our estimates are less stable. We used the same transformation as 70 to 132 minutes for those longer than 132 minutes.
For the short observations, we estimate that an appropriate transformation simply multiplies the OR time by 50 percent, corresponding to median regression estimates of and . For longer services (70 minutes and greater), we estimate and . For services that are between 30 and 70 minutes, we specify the line segment that makes the transformation continuous and piecewise linear ( and ).
Estimating OR Times from Anesthesia Times
To estimate the transformation of anesthesia times into surgical times, f A→S we used NSQIP data. We estimate that anesthesia times and OR times are approximately equal (on average) for procedures with log anesthesia time below 3.0 or above 7.0. In between, OR times tend to be shorter than anesthesia times. While unexpected, this tendency is consistent across services and would seem to reflect administration of anesthesia services before entering the OR or after exiting it. Silber et al. (2011) suggested that there is some evidence that some anesthesia providers may tend to round up to the next (15 minute) anesthesia time unit, perhaps partially explaining this finding. Our estimated transformation is:
where x is the log observed anesthesia time. We perform the analyses for this transformation in the log scale because the piecewise linear modeling assumptions are better supported by the data in the log rather than minute scale.
In the right‐hand panel of Figure 2, note that after applying the transformation, the median log anesthesia times are nearly equal to the observed medians of the log OR times (compare to the left‐hand panel of Figure 2). Figure 1 displays our transformation f 0→S, which is obtained by composing f A→0 and f 0→S for comparison with the Silber et al. (2011) transformation.
Figure 2.
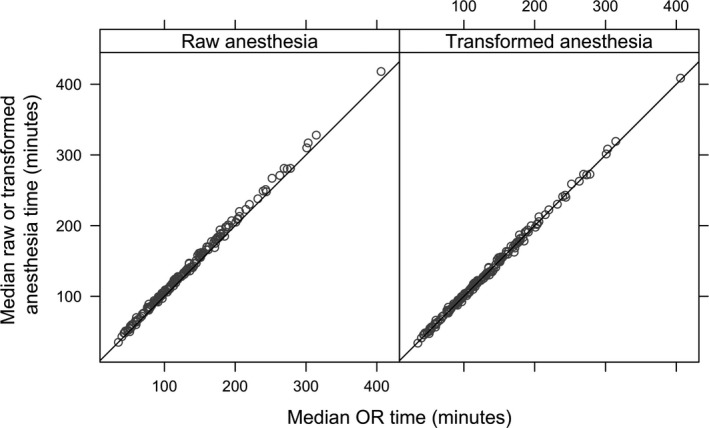
Median Anesthesia Time versus Median OR Time Using NSQIP Data
Note. The left‐hand panel is before transformation, and the right‐hand panel is after transformation.
Differences by Type of Anesthesia and Body System
We also studied whether the estimated transformation f 0→S should vary by type of anesthesia or body system of surgery. We find that the type of anesthesia (e.g., general anesthesia, regional block, spinal) has a small impact on the transformation (detailed results in the online Supplementary Materials). We fit a flexible spline model (f 0→S) that allows for different transformations based on the type of anesthesia administered. Although some indicators of anesthesia type are statistically significant, the magnitudes of the estimates are all small and therefore did not include them in the final transformation f 0→S . The estimated impact of having multiple procedures versus one was also small (less than 1 minute).
We also consider using different transformations stratified by body system on which the procedure was performed. Body system was categorized by the Clinical Classifications Software groupings. Using NSAS data, we find some evidence that the slopes may vary by body system. However, when we applied the transformation to NSQIP data, we found that transformations that allowed for differences by body system performed substantially less well than a single transformation. Specifically, the time estimates for the digestive system were too short when the body system adjustments were included, and overall, the surgical time estimates would be too short across all procedures. Hence, we determined that apparent differences seen in the NSAS may reflect anomalous observations.
Validation
We use the NSQIP data to validate the transformations derived above using services for which at least 100 observations are available in NSQIP and our combined OR and anesthesia time database (170 codes). For each code, we estimate the median surgical time directly using NSQIP data, which is the gold standard estimate and is unavailable for the vast majority of CPT codes. We compare these estimates to the surgical times that are derived from Medicare anesthesia times and SPARCS OR times. Figure 3 compares these estimates. The median surgical time estimates are generally close to one another, falling near the 45° line. Table 1 presents these time estimates for 40 most‐observed services in our anesthesia/OR time database, along with the corresponding CMS estimates. The remaining 130 codes used in the validation exercise are given in Table S2.
Figure 3.
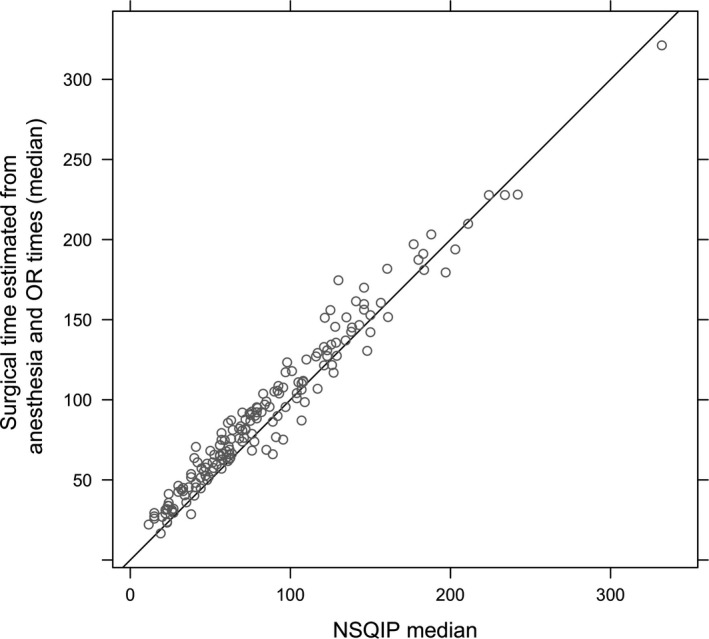
Validation Test Comparing Surgical Time from Anesthesia and OR Times and Observed Surgical Times in NSQIP*
Notes: *Restricted to 170 procedures for which at least 100 observations are available in both NSQIP and our combined OR and anesthesia time database.
Table 1.
Estimated Surgical Times from CMS, Transformed Anesthesia/OR Times, and NSQIP for the Top 40 CPT Codes by Volume in the Anesthesia/OR Time Database
| CPT | CMS Time | Transformed Anesthesia/OR Time (N) | NSQIP Median (N) |
|---|---|---|---|
| 47562 | 80 | 57 (83,801) | 57 (6,689) |
| 27447 | 100 | 98.9 (82,038) | 85 (5,302) |
| 49505 | 70 | 51.8 (52,950) | 49 (3,667) |
| 27245 | 80 | 68.1 (43,098) | 50 (554) |
| 27130 | 100 | 103.8 (39,162) | 83 (3,569) |
| 47563 | 90 | 63 (36,212) | 62 (2,352) |
| 27236 | 90 | 80.9 (33,795) | 70 (534) |
| 52601 | 75 | 53.7 (31,728) | 38 (967) |
| 29881 | 40 | 31.3 (30,501) | 22 (1,580) |
| 35301 | 120 | 111 (27,229) | 105 (2,593) |
| 52648 | 60 | 50 (20,544) | 48 (431) |
| 52235 | 45 | 33.9 (17,866) | 23.5 (410) |
| 19125 | 60 | 36 (15,271) | 35 (1,131) |
| 44970 | 73 | 51.4 (15,155) | 44 (6,001) |
| 19120 | 45 | 29.5 (15,002) | 27 (1,173) |
| 29880 | 45 | 33.8 (15,000) | 24 (449) |
| 19301 | 60 | 40.2 (14,163) | 40 (1,115) |
| 52234 | 30 | 29.3 (14,018) | 15 (659) |
| 52240 | 60 | 45.4 (13,930) | 36.5 (278) |
| 57288 | 60 | 41.2 (12,827) | 24 (847) |
| 49650 | 60 | 59.5 (12,245) | 54 (1,194) |
| 27244 | 75 | 70.6 (11,204) | 41 (299) |
| 49585 | 45 | 43 (10,378) | 33 (1,790) |
| 11042 | 15 | 16.6 (10,291) | 19 (329) |
| 63030 | 90 | 87.8 (9,597) | 72 (1,009) |
| 11043 | 30 | 23.3 (9,369) | 23 (205) |
| 27590 | 69 | 67.8 (9,136) | 60 (374) |
| 27880 | 80 | 73.9 (8,971) | 70 (468) |
| 23472 | 140 | 123.4 (8,831) | 98 (460) |
| 60500 | 120 | 86.9 (7,594) | 75 (1,201) |
| 44005 | 120 | 75.8 (7,100) | 68 (267) |
| 49507 | 70 | 61.8 (6,937) | 61 (433) |
| 44120 | 134 | 95.6 (6,836) | 87 (354) |
| 44140 | 150 | 106.3 (6,485) | 107 (621) |
| 11044 | 45 | 30.5 (6,384) | 26 (101) |
| 27814 | 90 | 74.8 (5,961) | 59 (226) |
| 44160 | 120 | 104.1 (5,924) | 104 (385) |
| 27125 | 84 | 87.2 (5,682) | 63 (451) |
| 42826 | 28 | 26.9 (5,659) | 20 (817) |
Sample sizes are reported in parentheses.
The correlation between our estimated surgical times and NSQIP surgical times is 0.98. However, our estimated times are slightly longer than the NSQIP estimates with a median absolute difference of 9.8 minutes and 82 percent of our estimates are longer than the median time estimates in NSQIP. This difference might be because the NSQIP data sample from a different population of procedures than the Medicare anesthesia and SPARCS data. In a sensitivity analysis, we compared the surgical times derived from NSQIP anesthesia time using our transformation to the surgical times that are directly observed for the same surgical encounters. The correlation coefficient between the two is 0.992.
Empirical versus CMS Surgical Times
When we compare the empirical time estimates to fee schedule estimates, the correlation between the two estimates is 0.89 (Figure 4), and the median absolute difference is 15.1 minutes. For these services, 78 percent of the CMS estimates are longer than our estimates. The difference in surgical time estimates for some procedures between our estimates and current CMS values can be quite large. For example, we estimate for CPT 67228 (treatment of retinal lesion) that the surgical time is approximately half as long (34.8 minutes) as the CMS estimate (60 minutes).
Figure 4.
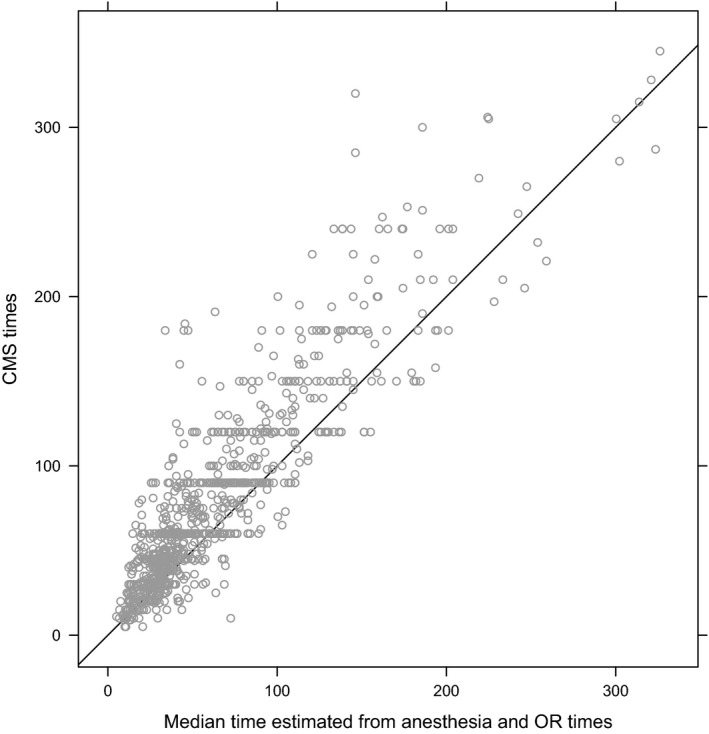
CMS Surgical Times Compared to Median Surgical Times Estimated Using Medicare Anesthesia and SPARCS OR Times
Discussion
Median surgical times are a key component in the allocation of RVUs in the Medicare fee schedule. Although surgical times are not routinely collected for publicly available data sources, we have extended the work of Silber et al. (2007, 2011) to estimate typical surgical times using widely available anesthesia and OR times. Validation analyses indicate that the proposed methodology performs well.
Policy Considerations
A number of sources have highlighted that on average the times used by the RUC and CMS to value procedures are too long (e.g., McCall, Cromwell, and Braun 2006; Rich 2007; Cromwell et al. 2010; Zuckerman et al. 2014). Given the importance of surgical time in valuing procedures, it is important for them to be as accurate as possible. Our methodology can improve the current process in a number of ways. CMS can use our time values as a mechanism to validate RUC values. Procedures whose typical times are substantially overstated (or understated) in the Medicare fee schedule or RUC process merit heightened scrutiny as potentially misvalued services. The RUC could also use our time estimates in their deliberations. To date, the RUC has almost exclusively focused on physician surveys to estimate time, but the RUC could decide (or CMS could mandate) that available time data from external databases should be used as part of the valuation process.
One concern with our methodology is that we indirectly measure surgical time using anesthesia and operating room times. There are large databases such as those run by the Society of Thoracic Surgery that directly measure surgical times reported by facilities. Our research emphasizes that using data from those sources could improve the valuation of procedures. CMS could even consider requiring clinicians to regularly report times as a condition for receiving Medicare payments. While this would facilitate direct measurement, this additional reporting would come at a cost for clinicians and their practices and entail additional costs for validating the reported times. Given those costs, we would argue that utilizing anesthesia and OR times might be a better alternative to mandating physicians report surgical times.
We found surgical times used in the CMS fee schedule were on average too long. Whether that implies that surgical procedures are overvalued is less clear. It depends on two issues. The first issue is intensity, the other key component of the valuation process. It is possible that the intensity values used in the CMS fee schedule for surgical procedures may be too low. We see no clear reason why this might systematically be the case, but we were unable to empirically evaluate this issue. The second issue is whether the time values for other types of physician services are also too long. Further study is needed to determine if, for example, radiology, office‐based procedures, and evaluation and management visits also have inflated fee schedule times. For example, Cromwell et al. (2006) report that average office visit times that were estimated using CPT coding guidelines were approximately 9 percent longer than office visit times that were estimated using the National Ambulatory Medical Care Survey; the guideline times were found to be only slightly longer for Family Practice and Internal Medicine office visits (3 and 4 percent, respectively). More of this type of information is needed to determine whether surgical services are overvalued relative to other types of services. However, at a minimum our findings of the inaccuracies within surgical procedures point toward valuation inequities among surgical practice patterns and specialties.
Limitations
There are several limitations to our work. The transformations we use may not work for a small set of procedures. For example, procedures that are often performed under emergency circumstances may have different workflows that are poorly described by our transformations. Our main OR‐to‐surgical time transformation was derived using ambulatory surgery data. Our surgical estimates are longer than the directly observed values in NSQIP though the differences are relatively small. NSQIP, our validation dataset, is limited to longer and more complex surgeries, and we cannot confirm that our surgical time transformation applies to the full range of surgical procedures. NSAS does not contain information on whether multiple surgeons or assistants at surgery took part in the procedure. Our data sources lacked time estimates for procedures performed almost always in outpatient physician offices. If such data became available, the framework we have created could be used to incorporate these new data sources.
Our goal was to develop and test an estimate of surgical times using anesthesia and OR times accessible to Medicare. Our validation results suggest that the transformation yields accurate surgical times at the procedure code level.
The comparison of our surgical time estimates and current CMS estimates echo prior research that current CMS estimates tend to overstate the time that is typically required to perform most services. In contrast to prior work, our methodology uses data sources regularly available to Medicare across a wider range of services, conforming to the Government Accountability Office's recent call to leverage new data sources as part of a more transparent rate setting process (Government Accountability Office [GAO] 2015) and may thereby improve the valuation of surgical procedures in the fee schedule.
Supporting information
Appendix SA1: Author Matrix.
Data S1. Data Cleaning and Processing Steps.
Acknowledgments
Joint Acknowledgment/Disclosure Statement: Support for this work comes from a contract from the Centers for Medicare and Medicaid Services.
Disclosures: None.
Disclaimers: None.
References
- Centers for Medicare & Medicaid Services [CMS] . 2014. “Medicare Program; Revisions to Payment Policies under the Physician Fee Schedule, Clinical Laboratory Fee Schedule, Access to Identifiable Data for the Center for Medicare and Medicaid Innovation Models & Other Revisions to Part B for CY 2015 (CMS‐1612‐FC).” Federal Register, 79, 219 [accessed on November 13, 2014]. Available at https://www.federalregister.gov/articles/2014/11/13/2014-26183/medicare-program-revisions-to-payment-policies-under-the-physician-fee-schedule-clinical-laboratory [PubMed] [Google Scholar]
- Cromwell, J. , Hoover S., McCall N., and Braun P.. 2006. “Validating CPT Typical Times for Medicare Office Evaluation and Management (E/M) Services.” Medical Care Research and Review: MCRR 63 (2): 236–55. [DOI] [PubMed] [Google Scholar]
- Cromwell, J. , McCall N., Dalton K., and Braun P.. 2010. “Missing Productivity Gains in the Medicare Physician Fee Schedule: Where Are They?” Medical Care Research Review 67 (6): 676–93. [DOI] [PubMed] [Google Scholar]
- Government Accountability Office [GAO] . 2015. “Medicare Physician Payment Rates: Better Data and Greater Transparency Could Improve Accuracy.” GAO‐15‐434. [accessed on June 26, 2015]. Available at http://www.gao.gov/assets/680/670366.pdf
- Hair, B. , Hussey P., and Wynn B.. 2012. “A Comparison of Ambulatory Perioperative Times in Hospitals and Freestanding Centers.” American Journal of Surgery 204 (1): 23–7. [DOI] [PMC free article] [PubMed] [Google Scholar]
- Hsiao, W. C. , Braun P., Dunn D., Becker E. R., DeNicola M., and Ketcham T. R. 1988a. “Results and Policy Implications of the Resource‐Based Relative‐Value Study.” New England Journal of Medicine 319 (13): 881–8. [DOI] [PubMed] [Google Scholar]
- Hsiao, W. C. , Braun P., Dunn D., Becker E. R., DeNicola M., and Ketcham T. R. 1988b. “Estimating Physicians' Work for a Resource‐Based Relative‐Value Scale.” New England Journal of Medicine 319 (13): 835–41. [DOI] [PubMed] [Google Scholar]
- Khuri, S. F. 2005. “The NSQIP: A New Frontier in Surgery.” Surgery 138 (5): 837–43. [DOI] [PubMed] [Google Scholar]
- Koenker, R. 2005. Quantile Regression (No. 38). New York: Cambridge University Press. [Google Scholar]
- Koenker, R. , and Bassett G. Jr. 1978. “Regression Quantiles.” Econometrica 46 (1): 33–50. [Google Scholar]
- McCall, N. , Cromwell J., and Braun P.. 2006. “Validation of Physician Survey Estimates of Surgical Time Using Operating Room Logs.” Medical Care Research and Review 63 (6): 764–77. [DOI] [PubMed] [Google Scholar]
- Medicare Payment Advisory Commission . 2011. Report to the Congress: Medicare and the Health Care Delivery System. Washington, DC: Medicare Payment Advisory Commission. [Google Scholar]
- New York State Department of Health . 2007. “SPARCS Overview” [accessed on January 2, 2013]. Available at http://www.health.ny.gov/statistics/sparcs/operations/overview.htm
- New York State Department of Health . 2009. “SPARCS: X12‐837 Input Data Specifications” [accessed on October 29, 2013]. Available at http://www.health.ny.gov/statistics/sparcs/sysdoc/input5010.pdf
- Rich, W. L. III . 2007. “RUC Letter to Jeffrey A. Alexander about McCall Study.” February 8, 2007.
- Silber, J. H. , Rosenbaum P. R., Zhang X., and Even‐Shoshan O.. 2007. “Estimating Anesthesia and Surgical Procedure Times from Medicare Anesthesia Claims.” Anesthesiology 106 (2): 346–55. [DOI] [PubMed] [Google Scholar]
- Silber, J. H. , Rosenbaum P. R., Even‐Shoshan O., Mi L., Kyle F., Teng Y., and Fleisher L. A.. 2011. “Estimating Anesthesia Time Using the Medicare Claim: A Validation Study.” Anesthesiology 115 (2): 322. [DOI] [PMC free article] [PubMed] [Google Scholar]
- Wynn, B. , Burgette L., Mulcahy A., Okeke E., Brantley I., Iyer N., Ruder T., and Mehrotra A.. 2015. “Development of a Model for the Validation of Work Relative Value Units for the Medicare Physician Fee Schedule.” RAND/RR‐662‐CMS. [accessed on August 25, 2015]. Available at http://www.rand.org/pubs/research_reports/RR662.html [PMC free article] [PubMed]
- Zuckerman, S. , Berenson R., Merrell K., Oberlander T., McCall N., Lewis R., Mitchell S., and Shrestha M.. 2014. “Development of a Model for the Valuation of Work Relative Value Units: Objective Service Time Task Status Report” [accessed on June 26, 2015]. Available at http://www.cms.gov/Medicare/Medicare-Fee-for-Service-Payment/PhysicianFeeSched/Downloads/RVUs-Validation-Urban-Interim-Report.pdf
Associated Data
This section collects any data citations, data availability statements, or supplementary materials included in this article.
Supplementary Materials
Appendix SA1: Author Matrix.
Data S1. Data Cleaning and Processing Steps.