

Abstract
Objective
To create and test three prospective, increasingly restrictive definitions of serious illness.
Data Sources
Health and Retirement Study, 2000–2012.
Study Design
We evaluated subjects’ 1‐year outcomes from the interview date when they first met each definition: (A) one or more severe medical conditions (Condition) and/or receiving assistance with activities of daily living (Functional Limitation); (B) Condition and/or Functional Limitation and hospital admission in the last 12 months and/or residing in a nursing home (Utilization); and (C) Condition and Functional Limitation and Utilization. Definitions are increasingly restrictive, but not mutually exclusive.
Data Collection
Of 11,577 eligible subjects, 5,297 met definition A; 3,151 definition B; and 1,447 definition C.
Principal Findings
One‐year outcomes were as follows: hospitalization 33 percent (A), 44 percent (B), 47 percent (C); total average Medicare costs $20,566 (A), $26,349 (B), and $30,828 (C); and mortality 13 percent (A), 19 percent (B), 28 percent (C). In comparison, among those meeting no definition, 12 percent had hospitalizations, total Medicare costs averaged $7,789, and 2 percent died.
Conclusions
Prospective identification of older adults with serious illness is feasible using clinically accessible criteria and may be a critical step toward improving health care value. These definitions may aid clinicians and health systems in targeting patients who could benefit from additional services.
Keywords: Medicare, population health, geriatrics, palliative medicine
Health care spending is extremely concentrated. The top 5 percent of spenders account for nearly 60 percent of health care costs (The Lewin Group 2010; National Institute for Health Care Management Foundation 2012; Aldridge and Kelley 2015; Commonwealth Foundation 2015; Institute of Medicine 2015). This spending is neither easily predictable nor consistent overtime. Only 11 percent of the highest cost individuals are in the last year of life, while even fewer have predictable prognoses (Aldridge and Kelley 2015). Despite highly concentrated spending, care of this patient population is often poorly coordinated, marked by inadequate symptom control and low patient and family satisfaction, and may be inconsistent with personal goals and preferences (Field and Cassel 1997; Hanson, Danis, and Garrett 1997; Teno et al. 2004; Mitchell et al. 2009; Institute of Medicine 2015).
Health care reform aims to improve the value (i.e., raise quality while holding stable or lowering costs) of care for these highest cost seriously ill patients. In select groups, palliative care interventions (including an interdisciplinary team of physicians, nurses, social workers, chaplains) have been shown to improve quality of life, manage symptoms, support patients and families, and lower costs (Jordhoy et al. 2001; Brumley et al. 2007; Bakitas et al. 2009; Temel et al. 2010; Rabow et al. 2013; Smith et al. 2014). Yet not all patients need all aspects of palliative care services. For example, a person with advanced heart failure with multiple symptoms who needs help with daily tasks would likely benefit from specialist palliative care services, whereas a person with symptomatic heart failure alone may be adequately cared for by a nurse‐based management program. Moving beyond a “one size fits all” model of care for persons with serious illness and efficiently targeting resources to those who need and will benefit from them most are critical steps in providing appropriate, value‐driven care to this population. In addition, accurate assessment of quality of care requires precise risk adjustment that fully accounts for a patient's propensity to be in this highest cost group.
To date, efforts both to target specialized clinical interventions to the population most likely to benefit and to adequately risk‐adjust quality metrics are hindered by our inability to prospectively identify the highest cost population. The most commonly used approach is the Centers for Medicare and Medicaid Services (CMS) hierarchical condition categories (HCC), which rely on diagnostic codes from claims and a complex statistical algorithm to adjust Medicare Advantage capitation payments (Pope et al. 2004; MedPAC 2012). Although new health care initiatives and clinical programs seek to target those with “serious” or “advanced” illness (Ciemins et al. 2006; Krakauer et al. 2009), clear definitions of exactly who belongs to this population do not exist. Indeed, recent data suggest that a program's ability to improve care value is highly dependent upon targeting appropriate patients (Hong, Siegel, and Ferris 2014). Diagnoses alone fail to adequately predict costs, hospital use, and mortality (The Lewin Group 2010; Kelley et al. 2011, 2012; Aldridge and Kelley 2015). The addition of functional status measures and prior health care utilization to diagnoses may add predictive strength, but clearly defined criteria are lacking.
Effective methods to prospectively identify the most costly patient population are critically important to health care reform. Targeting a population, well defined by clinically accessible data, would facilitate deployment of tailored clinical services to those most likely to benefit, improvement in quality of care while reducing unnecessary and undesired high‐intensity treatment, and adequate risk adjustment of quality metrics and reimbursement of services.
As a first step toward addressing this gap, we used the nationally representative, longitudinal Health and Retirement Study (HRS) cohort to examine three candidate definitions of serious illness among older adults. A recent survey of palliative care researchers and interdisciplinary experts in the clinical, research, and policy arenas of palliative care produced the following conceptual definition: “Serious Illness is a condition that carries a high risk of mortality, negatively impacts quality of life and daily function, and/or is burdensome in symptoms, treatments or caregiver stress” (Kelley 2014). Guided by this conceptual definition and understanding that serious illness may encompass a spectrum of severity and care needs, we aimed to create three operationalized definitions ranging from a broad definition (i.e., the full spectrum of serious illness) to a more restricted definition (i.e., the highest risk subgroup). For each group, we examined 1‐year outcomes, including hospital admissions, total Medicare spending, and mortality, and compared them to those having no indication of serious illness. We also compared the Medicare spending of those meeting each definition to the costs predicted by the HCC.
Methods
Definitions
Building upon the conceptual definition described above, we created and operationalized three approaches ranging from a broader definition (e.g., to use for screening purposes) to a more restricted definition (e.g., to use for targeting more resource‐intensive programs and services):
Condition and/or Functional Limitation (most broad): one or more severe medical conditions (Condition) and/or receiving assistance with any of the six basic activities of daily living (ADL), that is, eating, bathing, dressing, toileting, transferring, and walking (Functional Limitations) (i.e., serious illness is a severe diagnosis and/or functional impairment). Drawing upon existing literature and input from several clinical experts in geriatrics and palliative care, whose patient population spans the full range of seriously ill older adults, severe medical conditions included the following: cancer (metastatic or hematologic), renal failure, dementia, advanced liver disease or cirrhosis, diabetes with severe complications (ischemic heart disease, peripheral vascular disease, renal disease), amyotrophic lateral sclerosis (ALS), acquired immune deficiency syndrome, hip fracture, chronic obstructive pulmonary disease or interstitial lung disease only if using home oxygen or hospitalized for the condition, and congestive heart failure only if hospitalized for the condition. These medical conditions “carry a high risk of mortality” as described in the conceptual definition (Kelley 2014) and are identifiable within claims data with the markers of disease severity specified above. And functional impairment resulting in need for assistance with any of the basic ADLs is associated with increased mortality and health care utilization (Gill, Robison, and Tinetti 1998; Millán‐Calenti et al. 2010; Kelley et al. 2012).
Condition and/or Functional Limitation and Utilization: one or more severe medical conditions and/or receiving assistance with any ADL and one or more hospital admission in the last 12 months and/or residing in a nursing home (Utilization) (i.e., serious illness is functional impairment and/or severe medical condition, along with significant health care utilization)
Condition and Functional Limitation and Utilization (most restricted): one or more severe medical conditions and receiving assistance with any ADL and one or more hospital admission in the last 12 months and/or residing in a nursing home (i.e., serious illness is severe medical condition and functional impairment with significant health care utilization).
The definitions are increasingly restrictive, but not mutually exclusive (Figure 1). In addition to the three candidate definitions, we identified a comparison group: those who met none of the definitions (i.e., those without serious illness).
Figure 1.
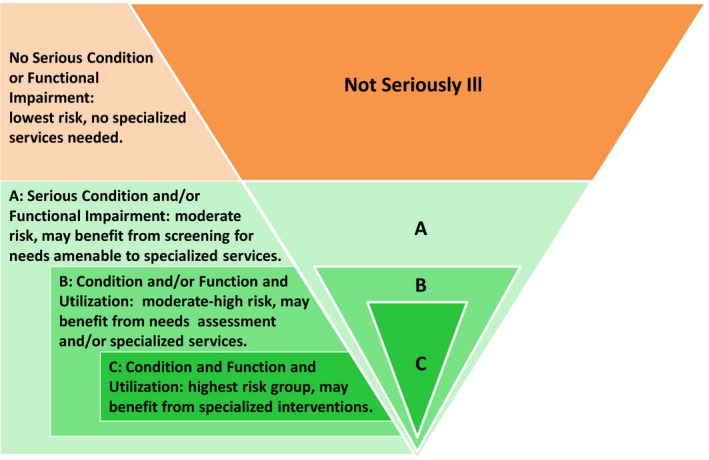
Three Definitions of Serious Illness, Ranging from Broad to Restrictive
Data Sources
Health and Retirement Study Data
The HRS is a National Institute on Aging‐funded, ongoing longitudinal and nationally representative cohort study of adults older than 50 years. The original HRS sample was assembled in 1992 and over 30,000 individuals have been enrolled. Serial “Core” interviews are conducted every 2 years and response rates for each interview wave have exceeded 86 percent. A proxy, usually a spouse or adult child, may complete the interview if the subject is unable. Variables drawn from the HRS Core interviews included age, nursing home residence, and functional status, based upon the subject's need for assistance with six basic ADLs. Subjects missing an entire interview were not eligible for enrollment that wave. Otherwise, missing data accounted for only 3.5 percent of data values.
Medicare Data
Over 80 percent of HRS participants provided authorization to merge their HRS data with Medicare claims. Medicare claims data and ICD9 diagnosis codes are used to identify each subject's medical conditions, hospital admissions, and total Medicare spending. All spending was adjusted for inflation to 2012 US dollars and for regional pricing differences based upon the Centers for Medicare and Medicaid wage index (Wage Index 2012). Compared to HRS respondents who reported Medicare coverage, but did not permit the linkage to claims data, HRS respondents with linked Medicare claims were on average: older (76 vs. 72 years); less likely to be African American (13 percent vs. 19 percent); and more likely to be enrolled in Medicaid (12 percent vs. 7 percent), report poor or fair self‐rated health (34 percent vs. 25 percent), require help with ADLs (12 percent vs. 7 percent), and die in the following year (4.8 percent vs. 0.4 percent).
Enrollment
At the time of each HRS Core interview, beginning in 2002 and continuing through 2010, every subject with continuous Medicare Parts A and B fee‐for‐service coverage over the preceding 12 months was eligible for enrollment (n = 11,577). Subjects were followed with biennial interviews through 2012 or death resulting in up to 35,215 episodes of eligibility. We enrolled each subject once—at the first interview in which they met the study definition and then followed them for 1 year from that date. While the definitions are not mutually exclusive, they are increasingly restrictive, and enrollment was conducted separately for each definition. For example, an individual subject may be enrolled under the Condition and/or Functional Limitation category (Criteria A) in 2004 and separately under the Condition and Functional Limitation and Utilization category (Criteria C) in 2008, but could only appear in each group one time.
This method of enrollment over the course of the longitudinal study aligned our assessment period with the individual's first year of meeting the criteria and maximized the sample size for the prospective assessment of outcomes. We supplemented this approach with a cross‐sectional evaluation during a single interview year (2008). A cross‐sectional comparison was conducted separately for each definition, A, B, and C. Subjects meeting the definition were compared to subjects who did not meet the definition.
Outcome Measures
Primary outcome measures were assessed over the 12 months following enrollment, defined by the date of the interview. Outcomes included hospital admission, total Medicare spending, and mortality. As secondary outcomes, we assessed 2‐year mortality and whether the subject continued to meet the enrollment criteria at the time of the next HRS Core interview (on average 2 years following enrollment). Finally, we used the cross‐sectional approach to assess each definition's sensitivity [true positive/(true positive + false negative)] and specificity [true negative/(true negative + false positive)] for identifying those beneficiaries at risk for hospitalization, death, and being among the costliest 5 percent of Medicare beneficiaries in the following year. We also used the cross‐sectional approach to assess costs predicted by the HCC algorithm, as well as the sensitivity and specificity of the HCC for predicting the top 5 percent of spenders.
Statistical Analyses and Sensitivity Tests
We provide descriptive statistics to report each group's characteristics and 1‐year outcomes. The characteristics and outcomes of each criteria group are compared to those subjects who meet none of the definitions at the time of the 2008 enrollment. In cross‐sectional comparisons, the total Medicare spending for each group is compared to the HCC‐based predicted spending for that group. All comparisons are made using t‐tests or chi squares, as appropriate, with statistical significance defined as p ≤ .05. Each identified group contains a portion of subjects who die during the year and therefore contribute less than 12 months of data. To address the potential for biasing down the results, we also describe the groups’ average total Medicare costs per month.
Results
From 2002 to 2010, 11,577 subjects were eligible and assessed sequentially for enrollment under each of the three candidate definitions. A total of 5,297 subjects were enrolled under the Condition and/or Functional Limitation definition (Criteria A); 3,151 enrolled under the Condition and/or Functional Limitation and Utilization definition (Criteria B); and 1,447 enrolled under the Condition and Functional Limitation and Utilization definition (Criteria C). Table 1 reports the subjects’ characteristics, which meet the criteria for each definition. Compared to the 4,841 subjects not meeting any of the definitions (sampled only in 2008), the seriously ill populations defined by these criteria were older, more likely to be female, more racially and ethnically diverse, less likely to be married, less wealthy, less educated, and more likely to self‐report poor or fair health (Table 1), all p values <.05.
Table 1.
Characteristics of Subjects Meeting Three Definitions of Serious Illness and Comparison Group
| Criteria A | Criteria B | Criteria C | Comparison Groupa | |
|---|---|---|---|---|
| N | 5,297 | 3,151 | 1,447 | 4,841b |
| Age, mean (SD), years | 78.2 (8.4) | 80.1 (8.4) | 82.4 (8.4) | 75.3 (6.9) |
| Female, n (%) | 3,201 (60.4) | 1,950 (61.9) | 972 (67.2) | 2,811 (58.1) |
| Race | ||||
| Non‐Hispanic white, n (%) | 3,993 (75.4) | 2,389 (75.8) | 1,070 (73.9) | 4,039 (83.4) |
| African American, n (%) | 812 (15.3) | 497 (15.8) | 241 (16.7) | 470 (9.7) |
| Hispanic, n (%) | 398 (7.5) | 211 (6.7) | 108 (7.5) | 247 (5.1) |
| Other, n (%) | 94 (1.8 | 54 (1.7) | 28 (1.9) | 85 (1.8) |
| Education | ||||
| Less than high school degree, n (%) | 1,899 (35.9) | 1,183 (37.5) | 621 (42.9) | 1,004 (20.7) |
| High school degree/some college, n (%) | 2,676 (50.5) | 1,558 (49.4) | 664 (45.9) | 2,812 (58.1) |
| Four‐year college degree, n (%) | 722 (13.6) | 410 (13.0) | 162 (11.2) | 1,025 (21.2) |
| Self‐rated health, fair/poor, n (%) | 3,139 (59.4) | 2,092 (66.5) | 1,103 (76.3) | 1,177 (24.3) |
| Married, n (%) | 2,432 (45.9) | 1,227 (38.9) | 467 (32.3) | 2,810 (58.0) |
| Net worth, mean (SD) | $408,704 ($1,006,942) | $359,725 ($957,779) | $285,472 ($842,234) | $718,328 ($1,558,112) |
| Severe medical conditionsc | ||||
| Alzheimer's/dementia, n (%) | 1,177 (22.2) | 960 (30.5) | 813 (56.2) | 0.0 (0.0) |
| Cancer, n (%) | 474 (8.9) | 240 (7.6) | 87 (6.0) | 0.0 (0.0) |
| End‐stage renal disease, n (%) | 622 (11.7) | 486 (15.4) | 258 (17.8) | 0.0 (0.0) |
| Congestive heart failure, n (%) | 343 (6.5) | 393 (12.5) | 207 (14.3) | 0.0 (0.0) |
| Chronic obstructive pulmonary disease, n (%) | 783 (14.8) | 608 (19.3) | 281 (19.4) | 0.0 (0.0) |
| Diabetes, n (%) | 1,043 (19.7) | 661 (21.0) | 357 (24.7) | 0.0 (0.0) |
| Liver disease, n (%) | 296 (5.6) | 121 (3.8) | 47 (3.2) | 0.0 (0.0) |
| Hip fracture, n (%) | 158 (3.0) | 177 (5.6) | 121 (8.4) | 0.0 (0.0) |
| Three or more comorbid conditionsd, n (%) | 4,455 (84.1) | 2,987 (94.8) | 1,406 (97.2) | 2,063 (42.6) |
| Functional status | ||||
| Stable, independent in ADLs, n (%) | 2,882 (54.6) | 1,475 (47.1) | 0 (0.0) | 4,841 (100) |
| Stable, moderate debility (1–3 ADL impairments), n (%) | 373 (7.1) | 279 (8.9) | 209 (14.6) | 0.0 (0.0) |
| Stable, severe debility (4–6 ADL impairments), n (%) | 187 (3.5) | 175 (5.6) | 155 (10.8) | 0.0 (0.0) |
| Declined, independent to moderate, n (%) | 1,310 (25.3) | 648 (21.0) | 536 (38.0) | 0.0 (0.0) |
| Declined, independent to severe, n (%) | 377 (7.3) | 371 (12.0) | 354 (25.1) | 0.0 (0.0) |
| Declined, moderate to severe, n (%) | 147 (2.8) | 183 (5.9) | 181 (12.8) | 0.0 (0.0) |
| Characteristic meeting criteria | ||||
| Any serious medical condition, n (%) | 4,004 (75.6) | 2,634 (83.6) | 1,447 (100) | 0.0 (0.0) |
| Functional impairment, n (%) | 2,408 (45.5) | 1,670 (53.0) | 1,447 (100) | 0.0 (0.0) |
| Medical condition and functional impairment, n (%) | 1,115 (21.0) | 1,153 (36.6) | 1,447 (100) | 0.0 (0.0) |
| Nursing home resident, n (%) | 725 (13.7) | 926 (29.4) | 750 (51.8) | 31 (0.6) |
| Hospital admission, n (%) | 2,077 (39.2) | 2,671 (84.8) | 1,118 (77.3) | 389 (8.0) |
Criteria A = Condition and/or Functional Limitation. Criteria B = Condition and/or Functional Limitation and Utilization. Criteria C = Condition and Functional Limitation and Utilization. Comparison Group = Subjects not meeting any serious illness criteria.
Bold indicates the subjects' characteristics, which meet the criteria for each definition.
Subjects in the Comparison group differ significantly (p < .05) on all characteristics compared to those in Criteria A, B and C, respectively, except “Other” Race.
Due to cross‐sectional enrollment of the Comparison group, the size of this group cannot be directly compared to the other groups.
ALS and AIDS not reported due to HRS guidelines on cell size reporting restrictions.
Comorbid conditions were identified in Medicare claims (Elixhauser et al. 1998).
Examining outcomes at 1 year (Table 2) revealed the proportion hospitalized was 33 percent among those meeting the Condition and/or Functional Limitation definition (Criteria A); 44 percent among the Condition and/or Functional Limitation and Utilization definition (Criteria B); and 47 percent for those meeting the Condition and Functional Limitation and Utilization definition (Criteria C). Total Medicare expenditures followed a similar pattern, whereby average spending was $20,566 for Criteria A, $26,349 for Criteria B, and $30,828 for Criteria C. Finally, 1‐year mortality was 13 percent for Criteria A, 19 percent for Criteria B, and 28 percent for Criteria C. All of these 1‐year outcomes were also significantly higher (all p values <.05) as compared to those subjects not meeting any of the three definitions, among whom 12 percent were hospitalized, average total Medicare spending was $7,789, and mortality was 2 percent.
Table 2.
Outcomes at One Year among Subjects Meeting Three Definitions of Serious Illness and Comparison Group
| Criteria A | Criteria B | Criteria C | Comparison Groupa | |
|---|---|---|---|---|
| N | 5,297 | 3,151 | 1,447 | 4,841 |
| Any hospital admission, n (%) | 1,763 (33.3) | 1,375 (43.6) | 684 (47.3) | 570 (11.8) |
| Total Medicare spending, mean (SD) | $20,566 (31,686) | $26,349 (35,485) | $30,828 (39,628) | $7,789 (17,367) |
| Total Medicare spending, median | $7,774 | $12,669 | $16,717 | $2,096 |
| Total Medicare spending per month, mean (SD) | $2,460 (5,942) | $3,308 (7,031) | $4,167 (7,437) | $765 (3,818) |
| Died, n (%) | 684 (12.9) | 602 (19.1) | 409 (28.3) | 90 (1.9) |
Criteria A = Condition and/or Functional Limitation. Criteria B = Condition and/or Functional Limitation and Utilization. Criteria C = Condition and Functional Limitation and Utilization. Comparison Group = Subjects not meeting any serious illness criteria.
Subjects in the Comparison group differ significantly (p < .05) on all outcomes compared to those in Criteria A, B, and C, respectively.
Among those enrolled under the three definitions (n = 9,895), 9,075 (92 percent) had data available to assess their serious illness status at 2 years (Figure 2). We examined the trajectory of illness for these subjects, namely whether they remained within the seriously ill group, no longer met the criteria of the serious illness definition, or died. Among those meeting the Condition and/or Functional Limitation definition (Criteria A), 51 percent continued to meet criteria, 25 percent died, and 24 percent were alive and no longer met the criteria. For those meeting the Condition and/or Functional Limitation and Utilization definition (Criteria B), 32 percent continued to meet criteria, 35 percent died, and 33 percent were alive and no longer met the criteria. Among those meeting the Condition and Functional Limitation and Utilization definition (Criteria C), 28 percent continued to meet criteria, 51 percent died, and 21 percent were alive and no longer met the criteria.
Figure 2.
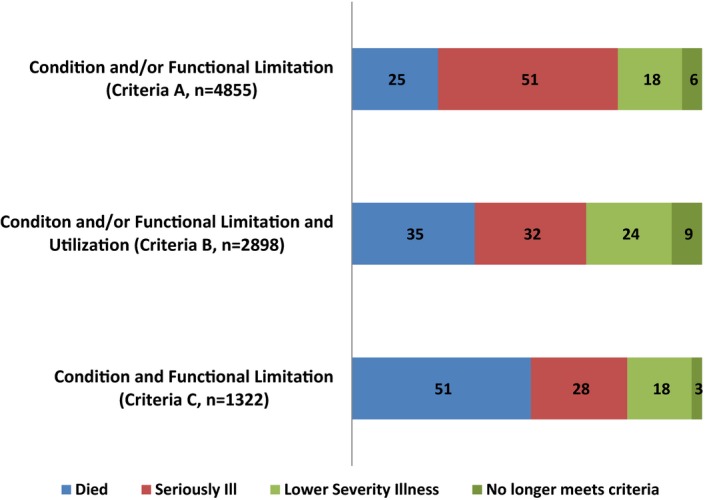
Status at Two‐Year Follow‐Up, as Percentage of Criteria Group
Further examination of those alive at 2 years, but no longer meeting the definitions’ criteria, revealed a portion who continued to have the same illness but without the markers of disease severity required in the criteria (e.g., COPD but without a hospitalization for the condition) or difficulty with one or more ADLs but without reporting receipt of help. This accounted for 18 percent of those originally meeting Criteria A, 24 percent Criteria B, and 18 percent Criteria C (Figure 2). That portion also included a subgroup of people who likely improved (e.g., subject with a hip fracture who had no serious conditions or functional impairments at follow‐up), accounting for 1 percent of each original group. The remainder was those for whom we could not discern a reason to no longer meet the criteria (e.g., diagnosis of ALS with no further claims for this disease at 2‐year follow‐up): 6 percent for Criteria A, 9 percent Criteria B, and 3 percent Criteria C. We hypothesize this may be related to inadequate reflection of illnesses within the claims, for example, possibly due to enrollment in hospice or Medicaid. Notably, however, those who did not continue to meet the criteria at year 2 did continue to have elevated Medicare spending, on average $10,760 for those in Criteria A, $16,003 Criteria B, and $20,747 Criteria C.
Next, we used the cross‐sectional approach to assess each definition's sensitivity and specificity for identifying those beneficiaries at risk for hospitalization, being among the costliest 5 percent of Medicare beneficiaries, and death in the following year (Table 3). The broadest Criteria A had the highest sensitivity for all three outcomes (0.53, 0.66, 0.73, respectively), but the lowest specificity (0.79, 0.75, 0.75, respectively). In contrast, the more restrictive Criteria C had the lowest sensitivity for all three outcomes (0.15, 0.25, 0.30, respectively), but the highest specificity (0.97, 0.95, 0.96, respectively). The estimates for Criteria B fell in between. Using the HCC to identify the top 5 percent of predicted Medicare costs, we again assessed sensitivity and specificity for these outcomes and found low sensitivity (0.19, 0.39, 0.32, respectively) and high specificity (0.98, 0.97, 0.96, respectively). Finally, we examined each group's total Medicare spending over 1 year and the spending that was predicted by the HCC for those subjects. In all groups the actual mean spending and that predicted by the HCC were similar: Criteria A actual mean total Medicare spending was $22,968 and HCC‐predicted mean was $24,467 (p = .02); Criteria B actual mean was $28,954 and HCC‐predicted mean was $29,637 (p = 0.51); and Criteria C actual mean was $34,111 and HCC‐predicted mean was $32,430 (p = .34).
Table 3.
Sensitivity and Specificity of Criteria A, B, and C for Identifying 1‐Year Outcomes
| Criteria A: Sensitivity, Specificitya | Criteria B: Sensitivity, Specificity | Criteria C: Sensitivity, Specificity | Top 5% Predicted By, Hierarchical Condition Categories | |
|---|---|---|---|---|
| Hospitalization | 0.53, 0.79 | 0.32, 0.91 | 0.15, 0.97 | 0.19, 0.98 |
| Top 5% Medicare spending | 0.66, 0.75 | 0.44, 0.89 | 0.25, 0.95 | 0.39, 0.97 |
| Died | 0.73, 0.75 | 0.51, 0.89 | 0.30, 0.96 | 0.32, 0.96 |
Sensitivity = true positive/(true positive + false negative); specificity = true negative/(true negative + false positive) for identifying those beneficiaries at risk for hospitalization, being among the costliest 5% of Medicare beneficiaries, and death in the following year.
Discussion
This study demonstrates that persons with serious illness can be identified prospectively using a range of three definitions from broad and inclusive to restricted and narrow. All three definitions, based upon clinically accessible data, identify older adults with high risk of hospitalization, high Medicare costs, and mortality. These undesirable outcomes have been shown in prior work to be frequently accompanied by inadequately managed symptoms, low satisfaction, or preference‐discordant treatments and outcomes that may be modifiable with specialized clinical interventions (Field and Cassel 1997; Hanson, Danis, and Garrett 1997; Teno et al. 2004; Brumley et al. 2007; Bakitas et al. 2009; Mitchell et al. 2009; Temel et al. 2010; Institute of Medicine 2013, 2015; Rabow et al. 2013; Higginson et al. 2014; Smith et al. 2014). These data have important implications. Given the number of individuals who meet these different definitions and the range of outcomes observed, these groups may warrant different levels of services or types of interventions. For example, the larger group fitting the broad, inclusive (i.e., more sensitive, less specific) definition may benefit from screening for unmet care needs, which may be amenable to specific services or targeted interventions. Providing resource‐intensive services to this entire group is likely not necessary or feasible. In contrast, those in the most restricted (i.e., least sensitive, most specific) group with one or more severe medical condition, functional limitations, and high utilization may benefit from specialized, more resource‐intensive services, such as home visits. Targeting these expensive services to this smaller, highest risk group is more likely to be feasible and in proportion to the patients’ needs. Whatever the intervention, the ability to prospectively identify an appropriate target group may be the critical first step toward population‐based planning and service delivery with the goal of improving value by raising the quality of care for these vulnerable patients and their families and reducing unnecessary and undesired high‐intensity and expensive health care. Further research is needed to evaluate the impact of applying evidence‐based interventions to the groups identified by these definitions.
The outcomes of subjects meeting these definitions highlight a few key findings. First, the inclusion of functional limitations is critical to prospectively identifying seriously ill patients at risk for negative outcomes and is easy to assess in a clinical setting. In a post hoc examination of the Criteria A group, we noted that the inclusion of “or functional limitation” in that definition resulted in the identification of a substantially larger group than “serious condition” alone. Furthermore, we found that those with either a “condition only” or “functional limitation only” had similar mean Medicare spending ($18,599 vs. $17,776), while those with both had markedly higher costs ($28,897). Our study's findings are consistent with retrospective analyses that reveal assessment of risk based on the presence of one or more condition alone is simply inadequate (The Lewin Group 2010; Kelley et al. 2011, 2012; Aldridge and Kelley 2015). Yet functional characteristics are not collected routinely in electronic medical records and administrative claims, with the exception of the Minimum Data Set for nursing home residents. By routinely assessing functional status, the health care system could more easily use these definitions to identify seriously ill patients most likely to benefit from specialized care programs and services, and clarify those patients’ treatment preferences to improve the delivery of personalized goal‐driven care.
Second, the majority of seriously ill older adults identified were not in the last year of life, yet had evidence of high cost and utilization. Similar to a recent report to the Institute of Medicine, which found that among the most expensive 5 percent of patients in the United States only 11 percent are in the last year of life (Institute of Medicine 2015), we also found that the 1‐year mortality rate ranged from 13 to 28 percent across the three serious illness definitions. The commonly held misperception that those at the end of life account for the most health care spending is an artifact of studies limited to Medicare costs alone and an inaccurate extrapolation of the fact that individual end‐of‐life health care spending greatly exceeds spending in prior years. Indeed, on a population basis the high costs of health care for the seriously ill across the life span dramatically exceed the individual's increase in spending near the end of life. This important misperception results in two problems. It distracts investigators, administrators, and policy makers from aiming to improve the care of the broader population of seriously ill patients, many of whom are among the top 5 percent of health care spenders, and instead focuses attention on only those for whom we have the least amount of time and opportunity to intervene. Instead, prospective criteria based upon conditions, functional impairments, and prior utilization regardless of prognosis may be more likely to identify those individuals who not only have high costs but also may have significant unmet care needs offering the greatest chance to improve value, even if not all of the top spenders are identified. For many of these individuals, tailored interdisciplinary palliative care services could add great value. The definitions allow for better targeting and planning of palliative care services to this population.
Third, these definitions of serious illness identify a substantial number of people with persistently high utilization. Prior studies examining costs alone have found that the majority of individuals with a year of very high health care costs do not have high costs in the year that follows (Cohen and Yu 2012; Commonwealth Foundation 2015). Many have experienced a discrete high cost event (e.g., myocardial infarction or car accident) that is followed by stable health, while others are in their last year of life. These groups do not present significant opportunities for cost savings because of the very limited time window for intervention. In contrast, those who continue to incur the highest health care costs and those with persistent patterns of high utilization likely experience the greatest burden of serious illness as defined by experts; that is, high risk of mortality, negative impact on quality of life and daily function, and burdensome symptoms, treatments, or caregiver stress. This group, therefore, offers the greatest opportunity for interventions to improve care, relieve suffering, and reduce excess costs from inappropriate or undesired treatments, thereby maximizing health care value. The three definitions of serious illness proposed here identified far fewer people who moved out of the serious illness group in later years, and are therefore a substantial improvement to models that only consider retrospective costs.
Finally, the average observed Medicare spending was similar to HCC‐based predicted costs for each of the groups. Notably, however, the HCC is specifically designed to adjust Medicare Advantage payments for the predicted costs of enrolled beneficiaries (MedPAC, 2012). It requires claims data and computation of a complex statistical algorithm. In contrast, the definitions considered here aim to prospectively identify seriously ill persons, using clinically accessible data, to efficiently deploy tailored clinical services to those most likely to benefit and thereby improve quality of care while reducing unnecessary and undesired high‐intensity treatment. These definitions do not require access to claims data and may be implemented in any clinical setting or institution.
This study has several limitations. First, due to study design and sampling technique these estimates are not generalizable to the whole Medicare population, so we are unable to state what proportion of the Medicare population meets each definition. This approach, however, enrolled subjects over time as they first met the criteria and thereby maximized the sample size and produced more robust estimates of the study outcomes. In addition, this design avoided enrolling people years after they first met the definition when they may be sicker on average, which would have upwardly biased our results. Second, we recognize that diagnostic codes do not effectively capture all severe conditions (e.g., frailty) nor do they reflect severity of illness. This is particularly relevant to the diagnosis of dementia as the ICD9 code does not distinguish early versus late stages of dementia. Aiming to capture only clinically significant dementia, we required the code to be present in more than one claim. This algorithm for identification of severe medical conditions should be repeated and improved upon in settings where more detailed clinical data are available and may include additional diagnoses for younger populations. In addition, sociodemographic factors could exert mediating or moderating effects on the observed outcomes, and these relationships should be explored in future research. Finally, we were unable to assess quality of care or the concordance of treatment with individual preferences. Future studies must address these gaps, as well as validate these definitions within other datasets and clinical programs.
In sum, the prospective identification of people with serious illness is feasible and depends upon measures of medical illness, functional limitations, and health care utilization. Notably, most seriously ill patients identified are not in the last year of life and so time may permit interventions to improve the quality and preference‐concordance of care provided. Health care systems or providers can use these definitions to efficiently match resources and services to the patients who need them and are most likely to benefit. For example, people who meet the broad Criteria A could be contacted by phone and screened for poorly controlled symptoms or unmet care needs and then referred to the appropriate services. Alternatively, those meeting the more restricted Criteria C could be enrolled in a home‐based care program or provided other specialized services. For any intervention, reliable, prospective identification of those seriously ill older adults most likely to benefit will be a critical step toward improving quality of care while lowering costs.
Supporting information
Appendix SA1: Author Matrix.
Acknowledgments
Joint Acknowledgment/Disclosure Statement: ASK receives support from the National Institute on Aging (NIA) (1K23AG040774‐01A1), the American Federation for Aging Research, and the National Palliative Care Research Center. CSR receives support from the NIA (1K07AG31779). RSM receives support from the National Palliative Care Research Center and the NIA (1K24 AG 22345‐01). The funding sources had no role in design and conduct of the study; collection, management, analysis, and interpretation of the data; and preparation, review, or approval of the manuscript.
Disclosures: None.
Disclaimers: None.
References
- Aldridge, M. D. , and Kelley A. S.. 2015. “The Myth Regarding the High Cost of End‐of‐Life Care.” American Journal of Public Health 105 (12): 2411–5. [DOI] [PMC free article] [PubMed] [Google Scholar]
- Bakitas, M. , Lyons K., Hegel M., Balan S., Brokaw F., Seville J., Hull J., Li Z., Tosteson T., Byock I., and Ahles T.. 2009. “Effects of a Palliative Care Intervention on Clinical Outcomes in Patients with Advanced Cancer: The Project ENABLE II Randomized Controlled Trial.” JAMA 302 (7): 741–9. [DOI] [PMC free article] [PubMed] [Google Scholar]
- Brumley, R. , Enguidanos S., Jamison P., Seitz R., Morgenstern N., Saito S., McIlwane J., Hillary K., and Gonzalez J.. 2007. “Increased Satisfaction with Care and Lower Costs: Results of a Randomized Trial of In‐Home Palliative Care.” Journal of the American Geriatrics Society 55 (7): 993–1000. [DOI] [PubMed] [Google Scholar]
- Ciemins, E. L. , Stuart B., Gerber R., Newman J., and Bauman M.. 2006. “An Evaluation of the Advanced Illness Management (AIM) Program: Increasing Hospice Utilization in the San Francisco Bay Area.” Journal of Palliative Medicine 9 (6): 1401–11. [DOI] [PubMed] [Google Scholar]
- Cohen, S. , and Yu W.. 2012. “The Concentration and Persistence in the Level of Health Expenditures over Time: Estimates for the U.S. Population, 2008‐2009.” AHRQ Statistical Brief #354 [accessed on July 6, 2015]. Available at http://meps.ahrq.gov/mepsweb/data_files/publications/st354/stat354.pdf
- Elixhauser, A. , Steiner C., Harris D. R., and Coffey R. M.. 1998. “Comorbidity Measures for Use with Administrative Data.” Medical Care 36 (1): 8–27. [DOI] [PubMed] [Google Scholar]
- Field, M. , and Cassel C.. 1997. Approaching Death: Improving Care at the End of Life. Washington, DC: Institute of Medicine of the National Academies. [PubMed] [Google Scholar]
- Gill, T. M. , Robison J. T., and Tinetti M. E.. 1998. “Difficulty and Dependence: Two Components of the Disability Continuum among Community‐Living Older Persons.” Annals of Internal Medicine 128 (2): 96–101. [DOI] [PubMed] [Google Scholar]
- Hanson, L. C. , Danis M., and Garrett J.. 1997. “What Is Wrong with End‐Of‐Life Care? Opinions of Bereaved Family Members.” Journal of the American Geriatrics Society 45 (11): 1339–44. [DOI] [PubMed] [Google Scholar]
- Higginson, I. J. , Bausewein C., Reilly C. C., Gao W., Gysels M., Dzingina M., McCrone P., Booth S., Jolley C. J., and Moxham J.. 2014. “An Integrated Palliative and Respiratory Care Service for Patients with Advanced Disease and Refractory Breathlessness: A Randomised Controlled Trial.” The Lancet Respiratory Medicine 2 (12): 979–87. [DOI] [PubMed] [Google Scholar]
- Hong, C. S. , Siegel A. L., and Ferris T. G.. 2014. Caring for High‐Need, High‐Cost Patients: What Makes for a Successful Care Management Program?. Washington, D.C: The Commonwealth Fund. [PubMed] [Google Scholar]
- Institute of Medicine . 2013. Delivering High‐Quality Cancer Care: Charting a New Course for a System in Crisis. Washington, DC: Institute of Medicine of the National Academies. [PubMed] [Google Scholar]
- Institute of Medicine . 2015. Dying in America: Improving Quality and Honoring Individual Preferences Near the End of Life. Appendix E, pp. 478–531. Washington, DC: The National Academies Press. [PubMed] [Google Scholar]
- Jordhoy, M. S. , Fayers P., Loge J. H., Ahlner‐Elmqvist M., and Kaasa S.. 2001. “Quality of Life in Palliative Cancer Care: Results from a Cluster Randomized Trial.” Journal of Clinical Oncology 19 (18): 3884–94. [DOI] [PubMed] [Google Scholar]
- Kelley, A. S. 2014. “Defining ‘Serious Illness.’” Journal of Palliative Medicine 17 (9): 985. [DOI] [PubMed] [Google Scholar]
- Kelley, A. S. , Ettner S. L., Morrison R. S., Du Q., Wenger N. S., and Sarkisian C. A.. 2011. “Determinants of Medical Expenditures in the Last 6 Months of Life.” Annals of Internal Medicine 154 (4): 235–42. [DOI] [PMC free article] [PubMed] [Google Scholar]
- Kelley, A. S. , Ettner S. L., Morrison R. S., Du Q., and Sarkisian C. A.. 2012. “Disability and Decline in Physical Function Associated with Hospital Use at End of Life.” Journal of General Internal Medicine 27 (7): 794–800. [DOI] [PMC free article] [PubMed] [Google Scholar]
- Krakauer, R. , Spettell C. M., Reisman L., and Wade M. J.. 2009. “Opportunities to Improve the Quality of Care for Advanced Illness.” Health Affairs (Millwood) 28 (5): 1357–9. [DOI] [PubMed] [Google Scholar]
- The Lewin Group . 2010. Individuals Living in the Community with Chronic Conditions and Functional Limitations: A Closer Look; Prepared for the Office of the Assistant Secretary for Planning & Evaluation, U.S. Department of Health and Human Services. Washington, DC: The Lewin Group. [Google Scholar]
- MedPAC . 2012. “Issues for Risk Adjustment in Medicare Advantage” [accessed on November 2, 2015]. Available at http://www.medpac.gov/documents/reports/June-2012-report-chapter-4-issues-for-risk-adjustment-in-medicare-advantage.pdf
- Millán‐Calenti, J. C. , Tubío J., Pita‐Fernández S., González‐Abraldes I., Lorenzo T., Fernández‐Arruty T., and Maseda A.. 2010. “Prevalence of Functional Disability in Activities of Daily Living (ADL), Instrumental Activities of Daily Living (IADL) and Associated Factors, as Predictors of Morbidity and Mortality.” Archives of Gerontology and Geriatrics 50 (3): 306–10. [DOI] [PubMed] [Google Scholar]
- Mitchell, S. L. , Teno J. M., Kiely D. K., Shaffer M. L., Jones R. N., Prigerson H. G., Volicer L., Givens J. L., and Hamel M. B.. 2009. “The Clinical Course of Advanced Dementia.” New England Journal of Medicine 361 (16): 1529–38. [DOI] [PMC free article] [PubMed] [Google Scholar]
- National Institute for Health Care Management (NIHCM) Foundation . 2012. Health Care's Big Spenders: The Characteristics Behind the Curve [accessed on July 6, 2015]. Available at http://www.nihcm.org/health-spending-distribution-charts [Google Scholar]
- Pope, G. C. , Kautter J., Ellis R. P., Ash A. S., Ayanian J. Z., Ingber M. J., Levy J. M., and Robst J.. 2004. Risk Adjustment of Medicare Capitation Payments Using the CMS‐HCC Model. Health Care Finance Review 25 (4): 119–41. [PMC free article] [PubMed] [Google Scholar]
- Rabow, M. , Kvale E., Barbour L., Cassel J. B., Cohen S., Jackson V., Luhrs C., Nguyen V., Rinaldi S., Stevens D., Spragens L., and Weissman D.. 2013. “Moving Upstream: A Review of the Evidence of the Impact of Outpatient Palliative Care.” Journal of Palliative Medicine 16 (12): 1540–9. [DOI] [PubMed] [Google Scholar]
- Smith, S. , Brick A., O'Hara S., and Normand C.. 2014. “Evidence on the Cost and Cost‐Effectiveness of Palliative Care: A Literature Review.” Palliative Medicine 28 (2): 130–50. [DOI] [PubMed] [Google Scholar]
- Temel, J. S. , Greer J. A., Muzikansky A., Gallagher E. R., Admane S., Jackson V. A., Dahlin C. M., Blinderman C. D., Jacobsen J., Pirl W. F., Billings J. A., and Lynch T. J.. 2010. “Early Palliative Care for Patients with Metastatic Non‐Small‐Cell Lung Cancer.” New England Journal of Medicine 363 (8): 733–42. [DOI] [PubMed] [Google Scholar]
- Teno, J. M. , Clarridge B. R., Casey V., Welch L. C., Wetle T., Shield R., and Mor V.. 2004. “Family Perspectives on End‐of‐Life Care at the Last Place of Care.” JAMA 291 (1): 88–93. [DOI] [PubMed] [Google Scholar]
- Wage Index . 2012. [accessed on March 20, 2015]. Available at: http://www.cms.gov/Medicare/Medicare-Fee-for-Service-Payment/AcuteInpatientPPS/wageindex.html
Associated Data
This section collects any data citations, data availability statements, or supplementary materials included in this article.
Supplementary Materials
Appendix SA1: Author Matrix.