Abstract
Context:
The quality of images produced by whole slide imaging (WSI) scanners has a direct influence on the readers’ performance and reliability of the clinical diagnosis. Therefore, WSI scanners should produce not only high quality but also consistent quality images.
Aim:
We aim to evaluate reproducibility of WSI scanners based on the quality of images produced over time and among multiple scanners. The evaluation is independent of content or context of test specimen.
Methods:
The ultimate judge of image quality is a pathologist, however, subjective evaluations are heavily influenced by the complexity of a case and subtle variations introduced by a scanner can be easily overlooked. Therefore, we employed a quantitative image quality assessment method based on clinically relevant parameters, such as sharpness and brightness, acquired in a survey of pathologists. The acceptable level of quality per parameter was determined in a subjective study. The evaluation of scanner reproducibility was conducted with Philips Ultra-Fast Scanners. A set of 36 HercepTest™ slides were used in three sub-studies addressing variations due to systems and time, producing 8640 test images for evaluation.
Results:
The results showed that the majority of images in all the sub-studies are within the acceptable quality level; however, some scanners produce higher quality images more often than others. The results are independent of case types, and they match our perception of quality.
Conclusion:
The quantitative image quality assessment method was successfully applied in the HercepTest™ slides to evaluate WSI scanner reproducibility. The proposed method is generic and applicable to any other types of slide stains and scanners.
Keywords: Quantitative image quality, scanner quality, subjective image quality
INTRODUCTION
The quality of images produced by whole slide imaging (WSI) scanners has a direct influence on the readers’ performance and reliability of the clinical diagnosis.[1,2] In addition, performance of the automated disease detection and diagnosis tools designed for clinical assistance are dependent on the visual information in the image content. Therefore, WSI scanners should be able to produce not only high quality but also consistent quality, images across multiple scans from one scanner and among multiple scanners. However, the same slide scanned by a scanner at different times or by different scanners may appear different, even when viewed on the same display, due to discrepancies in scanner characteristics and external influences such as temperature and mechanical shifts.
The standardization in WSI work-flow is a well recognized issue.[3] The high quality and consistency of whole slide images are becoming more important with an increase in the computer aided diagnostics. Recent works[4,5,6] propose methods to standardize color distribution of the whole slide images in a post-processing step. However, the workflow standardization is non-trivial mainly because it requires formalization of multiple processes, for example, specimen preparation, scanning, image postprocessing and displaying. Moreover, there is no general consensus on an ideal image quality, in both subjective and objective terms. In this paper, we consider quality as a measure of suitability of an image for clinical diagnosis. We propose a method to evaluate reproducibility of WSI scanners, over time in a single system and among multiple systems, based on the quality of the images produced.
A conventional approach to measure image quality, and thereby compute the scanner reproducibility, would be to conduct a task-based test by asking pathologists to evaluate multiple scans of a slide-set. However, in practice, such tests are very time-consuming, expensive, and difficult to reproduce. Furthermore, the perception of quality is also heavily biased by the complexity of a case.[7] When a case is straightforward, for example, extremely normal or diseased, no extensive image information is required for its diagnosis. Images of such cases are rated higher in quality than that of ambiguous or complicated cases. Therefore, subjective assessments cannot be used to evaluate scanners, where the effect in images may be subtle and easily overlooked. Another approach, based on an objective evaluation, would be to use phantom slides with a known reference to measure different quality indicators such as color fidelity, image resolution, and sharpness.[3,8,9] However, such phantoms are different than the histopathological specimen used in clinical practice and a superior scanner performance on a phantom slide does not guarantee high image quality in tissue specimen. Furthermore, the current literature does not address the level of quality variation, which is acceptable in clinical applications.
We employed a quantitative image quality assessment method based on parameters: sharpness, contrast, brightness, uniform illumination, and color separation, acquired in a survey of pathologists as the important features for clinical evaluation of HercepTest™ images. The resulting quality score represents the performance of a scanner and is independent of an image content or test specimen. The evaluation of scanner reproducibility was conducted with Philips Ultra Fast Scanners (UFS). A set of 36 HercepTest™ slides were scanned in three different sub-studies, which consisted of ten iterative scans in one scanner, ten iterative scans in three scanners and twenty scans across 20 days in one scanner, representing variations of intra-system, inter-system, and inter-day/inter-system, respectively. Four selected regions of interest from every slides were evaluated to compute quality ratings in the defined image parameters. The results show that at least 99% of the images are within the acceptable quality rating in all the sub-studies. It was also found that some scanners produce higher quality images more often than others, which matches with our visual observation.
The proposed method is generic and applicable to other types of tissues and stain types for measuring reproducibility of processes/devices in WSI work-flow. The evaluation protocol was reviewed and approved by the Institutional Review Board (00007807) before the start of the study.
METHODS
Figure 1 describes the schematics of the proposed method of image quality based evaluation of scanner reproducibility, in terms of the data and process flow. Each data element is an input or output of a process step. The following sections describe the methods in each process step.
Figure 1.
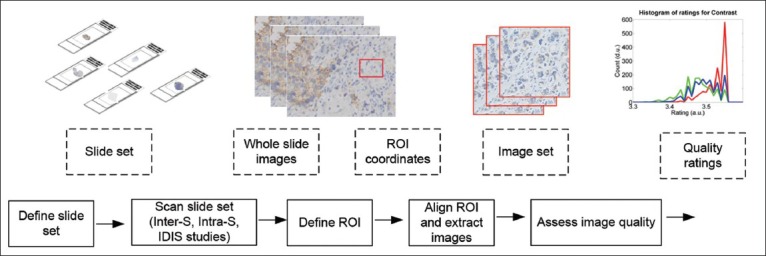
Schematic of the scanner reproducibility evaluation. The blocks given by dotted and solid lines represent data and process flow, respectively. The illustrations describe the data types
Define Test Slide-set
The test consisted of HercepTest™[10] slides, which are used to test the effectiveness of chemotherapy using Herceptin® to a breast cancer patient. The slides are immunohistochemically stained, and the diagnosis is based on overexpression of HER2 protein marked by intensity and presence of brown membrane stain. The clinical scoring of the HercepTest involves 0, 1+, 2+, and 3+, which represents negative, negative, weakly positive, and positive assessment, respectively.[11] Figure 2 shows four examples of HercepTest images, each representing a score category. The use of the HercepTest slides for scanner quality evaluation was driven by another associated experiment designed to analyze diagnostic accuracy of pathologists using a WSI system.[12] Since the diagnosis of HercepTest slides is reported in terms of quantitative scores, instead of qualitative descriptions, it allows application of objective and statistical methods for analyzing diagnostic accuracy and reproducibility. However, the proposed method is generic and also applicable to other types of tissues and stain types.
Figure 2.

Example images cropped from four reference images. The HER2 scores of the images from left to right are: 0, 1+, 2+, and 3+, respectively
A set of 36 slides, from the Dako tissue bank, were selected as the test set. The set included six slides corresponding to each HER2 score categories: 0, 1+, 2+, and 3+. Each slide represented a unique individual case of invasive breast carcinoma, seen typically in clinical practice. All the slides were prescreened using an optical microscope by a Dako pathologist, who was not involved in this study, to ensure sufficient quality of the slide specimen and obtain approximately equal distribution of the score types.
Scan Test Slide-set
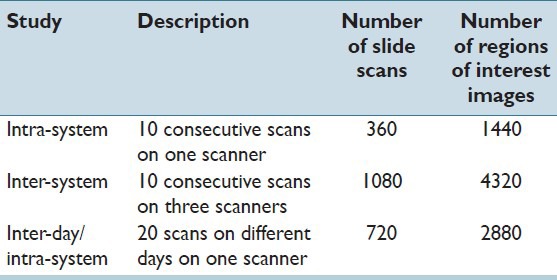
The test slide set was scanned iteratively under three sub-studies: intra-system (intra-S), inter-system (inter-S), and inter-day/intra-system (IDIS). These studies were designed to address variations, which may occur during repetitive scans, over time, and across scanners. The description of the scans involved in the sub-studies is given in Table 1.
Table 1.
Description of the three sub-studies conducted in the proposed scanner evaluation. For every sub-study, the test set consisted of 36 slides, uniformly representing the human epidermal growth factor receptor 2 score categories: 0, 1+, 2+, 3+
All the test slides were scanned in calibrated UFSs at 40× magnification. After scanning, the images were checked manually to confirm that the scan went successful based on the presence of overall image artifacts and completeness of scan area. The manual check is a general practice performed after every WSI scan. In case an image fails the check, the slide was attempted to rescan up to five times before the slide was excluded from the test.
Define Region of Interest
A region of interest (ROI) of a whole slide image represents an area meaningful for clinical diagnosis. The ROI selection per slide was performed by a pathologist on the first scanned whole slide image in every substudy. Four ROIs, each of 2000 × 2000 pixels at 40× magnification, were selected per image.
Align Region of Interest and Extract Images
In each of the sub-studies, once all the scan iterations were complete, the defined ROI coordinates were searched and aligned in the corresponding whole slide images. An automated tool, based on the deformable image registration,[13] was used for the alignment. The alignment accuracy was verified visually. In case of a failure, the alignment method was repeated by manually providing the search locations to the tool, until an alignment of approximately 95% was achieved. The number of whole slide images and ROI images to be analyzed in the three sub-studies are given in Table 1. For example, in the inter-S study, 36 test slides were scanned for ten consecutive times in three different scanners, resulting in 1080 (36 × 10 × 3) whole slide images and 4320 (1080 × 4) ROI images. The extracted images of the aligned ROI, and not the whole slide images, were used for the quality assessment.
Assess Image Quality
All the test-set images were assessed based on the following image parameters: sharpness, contrast, brightness, uniform illumination, and color separation. The parameters were obtained in a survey of pathologists as the most relevant image features in the HercepTest slide diagnosis. The weight of the individual parameters in the overall quality, as obtained from the survey, is given by sharpness: 0.377, contrast: 0.189, brightness: 0.166, uniform illumination: 0.141, and color separation: 0.126, where the total sum of the individual weights equals to 1.
The image quality assessment method was designed such that the quality variations introduced by WSI scanners are captured, independent of slide content. The method consisted of three steps: (i) computation of the absolute pixel performance of the parameters, called metric value, representing scan quality and content. For example, the brightness metric, given by the mean luminance intensity, is dependent on the stain type and light intensity of the scanner; (ii) removing content dependency from the metric value by comparing an image with respect to its reference image, which is the best available quality image with the same content. The resulting distortion value represents error introduced during scanning; (iii) mapping of the distortion values to quality ratings to provide an intuitive interpretation of image quality in the clinical context. The mapping function was derived from a subjective study. The study was designed to verify the measurement of metric and distortion values and to obtain thresholds for acceptable quality required for clinical diagnosis. The computation method of the metric and distortion values and the subjective study are published.[7] The following subsections describe the summary of the three image quality assessment steps.
Metric Value Computation
The metric values were computed by applying robust image processing algorithms, based on the absolute pixel performance of the parameters. The sharpness parameter was measured by the number of edges detected in an image, such that a sharper image contains more edges than a blur image.[14] The contrast parameter was computed as the difference between the darkest and the lightest pixels in an image.[15] The brightness metric was measured as the mean value of luminance pixels. The uniform illumination metric was measured as the consistency in luminance pixels across an image background. The color separation metric was measured as the divergence between the blue and brown colors present in the HercepTest images based on the principal component analysis.[16] The metric values were represented in the range between 0 and 1, where given two images with the same content, the higher numbers indicate better quality.
Distortion Value Computation
Given a set of images corresponding to the same ROI, we first selected a reference image as the best quality image available. The selection was based on the highest scoring overall quality performance, computed by adding the metric values of the five image quality parameters according to the weights of the individual parameters obtained from the pathologists’ survey. To characterize the distortion behavior of the content, we manipulated the reference image using image processing filters based on principles similar to the ones used in the metric value computation. The distortion values represent degree of errors introduced during scanning, independent of content. For all the parameters, we applied six equally spaced distortion values in a predefined range, which were acquired in a pilot study, such that the range covers the perceptual limit from not noticeable to an unacceptable level of distortion. The distortion values for brightness were set between −0.5 (darker) and 0.5 (brighter), and the rest of the parameters were set between 0 (reference image) and −1 (most distorted). Given a reference image, the total number of distorted image generated were 30 (5 parameters × 6 distortion levels). Figure 3 shows an example reference image after applying different degrees of distortion.
Figure 3.
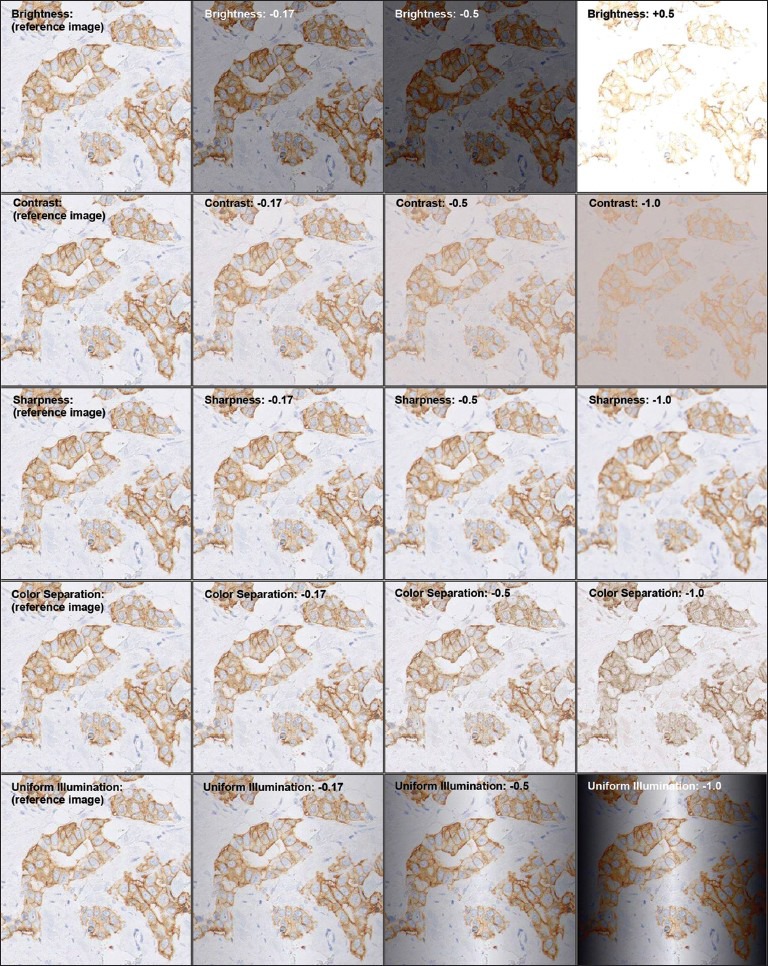
An example image with different degrees of distortion (given in column) per metric (given in row). The images in the first column are unmodified, with the distortion value 0. The images are cropped and downscaled for illustrative purpose
The mapping between distortion values and metric values, applicable to a set of images with the same content, was obtained by subjecting a reference image by a predefined range of distortion values and then computing metric values on the distorted images. If the distortion value of an image equals 0, it is considered at least as good as its reference image. The values farther from 0 indicate lower quality or higher distortion. Figure 4 shows five typical mapping curves of the image parameters in four images representing different HercepTest score types. In all of the quality parameters, the metric distortion curves were found to be continuous, monotonous and span a large range over both axes representing a robust mapping. The curves for the sharpness and color separation level off horizontally for small and large distortion values, respectively. The mapping curves in these ranges are sensitive to small variations in metric value, which are transformed in larger variations of distortion values. For example, in the images with the HER2 scores 0 and 1+, the presence of brown color are minimum. Therefore, the reduction in color separation reaches saturation at the distortion value around −0.67 and subjecting it to higher distortion values does not result in any perceptual difference in the image or the metric value.
Figure 4.
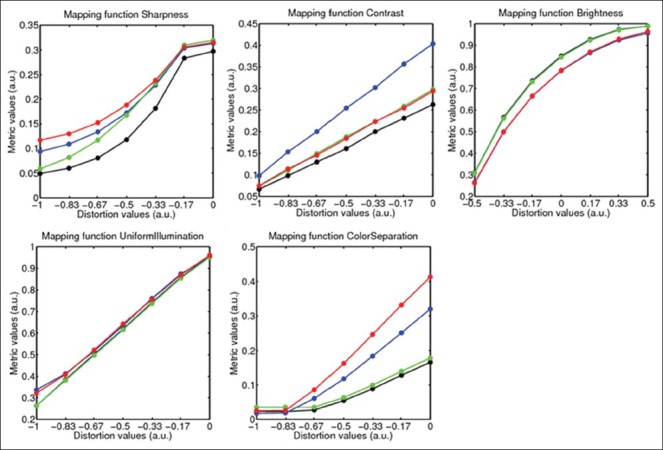
Mapping function of the five image quality parameters as computed on four example reference images of different score types. The functions corresponding to HER2 scores 0, 1+, 2+, and 3 + are shown in black, green, red and blue colors, respectively
Quality Rating Computation
The distortion values were translated to quality ratings, according to the results of the subjective study.[7] The study used a test set of 12 HerepTest slides, which represented the uniform distribution of the following score categories: 0, 1+, 2+, 3+. In each slide, an ROI was selected by a pathologist as a clinically relevant content. Given thirty scans (ten iterations by three scanners) per slide, a reference image was computed, as described in the section metric value computation, to be used as a test image. The test image set included one original image and six distorted images with a predefined range of distortion levels per parameter, resulting in 12 ROI × (5 parameters × 6 distortion level + 1 undistorted) totaling to 372 images. The test was participated by 69 pathologists from Europe and The USA. The participants were asked to rate the images as a level of comfort for providing a HercepTest score in the scale of one (very uncomfortable) to five (very comfortable). The scale three was explicitly mentioned as the level at which they are just comfortable enough for performing diagnosis. They were also requested to provide ratings regarding image quality only, regardless of the clinical complexity of the content.
Figure 5 shows the ratings given by all the readers (in gray curves) for the five image quality parameters: brightness, contrast, sharpness, color separation, and uniform illumination. Given a large variation among individual pathologists’ rating, the mean value does not provide a robust representation of quality. Therefore, we computed the representative ratings (in red lines) as lower values of the single-tailed 95% confidence interval of the mean rating based on the two-way ANOVA, with slides and readers as independent random factors and distortion values as dependent parameter. The representative ratings provide, per distortion value, the most conservative quality score, according to 95% of the participating pathologists. The trend of the representative curves resemble the metric distortion curves, shown in Figure 4, which shows overall similarity in subjective and objective quality evaluation. The representative curves were used as mapping functions to translate distortion values to quality ratings. As a final outcome, the quality of an image was represented by values between one (very poor) and five (excellent), where the mid value three was considered as the acceptable level of quality. The range of values is the same as used by pathologists in the subjective study.
Figure 5.
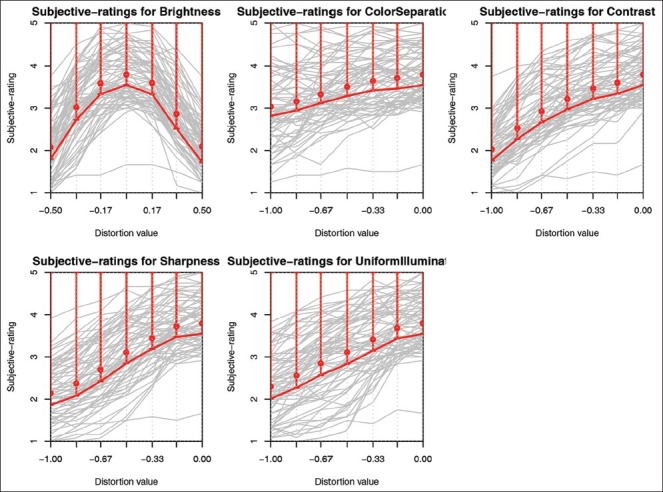
From left to right and top to bottom: Sharpness, contrast, brightness, uniform illumination, and color separation. Individual reader perception curves (gray), mean rating values (red circle), representative rating curve (red line) corresponding to 95% one-tailed confidence interval
RESULTS AND DISCUSSION
Under the three sub-studies: Inter-S, intra-S, and IDIS, we iteratively scanned 36 test slides generating in total 2160 whole slide images. For every substudy, four ROIs per whole slide image were selected, totaling to a test set of 8640 images. The images were analyzed in terms of five image parameters resulting in 43,200 quality rating values. In all the sub-studies, at least 99% of the test images were found to be above or at the level of acceptable quality.
Figure 6 shows quality analysis results of the parameter contrast in the inter-S study as histograms of metric values, distortion values and ratings of the 4320 (36 slides × 4 ROIs × 3 scanners × 10 days) test images. The histograms were computed with a uniform bin size of 0.01. Figure 6a illustrates the spread of the metric values, which are in the range of 0.2 and 0.6 and it is difficult to differentiate scanners based on their performance. Since the metric values are influenced by image content, they provide little information about scanner quality. Figure 6b shows a histogram of the distortion values, which are spread between −0.17 and 0. The performance of the three scanners appears different. The scanner given by red color shows the best contrast performance, where about 41% of its images are either selected as a reference image or assessed as good as the reference. It is to be noted that since a reference image is selected based on the weighted performance of the five image quality parameters, an image with the contrast distortion equals 0 does not guarantee it to be a reference image. Figure 6c shows histogram of the ratings, where the values are concentrated in the range of 3.35 and 3.56. The ratings of the images produced by the scanner given by the red color show better contrast than the other two scanners. Overall, 99.86% of the test images in the inter-S study pass the rating threshold of three. The performance of the scanners in other quality parameters is also comparable to that of contrast.
Figure 6.
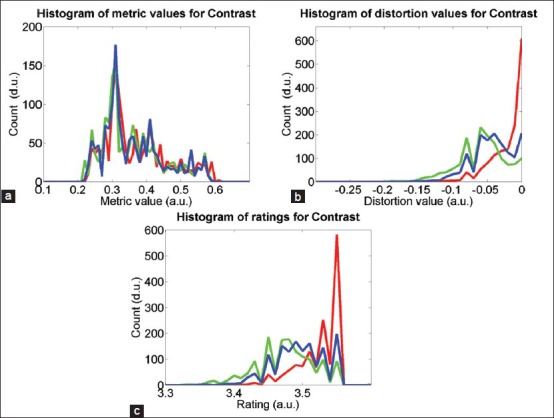
Histograms of (a) metric values, (b) distortion values, and (c) ratings on contrast parameter in inter-S study. The red, green, and blue colors represent three scanners used in the study
We further analyzed the data to identify performance difference among the scanners. Figure 7 shows the overall rating histograms of the images per scanner. The overall rating is computed as a weighted sum of the ratings of the five image quality parameters. The scanner, represented the by red curve, show higher overall quality rating than the other two scanners, represented by the green and blue curves. This matches with the observation in Figure 6 that the red scanner performs better than the other two scanners.
Figure 7.
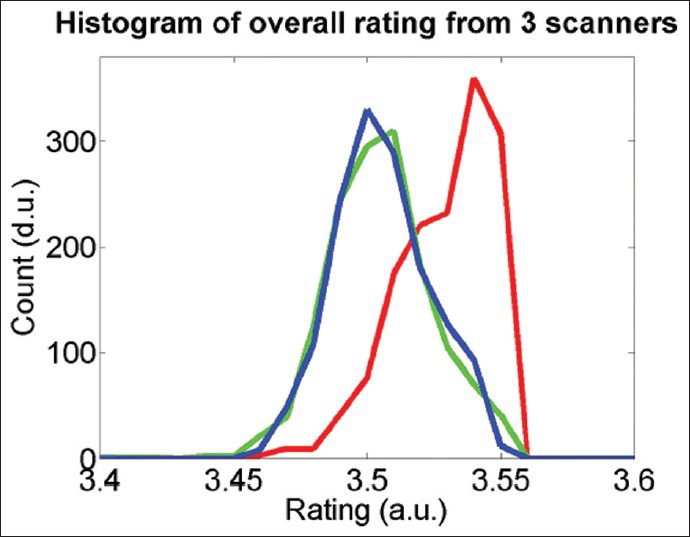
Histograms of overall quality ratings of the test images produced by the three scanners given by red, green, and blue curves
The intra-S and IDIS studies produced comparable results to that of the inter-S study. In both studies, at least 99% of the test images pass the required quality threshold. The results matched with our observation that the images do not vary perceptually among iterative scans in a system and across multiple systems. The reasons behind the failed cases were: (i) when only a single color was present (e.g., in case of HER2 type 0+), the metric-to-distortion mapping function of the color separation parameter saturates at a lower level of distortion level resulting in a noisy function; (ii) when the ROI alignment was not optimal (e.g., a part of the content was missing); (iii) when there was not sufficient empty glass area present in an image, the background detection performed as a part of the uniform illumination parameter measurement generated unreliable result.
In our subjective quality evaluation,[7] pathologists’ ratings were found to be influenced by the HER2 score types such that images with 3+ scores were perceived as higher quality than the other score type images at every distortion level. Figure 8a shows the histogram of the subjective scores per score types in the subjective test set, where the score of 3+ images are significantly different than the rest. We analyzed our quantitative ratings to check if it contains any bias due to the score types. Figure 8b shows histograms of the overall quality ratings in inter-S test images in four HER2 types, where all the score types perform similar to each other. The results show that quantitative quality assessment is independent of the score types.
Figure 8.
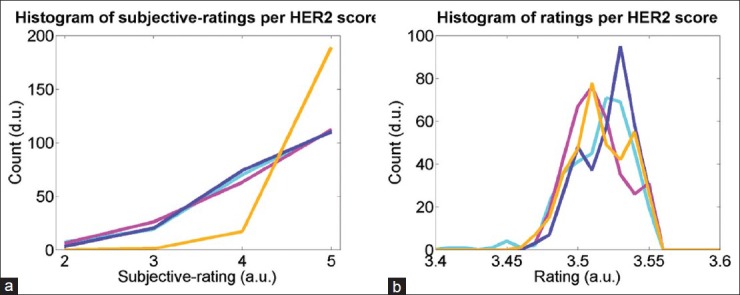
Histograms of overall quality ratings per HER2 score types 0+ (cyan), 1+ (purple), 2+ (magenta), and 3+ (orange): (a) according to subjective evaluation[7] and (b) according to quantitative evaluation in inter-S study
CONCLUSION
In this paper, we described the evaluation of WSI scanners based on the quantitative assessment of image quality. The main contributions of the paper can be summarized as:
Design of the experiment to measure scanner reproducibility in terms of image quality, given system, slide, and time variations.
Methods to quantify and manipulate image parameters.
Methods and models to map different image quality representations: absolute pixel performance (content dependent), called the metric value; relative image degradation (content independent), called the distortion value; and clinically relevant scores, called the rating.
The described WSI scanner evaluation method, including the image quality measurement and manipulation methods are generic. In this paper, we used the methods on the HercepTest images; however, they are applicable also to other tissues or stains types. Additional parameters can be added to assess quality, if necessary, while following the same approaches to measure, map and quantify image quality.
The proposed quantitative quality measurements can produce reproducible results and are not biased by the complexity of the cases. Once ROIs in a whole slide image are annotated, the iterative processes per slide such as ROI image alignment and image quality assessment are automatic. Manual intervention may require only in the case of ROI alignment failure. Therefore, once the method is established in the work-flow, its operation cost is minimal. The method can be incorporated in the development, production and quality monitoring of the scanners. It can also be applied for other purposes such as: evaluating pathology slide quality; design and testing of imaging system or components (both hardware and software), and deriving image quality information to be used in image processing, automated detection/diagnosis.
A limitation of the current approach is that it is unable to relate the impact of scanner performance to the accuracy or reliability in clinical diagnosis. Our evaluation is based on the image quality; however, perception of quality and its influence on the clinical diagnosis is not explicit. Another limitation of the described image quality measurement method is that it requires an optimal quality image as reference. We selected a reference image based on the absolute pixel performance from multiple scans of the same ROI of a tissue specimen. In case a reference image does not correspond to an optimal quality, or if the choice of an optimal quality image is not unique, for example, when images are obtained using scanners from different manufacturers with subtle difference in content representation, the assessment may become inaccurate.
As a next step, we plan to employ the described methods and tools to evaluate quality and reproducibility involving multiple tissues, stains, and scanner generations. We also plan to study how image quality corresponds to the accuracy and reproducibility of a clinical task by pathologists.
Financial Support and Sponsorship
This study was supported by Philips Digital Pathology Solutions.
Conflicts of Interest
There are no conflicts of interest.
Footnotes
Available FREE in open access from: http://www.jpathinformatics.org/text.asp?2016/7/1/56/197205
REFERENCES
- 1.Pantanowitz L. Digital images and the future of digital pathology. J Pathol Inform. 2010;1 doi: 10.4103/2153-3539.68332. pii: 15. [DOI] [PMC free article] [PubMed] [Google Scholar]
- 2.Krupinski EA, Silverstein LD, Hashmi SF, Graham AR, Weinstein RS, Roehrig H. Observer Performance using virtual pathology slides: Impact of LCD color reproduction accuracy. J Digitl Imaging. 2012;25:738–43. doi: 10.1007/s10278-012-9479-1. [DOI] [PMC free article] [PubMed] [Google Scholar]
- 3.Yagi Y. Color standardization and optimization in whole slide imaging. Diagn Pathol. 2011;6(Suppl 1):S15. doi: 10.1186/1746-1596-6-S1-S15. [DOI] [PMC free article] [PubMed] [Google Scholar]
- 4.Janowczyk A, Basavanhally A, Madabhushi A. Stain Normalization using Sparse AutoEncoders (StaNoSA): Application to digital pathology. Comput Med Imaging Graph. 2016 doi: 10.1016/j.compmedimag.2016.05.003. pii: S0895-611130040-4. [DOI] [PMC free article] [PubMed] [Google Scholar]
- 5.Bautista PA, Hashimoto N, Yagi Y. Color standardization in whole slide imaging using a color calibration slide. J Pathol Inform. 2014;5:4. doi: 10.4103/2153-3539.126153. [DOI] [PMC free article] [PubMed] [Google Scholar]
- 6.Korzyska A, Neuman U, Lopez C, Lejeun M, Bosch R. The method of immunohistochemical images standardization.Image Processing and Communications Challenges 2, Advances in Intelligent and Soft Computing. 2010:213–21. [Google Scholar]
- 7.Shrestha P, Kneepkens R, van Elswijk G, Vrijnsen J, Ion R, Verhagen D, et al. Objective and Subjective Assessment of Digital Pathology Image Quality. AIMS Medical Science. 2015;2:65–78. [Google Scholar]
- 8.Cheng WC, Keay T, O′Flaherty N, Wang J, Ivansky A, Gavrielides MA. Assessing Color Reproducibility of Whole-slide Imaging Scanners. Proceedings of SPIE Medical Imaging: Digital Pathology. 2013 [Google Scholar]
- 9.Shrestha P, Hulsken B. Color accuracy and reproducibility in whole slide imaging scanners. Journal of Medical Imaging. 2014;1(2):027501. doi: 10.1117/1.JMI.1.2.027501. [DOI] [PMC free article] [PubMed] [Google Scholar]
- 10.Dako HercepTest™ Product Information. [Last Accessed on 2016 Nov 28]. Available from: http://www.agilent.com/en/products/pharmdx/herceptest-kits/herceptest .
- 11.Dako HercepTest. Interpretation Manual-Breast. [Last accessed on 2016 Nov 28]. Available from: http://www.agilent.com/cs/library/usermanuals/public/28630_herceptest_interpretation_manual-breast_ihc_row.pdf .
- 12.Wilbur DC, Brachtel EF, Gilbertson JR, Jones NC, Vallone JG, Krishnamurthy S. Whole slide imaging for human epidermal growth factor receptor 2 immunohistochemistry interpretation: Accuracy, Precision, and reproducibility studies for digital manual and paired glass slide manual interpretation. J Pathol Inform. 2015;6:22. doi: 10.4103/2153-3539.157788. [DOI] [PMC free article] [PubMed] [Google Scholar]
- 13.Mueller D, Vossen D, Hulsken B. Real-time deformable registration of multi-modal whole slides for digital pathology. Comput Med Imaging Graph. 2011;35:542–56. doi: 10.1016/j.compmedimag.2011.06.006. [DOI] [PubMed] [Google Scholar]
- 14.Yeo TT, Ong SH, Jayasooriah, Sinniah R. Autofocusing for tissue microscopy. Image Vis Comput. 1993;11:629–39. [Google Scholar]
- 15.Thompson W, Fleming R, Creem-Regehr S, Stefanucci JK. Visual Perception from a Computer Graphics Perspective. USA: A. K. Peters Ltd; 2011. [Google Scholar]
- 16.Tzeng D. New York: 1999. Spectral-Based Color Separation Algorithm Development for Multiple-ink Color Reproduction. Ph. D. Thesis, RIT, Rochester. [Google Scholar]


