

Abstract
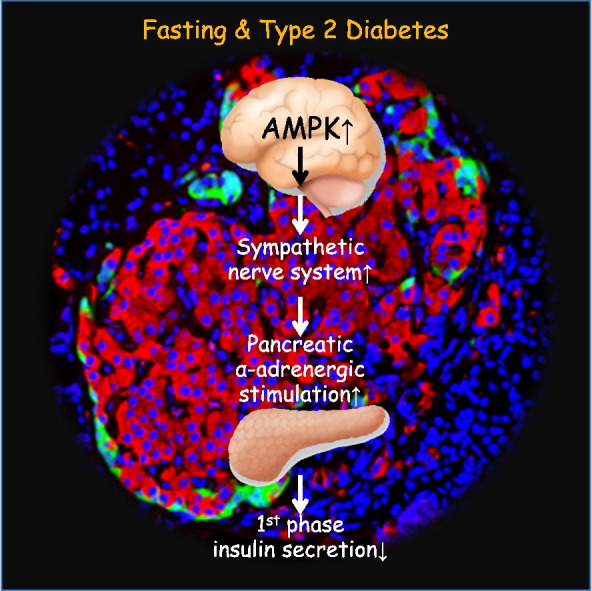
Glucose-stimulated insulin secretion (GSIS) by pancreatic β cells is biphasic. However, the physiological significance of biphasic GSIS and its relationship to diabetes are not yet fully understood. This study demonstrated that impaired first-phase GSIS follows fasting, leading to increased blood glucose levels and brain glucose distribution in humans. Animal experiments to determine a possible network between the brain and β cells revealed that fasting-dependent hyperactivation of AMP-activated protein kinase in the hypothalamus inhibited first-phase GSIS by stimulating the α-adrenergic pancreatic nerve. Furthermore, abnormal excitability of this brain-β cell neural axis was involved in diabetes-related impairment of first-phase GSIS in diabetic animals. Finally, pancreatic denervation improved first-phase GSIS and glucose tolerance and ameliorated severe diabetes by preventing β cell loss in diabetic animals. These results indicate that impaired first-phase GSIS is critical for brain distribution of dietary glucose after fasting. Furthermore, β cells in individuals with diabetes mistakenly sense that they are under conditions that mimic prolonged fasting. The present study provides additional insight into both β cell physiology and the pathogenesis of β cell dysfunction in type 2 diabetes.
Abbreviations: ACC, acetyl CoA carboxylase; AICAR, 5-aminoimidazole-4-carboxamide-1-β-d-ribofuranoside; AIR, acute insulin response; AMPK, AMP-activated protein kinase; CT, computed tomography; 2-DG, 2-deoxy-d-glucose; 18F-FDG, 2-[fluorine-18]-2-deoxy-d-glucose; GIP, glucose-dependent insulinotropic polypeptide; GLP-1, glucagon-like peptide-1; GSIS, glucose-stimulated insulin secretion; HOMA-β, homeostasis model assessment beta-cell function index; ICV, intracerebroventricular; IPITT, intraperitoneal insulin tolerance test; FSIVGTT, frequently sampled intravenous glucose tolerance test; Kg, glucose disappearance rate; LETO, Long-Evans Tokushima Otsuka; OGTT, oral glucose tolerance test; OLETF, Otsuka Long-Evans Tokushima Fatty; PET, positron emission tomography; PNx, pancreatic denervation; SD, Sprague-Dawley; SNPs, single nucleotide polymorphisms; SNS, sympathetic nervous system; SUV, standardized uptake value
Keywords: First-phase GSIS, Pancreatic β cell, Starvation, Diabetes, Insulin secretion
Highlights
-
•
Fasting-induced hypothalamic AMPK activation inhibited first-phase GSIS by stimulating the α-adrenergic nerve.
-
•
The brain-pancreas neural axis was involved in β cell dysfunction and glucose intolerance in diabetes.
-
•
Pancreatic denervation improved first-phase GSIS, glucose tolerance and β cell survival in type 2 diabetic animals.
Glucose-stimulated insulin secretion (GSIS) from pancreatic β cells is biphasic. Furthermore, first-phase GSIS is inhibited in type 2 diabetes. This study revealed that fasting reduced first-phase GSIS by signaling via the brain-pancreatic β cell neural axis, which is essential for maintaining glucose supply to the brain at re-feeding after fasting. Abnormal excitability of this neural axis was also associated with impaired first-phase GSIS in type 2 diabetes. Surgical pancreatic denervation improved diabetes in an animal study. The present data reveal that diabetic β cells exist under conditions that mimic starvation and provide a therapeutic potency of pancreatic denervation against diabetes.
Graphical Abstract
1. Introduction
Insulin has many physiological roles, including anabolic action on dietary energy storage, which is important for overcoming upcoming fasting periods (Cahill, 1971). However, the anti-catabolic action of insulin must be suppressed during fasting to avoid a life-threatening hypoglycemic event. Therefore, the precise systems that monitor fasting or feeding states and subsequently control insulin action are essential for maintaining whole-body glucose homeostasis to overcome fasting. Dysregulation of these systems contributes to type 2 diabetes pathogenesis (Kadowaki, 2000, Kahn and White, 1988, Kulkarni et al., 1999, Seino et al., 2011). Therefore, more complete knowledge of the relationship between insulin physiology and fasting will contribute to a better understanding of type 2 diabetes and may lead to effective therapeutic options.
Glucose-stimulated insulin secretion (GSIS) from pancreatic β cells is biphasic (Porte and Pupo, 1969, Curry et al., 1968, Seino et al., 2011). Since the first report of biphasic GSIS by Curry et al. in 1968, the dynamics of biphasic GSIS have been examined under both normal physiological conditions and in the pathogenesis of type 2 diabetes (Pfeifer et al., 1981, Polyzogopoulou et al., 2003, Weyer et al., 1999). The current consensus holds that a deficient first-phase GSIS as determined by a frequently sampled intravenous glucose tolerance test (FSIVGTT) represents the earliest identifiable change to β cells in the course of type 2 diabetes. First-phase GSIS in the FSIVGTT is closely associated with the early insulin response to oral glucose ingestion (Caumo and Luzi, 2004, Basu et al., 1996). Furthermore, the loss of an early insulin response is involved in glucose intolerance in diabetes (Basu et al., 1996, Calles-Escandon and Robbins, 1987, Mitrakou et al., 1992). Therefore, the quality of biphasic GSIS control may represent a therapeutic target for better glycemic regulation in type 2 diabetes (Seino et al., 2011, Caumo and Luzi, 2004). However, the mechanisms underlying diabetes-related abnormal biphasic GSIS are not yet fully understood.
Interestingly, fasting also inhibits first-phase GSIS (Fink et al., 1974, Grey et al., 1970). This suggests that fasting-dependent changes in first-phase GSIS may affect glucose metabolism even in non-diabetic individuals. Given that glucose distribution is independent of insulin action in the brain but insulin-dependent in peripheral tissues, such as skeletal muscle and adipose tissue, changes in first-phase GSIS may influence dietary glucose distribution to tissues during re-feeding. Decreased first-phase GSIS after fasting may accelerate a passive glucose distribution to the brain, whereas enhanced first-phase GSIS during frequent feeding could stimulate glucose uptake and anabolism in insulin-sensitive tissues. This may represent an important physiological role of first-phase GSIS in whole-body glucose homeostasis during re-feeding.
In this study, we hypothesized that biphasic GSIS is an adaptive system that appropriately distributes dietary glucose to either the brain or insulin-sensitive tissues, depending on the last fasting period. Furthermore, we proposed that both diabetes- and fasting-related inhibition of first-phase GSIS are regulated by a common system. We demonstrated that hypothalamic AMP-activated protein kinase (AMPK) senses fasting periods and controls first-phase GSIS via the sympathetic nervous system (SNS). Additionally, dysregulation of this system is involved in β cell dysfunction in type 2 diabetes.
2. Materials and Methods
2.1. Study Approvals
All human study volunteers provided written informed consent. The study protocol was approved by the Scientific-Ethical Committees of Shiga University of Medical Science and adhered to the guidelines of the Declaration of Helsinki regarding ethical principles for medical research involving human subjects. Additionally, all procedures with animals were performed in accordance with the guidelines of the Research Center for Animal Life Science of Shiga University of Medical Science and followed the guidelines provided by the Animal Research: Reporting In Vivo Experiments (ARRIVE) guideline.
2.2. Human 18F-FDG-PET-CT Analysis
Fig. S1A displays a schematic of the protocol for 2-[fluorine-18]-2-deoxy-d-glucose (18F-FDG) positron emission tomography (PET)-computed tomography (CT) and intravenous glucose infusion after 3 and 12 h of fasting in three healthy volunteers. We chose 3-h and 12-h fasts to represent physiologically relevant timeframes from daily life. These intervals correspond to common intervals between breakfast and lunch and between dinner and breakfast, respectively. We performed 18F-FDG-PET-CT on the three volunteers after the 3-h and 12-h fasts. The interval between the two examinations was 2 weeks. For the 12-h fasting condition, all volunteers were instructed to refrain from smoking and drinking coffee or alcoholic beverages from 9:00 pm on the night before the study. For the 3-h fasting condition, the volunteers received oral glucose (75 g) at 6:00 am and were placed in a comfortable supine position. The experiments began at 9:00 am. Glucose (0.3 g/kg) was administered intravenously over 1.5 min, followed by intravenous injection of 18F-FDG. Sequential scans of the brain were obtained at 3-min intervals during the first 30 min after the injections. Whole-body scans were obtained 120 min after glucose and 18F-FDG injections. The standardized uptake value was analyzed to quantify the accumulated 18F-FDG in the indicated tissues (Lucignani et al., 2004).
2.3. Human FSIVGTTs
Fig. S1B displays a schematic of the FSIVGTT performed in 40 healthy volunteers after fasting for 3 or 12 h. The fasting and meal conditions were the same as those described in Section 2.2. At 9:00 am, fasting blood samples were collected. We then administered 0.3 g/kg glucose intravenously over 1.5 min, and blood was collected after 2, 4, 6, 8, 10, 12, 14, 16, 19, 22, 27, 32, 42, 52, 62, 72, 82, 92, 102, 112, and 122 min. The acute insulin response (AIR) and glucose disappearance rate (Kg) were evaluated with MINMOD Millennium (Pacini and Bergman, 1986, Boston et al., 2003). Blood glucose, plasma insulin, free fatty acid, and hemoglobin A1c (NGSP value) concentrations were measured using standard laboratory methods. The active forms of glucagon-like peptide 1 and glucose-dependent insulinotropic polypeptide were measured using cell-based bioassay methods (Yanagimachi et al., 2016). The mean values of these parameters as well as clinical characteristics, including gender, age, body weight, body mass index, homeostasis model assessment of insulin resistance, homeostasis model assessment of beta cell function (HOMA-β), and blood pressure, in the 40 volunteers are displayed in Table S1.
2.4. Hyperglycemic (HG) Clamping
HG clamping was performed using standard methodology in 12 of the 40 volunteer subjects who had undergone FSIVGTTs. Plasma insulin concentrations at 120 min after glucose infusion initiation were defined as steady-state insulin levels. The clamped glucose level for evaluating insulin secretory capacity was 200 mg/dL. Time-dependent changes in mean glucose and insulin concentrations in the 12 subjects are displayed in Figs. S2A and B.
2.5. Genomic DNA Extraction and Single Nucleotide Polymorphism (SNP) Genotyping
Genomic DNA samples were harvested from peripheral blood leukocytes from 40 healthy subjects following a standard protocol. Individual SNP genotypes were analyzed using a multiplex-PCR invader assay (Ohnishi et al., 2001). We selected SNPs associated with insulin secretory capacity among those associated with diabetes development. These SNPs are listed in Table S2. The accumulated number of risk alleles for impaired insulin secretion was defined as genetic risk score (GRS).
2.6. Animal Care
Male Sprague-Dawley (SD), Long-Evans Tokushima Otsuka (LETO), and Otsuka Long-Evans Tokushima Fatty (OLETF) rats were obtained from Shimizu Laboratory Supplies (Kyoto, Japan). Experimental rats were individually housed in a regulated environment (22 ± 2 °C, 55% ± 10% humidity, 12:12 h light/dark cycle with light on at 7 am). Food and water were available ad libitum except as otherwise indicated. During long-term fasting experiments up to 72 h, rats were able to freely access drinking water. We monitored their physical condition at 6-h intervals. Throughout the study, none of the fasted rats displayed signs of wasting.
2.7. Rat FSIVGTT Study
Cannulas were inserted into the cervical veins in the indicated rats under anesthesia. One week later, glucose (0.35 g/kg body weight) was intravenously administered to each animal. Blood samples were collected via the tail vein and/or portal vein via a portal vein cannula at 0, 1, 2, 4, 6, 8, 10, 15, 20, 30, 60, 90, and 120 min after glucose injection. Blood glucose concentrations were measured using a Glutest sensor (Sanwa Kagaku, Nagoya, Japan), and plasma insulin concentrations were determined by ELISA (Morinaga Institute of Biological Science, Tokyo, Japan).
The AIR was calculated as the area under the curve (AUC) of insulin concentrations during the first 6 min after glucose injection. Kg, defined as the reduction in the percentage of plasma glucose concentration, was calculated using the formula (45): Kg (%/min) = (0.693/t 1/2 glucose) × 100, where t 1/2 glucose is the plasma half-life of glucose, calculated from the slope of log-transformed blood glucose concentrations between 4 and 30 min after glucose administration. During this time interval, the decrease in log-transformed glucose concentration was linear.
2.8. Rat Oral Glucose Tolerance Test (OGTT) and Intraperitoneal Insulin Tolerance Test (IPITT) Studies
For OGTTs, rats were fasted for 8 h, followed by oral glucose administration (2 g/kg body weight). Tail vein blood samples were collected at 0, 15, 30, 60, 90, and 120 min. Glucose and insulin concentrations were measured as described above. The early insulin response was calculated as previously described (Δinsulin15 min/Δglucose15 min) (Han et al., 2009, Yasuhara et al., 2003). For IPITTs, rats were fasted for 8 h followed by intraperitoneal insulin injection (0.75 IU/kg body weight). Blood glucose was measured using tail blood collected at 0, 15, 30, 60, 90, and 120 min after injection.
2.9. Intravenous Infusion of Drugs
Phentolamine (3 mg/kg/h), propranolol (3 mg/kg/h), or both were intravenously injected through a cervical cannula into 10-week-old male SD and 32-week-old male OLETF rats following fasting (24-h or 72-h, as indicated). The infusion began 2 h before glucose administration and continued until the end of the FSIVGTT. Epinephrine (9 μg/kg/min) and norepinephrine (0.1 mg/kg/h) were continuously administered to 10-week-old male SD rats beginning 30 min before glucose administration and continuing until the end of the FSIVGTT.
2.10. Intracerebroventricular (ICV) Drug Infusion
Nine-week-old male SD and 31-week-old male OLETF rats with intravenous cannulas underwent stereotactic implantation of a stainless steel guide cannula (Plastics One, Roanoke, VA) into the third cerebral ventricle. One week later, glucose (60 mg/h), insulin (40 mU/h), 2-deoxy-d-glucose (2-DG; 100 μmol), 5-aminoimidazole-4-carboxamide-1-β-d-ribofuranoside (AICAR; 10 μg), LY294002 (10 nmol), or compound C (10 μg) was infused or injected into the inserted cannula 30 min before intravenous glucose injection. All substances were dissolved in artificial cerebrospinal fluid.
2.11. Pancreatic Denervation (PNx) and Hepatic Vagotomy (HVx) in SD Rats
Nine-week-old male SD rats with intravenous cannulas underwent PNx (Buijs et al., 2001) or HVx (Uno et al., 2006) as previously described. All operations were performed 1 week before the indicated examinations. PNx, HVx, and sham operations were followed by FSIVGTTs after a 72-h fast.
2.12. Effect of PNx on First-Phase GSIS in OLETF Rats
We examined whether PNx could ameliorate the decrease in first-phase GSIS and glucose intolerance in 32-week-old OLETF rats. Thirty-one-week-old male OLETF rats with intravenous cannulas were randomly assigned to receive either the sham operation or PNx. FSIVGTTs were performed following a 24-h fast 1 week after the operation.
2.13. Preventive Effect of PNx on Diabetes in OLETF Rats
The aim of this experiment was to investigate whether PNx could prevent the development of glucose intolerance in OLETF rats. Eight-week-old male OLETF rats were randomly assigned to receive either the sham operation or PNx and were followed until 32 weeks of age. Age-matched LETO rats that underwent a sham-operation were used as the control group. At the end of the experiment, the three groups of rats underwent IPITTs and OGTTs and were then sacrificed after urine collection. Tissue samples were fixed with 4% paraformaldehyde in PBS and embedded in paraffin. Plasma samples were stored at − 80 °C until further use.
2.14. Therapeutic Effect of PNx on Diabetes in OLETF Rats
To determine the therapeutic potency of PNx on the established diabetic phenotype, 32-week-old male OLETF rats were randomly assigned to receive either the sham operation or PNx. OGTTs were performed 3 weeks after the operation. Blood glucose levels in the rats were then monitored every week until 76 weeks of age to assess whether they developed severe hyperglycemia, defined as a blood glucose level ≥ 400 mg/dL. The data were statistically analyzed using the Kaplan-Meier method and compared using log-rank tests.
Three of the sham-operated OLETF rats that developed severe hyperglycemia underwent PNx at 76 weeks of age. OGTTs were performed before and after surgery to investigate whether PNx can improve the severe diabetic phenotype observed in 76-week-old OLETF rats.
2.15. Histological Analysis
Fixed tissues were embedded in paraffin and sectioned. Kidney sections were stained with PAS, and liver and white adipose tissue sections were stained with hematoxylin and eosin. Pancreatic sections were stained with antibodies against insulin (1:500, Abcam, #ab7842) and glucagon (1:100, Sigma-Aldrich, #G2654). TUNEL staining was performed in accordance with the manufacturer's instructions (TaKaRa, #MK500). Immunofluorescent staining of the hypothalamus was performed with an anti-phosphorylated AMPKThr172 antibody (1:50, Cell Signaling Technology, #2531). The rat ventromedial hypothalamic nucleus (VMH) was sectioned 2.56 mm posterior to the bregma, ± 0.4 mm laterally and 9.5 mm from the dural surface (Satoh et al., 1997). Podocyte structure was evaluated by scanning electron microscopy (Hitachi S-570, Tokyo, Japan). To analyze the β cell area in pancreatic sections, the proportion of the insulin-positive area in the total pancreatic area was evaluated in each insulin-stained section using ImageJ software. Seven pancreatic sections were analyzed in each animal. The apoptotic index was calculated as a percentage of TUNEL-positive cells using the following formula: apoptotic index = 100 × (number of TUNEL-positive cells / number of insulin-positive cells).
2.16. Electrophoresis of Urine Samples
Collected urine samples were boiled in sodium dodecyl sulfate (SDS) sample buffer and subjected to SDS-PAGE. Gels were visualized by staining with Coomassie Brilliant Blue.
2.17. Western Blot Analysis
Rat hypothalamus samples were homogenized in an ice-cold lysis buffer containing 150 mmol/l NaCl, 50 mmol/l Tris-HCl (pH 8.0), 0.1% SDS, 1% Nonidet P-40, a PhosSTOP Phosphatase Inhibitor Cocktail (Rosche, Osaka, Iapan) and protease inhibitor cocktail (Boehringer Mannheim, Lewes, UK). These samples were resolved by 10% SDS-polyacrylamide gel electrophoresis and transferred to polyvinylidene fluoride membranes (Immobilon, Bedford, MA). The membranes were incubated with anti-β actin antibody (Sigma, Tokyo, Japan, #A5316), anti-phospho-acetyl CoA carboxylase (ACC) (Ser79) antibody (Upstate Cell Signaling, Lake Placid, NY, #07–303), anti-AMPK, anti-phospho AMPK (Thr172) and anti-ACC antibodies, (Cell Signaling Technology, Beverly, MA, #4150, #2531, and #3662 respectively), washed, and incubated with horseradish peroxidase-coupled secondary antibodies (Amersham, Buckinghamshire, UK). The blots were visualized using an enhanced chemiluminescence detection system (Perkin Elmer Life Science, Boston, MA).
2.18. Statistics
Values are expressed as the means ± SEM. In the human study, Student's t-test was used for statistical analysis of each parameter after normality was confirmed. Associations between parameters were analyzed with Pearson's correlation coefficient. For the animal studies, we performed Wilcoxon-Mann-Whitney tests and Kruskal-Wallis tests followed by post hoc Bonferroni analysis for comparison between two groups and among multiple groups, respectively. Survival parameters were determined using the Kaplan-Meier method and compared using log-rank tests. In all analyses, a P-value < 0.05 was defined as statistically significant.
3. Results
3.1. Effect of Fasting on Tissue Glucose Uptake after Glucose Injection in Healthy Human Subjects
We first explored whether fasting time affected whole-body glucose distribution. Brain images obtained during the first 30 min of intravenous co-injections of glucose and 18F-FDG revealed more rapid 18F-FDG uptake by the brain after a 12-h fast compared with that following a 3-h fast (Fig. 1A–C and Movie S1A–C). Whole-body images at 120 min indicated that most of the 18F-FDG accumulated in the brain after a 12-h fast, whereas skeletal muscles displayed the greatest accumulation after a 3-h fast (Fig. 1D–F and Movie S1A–C). The effect of fasting time on 18F-FDG deposition in other tissues varied among individual subjects (Fig. 1D–F and Movie S1A–C). These results suggest that fasting period length can affect whole-body glucose distribution during re-feeding.
Fig. 1.

Fasting increases brain glucose distribution in human subjects during an FSIVGTT.
(A–C) Sequential 18F-FDG-PET-CT images of the brain during the first 30 min of an FSIVGTT after 12-h and 3-h fasts in three independent subjects. The standardized uptake value (SUV) obtained from 18F-FDG-PET-CT images of the brain during the first 30 min of an FSIVGTT after 12-h and 3-h fasts in three independent subjects. (D–F) Whole-body analysis of 18F-FDG-PET-CT at 120 min post-glucose administration in three independent subjects. Analysis of the SUVs in the indicated tissues. Graphs display mean ± SEM. Statistical significance was calculated using paired Student's t-test. P < 0.05 indicates statistical significance. 18F-FDG-PET-CT, 2-[fluorine-18]-2-deoxy-d-glucose positron emission tomography-computed tomography; FSIVGTT, frequently sampled intravenous glucose tolerance test.
3.2. Effect of Fasting on First-Phase GSIS during FSIVGTTs in Healthy Human Subjects
We next investigated the possible involvement of first-phase GSIS in the fasting-dependent increase in glucose uptake in to the brain. Kg and AIR were significantly lower after a 12-h fast compared with those following a 3-h fast (Fig. 2A and B). Insulin sensitivity was similar (Fig. S2C). This phenomenon was observed in all subjects, although the rates of reduction varied among individuals (Fig. S2D). Therefore, the fasting-dependent reduction in first-phase GSIS and the subsequent Kg might be involved in a greater increase in passive brain glucose uptake in human subjects after longer fasting periods.
Fig. 2.

Fasting decreases first-phase GSIS in human subjects.
(A and B) Blood glucose changes and Kg (A) and plasma insulin changes and AIRs (B) during an FSIVGTT after 12-h and 3-h fasts (n = 40). (C) Glucose-insulin regression curves calculated from the results from FSIVGTTs after 12-h and 3-h fasts (n = 40). (D and E) Plots of the X-intercept (D) and X-coefficient (E) of the individual glucose-insulin lines (n = 40). (F and G) Plots (F) and proportional distribution (G) of the estimated insulin values calculated from the glucose-insulin regression curves for 3-h and 12-h fasted FSIVGTTs in 40 individuals. (H and I) Correlations of the estimated insulin concentrations at a blood glucose concentration of 200 mg/dL during an FSIVGTT with insulin concentrations during HG clamps (n = 12). (J and K) Correlation curves of the estimated insulin concentrations at a blood glucose concentration of 200 mg/dL during an FSIVGTT with HOMA-β (n = 40). Statistical significance was calculated using a paired Student's t-test. The horizontal bars represent the mean values. P < 0.05 indicates statistical significance; r indicates Pearson's rank correlation coefficient. GSIS, glucose-stimulated insulin secretion; Kg, glucose disappearance rate; AIR, acute insulin response; FSIVGTT, frequently sampled intravenous glucose tolerance test; HG clamp, hyperglycemic clamp; HOMA-β, homeostasis model assessment beta-cell function index.
The relationship between glucose and insulin concentrations during the FSIVGTT was approximately linear (Fig. 2C), with similar x-intercepts regardless of the fasting time (Fig. 2C and D). However, the X-coefficient was significantly lower after the 12-h fast compared with that following the 3-h fast (Fig. 2C and E), suggesting that differences in fasting duration affected the responsiveness of GSIS to changes in glucose levels. Fasting duration had no effect on the threshold glucose level required to enhance insulin secretion.
3.3. Clinical Significance of the Fasting-Dependent Decrease in First-Phase GSIS
The clinical significance of the 3-h and 12-h fasting FSIVGTT results was assessed in 12 of the 40 healthy subjects by comparing the results of these protocols with those of a HG (200 mg/dL) clamp technique (Fig. S2A and B)—a reliable method for evaluating insulin secretory capacity (DeFronzo et al., 1979). Using the glucose-insulin regression lines from FSIVGTTs conducted after 12-h and 3-h fasts, insulin levels were estimated at blood glucose levels of 200 mg/dL. We confirmed that the estimated insulin levels from FSIVGTTs after a 3-h fast were significantly higher than those obtained after a 12-h fast, similar to the AIR results (Fig. 2F and G). Furthermore, estimated insulin levels after a 3-h fast exhibited a stronger correlation with steady-state insulin levels determined using the HG clamp method when compared with results following a 12-h fast (Fig. 2H and I). Consistently, in all 40 subjects, the estimated insulin concentrations obtained from FSIVGTTs after a 3-h fast displayed stronger positive correlations with HOMA-β than those obtained after a 12-h fast (Fig. 2J and K).
To further demonstrate that a 3-h fast is superior for determining insulin secretory capacity during an IVGTT than a 12-h fast, we performed a correlation analysis between GRS associated with lower insulin secretory capacity and IVGTTs after different fasting periods using samples from all 40 volunteers. Both the AIRs and the estimated insulin levels obtained from 3-h fasted FSIVGTTs were inversely and more strongly correlated with the GRS, than those from 12-f fasted FSIVGTTs (Table 1). Collectively, an FSIVGTT after a 3-h fast may better determine insulin secretory capacity than that measured after the 12-h fast commonly employed in clinical settings.
Table 1.
Regression analysis between the genetic risk score for type 2 diabetes mellitus and the insulin secretion parameters evaluated by the 3-h and 12-h fasting IVGTTs.
| Acute insulin response (AIR) |
Estimated insulin levels at 200 mg/dl glucose |
|||
|---|---|---|---|---|
| 12-h fast | 3-h fast | 12-h fast | 3-h fast | |
| Unadjusted model | r = − 0.313 | r = − 0.369 | r = − 0.273 | r = − 0.472 |
| p = 0.050 | p = 0.019 | p = 0.089 | p = 0.002 | |
| Adjusted model | r = − 0.472 | r = − 0.490 | r = − 0.442 | r = − 0.513 |
| p = 0.003 | p = 0.002 | p = 0.006 | p = 0.001 | |
The genetic risk score (GRS) was determined using the cumulative number of risk alleles in each single nucleotide polymorphisms (SNPs). The SNPs used for the correlation analysis of the genetic risk score are listed in the Table S2. The acute insulin response (AIR) in the intravenous glucose tolerance test (IVGTT) was calculated with the MINMOD Millennium software. The estimated insulin level at 200 mg/dl of blood glucose was calculated from the glucose-insulin regression curve from the 3-h and 12-h fasting IVGTTs. The correlations between the GRS and each insulin secretion parameter were analyzed with an unadjusted model (upper) and a model adjusted by the body mass index and age (lower). r indicates Pearson's rank correlation coefficient. The P value indicates the significance of the correlation between the indicated parameters. P < 0.05 indicates statistical significance.
3.4. Effect of Fasting on First-Phase GSIS in Non-Diabetic Rats
In our human study, first-phase GSIS was diminished after a 12-h fast, suggesting that a longer fasting time may more strongly inhibit first-phase GSIS. Furthermore, the enhanced first-phase GSIS observed following a 3-h fast might be because of secondary effects of oral glucose ingestion rather than prior elevation of blood glucose levels. We addressed these issues by conducting double FSIVGTTs after longer fasting periods in rats.
The first FSIVGTT following a 72-h fast significantly inhibited first-phase GSIS with decreased Kg and led to the appearance of second-phase GSIS (Fig. 3A–D). In contrast, first-phase GSIS during the second FSIVGTT, which was conducted 2-h after the first FSIVGTT, was recovered even in a 72-fast FSIVGTT (Fig. 3C–D). These results reveal that shorter fasting times enhanced first-phase GSIS similar to our human study, and that extended fasting more strongly inhibited first-phase GSIS. Furthermore, first-phase GSIS was regulated by prior glucose exposure, regardless of intravenous or oral administration.
Fig. 3.

Fasting decreases first-phase GSIS in non-diabetic rats.
(A–D) Blood glucose concentrations (A), Kg (B), insulin levels (C), and insulin AUC0–6 min (D) during the dual FSIVGTT in rats fasted for 24 h (n = 5), 48 h (n = 7), and 72 h (n = 7). (E and F) Blood glucose (E) and plasma insulin (F) levels in blood obtained from the tail and portal veins during the FSIVGTT. (G) Insulin AUC0–6 min in the tail and portal veins during the FSIVGTT (n = 5 each). (H–K) Blood glucose concentrations (H), glucose concentrations at 2 h post-glucose injection (I), insulin levels (J), and Δinsulin15 min/Δglucose15 min (K) in healthy rats that had been fasted for 24 or 72 h (n = 4 each). Statistical significance was calculated using the Wilcoxon-Mann-Whitney test or the Kruskal Wallis test followed by Bonferroni's post-hoc test for comparisons between two groups or among multiple groups, respectively. P < 0.05 indicates statistical significance. N.S. indicates no statistical significance. Graphs display mean ± SEM. GSIS, glucose-stimulated insulin secretion; Kg, glucose disappearance rate; AUC, area under the curve; FSIVGTT, frequently sampled intravenous glucose tolerance test.
Fasting-induced reductions in Kg and first-phase GSIS were observed in blood samples from both the tail and portal veins of rats (Fig. 3E–G), indicating that hepatic insulin degradation was not involved in the fasting-induced suppression of first-phase GSIS. Furthermore, the fasting-induced decreases in Kg and early-phase insulin secretion were confirmed using OGTTs (Fig. 3H–K), suggesting that the fasting-dependent decrease in first-phase GSIS occurred regardless of whether glucose was administered intravenously or orally.
3.5. Role of the Brain-SNS-β Cell Neural Axis in First-Phase GSIS in Non-Diabetic Rats
Because the hypothalamus-SNS axis plays a fundamental role in whole-body glucose homeostasis during fasting (Myers and Olson, 2012, Kurose et al., 1990), we next examined the role of the SNS in regulating first-phase GSIS. Continuous infusion of the catecholamines epinephrine and norepinephrine significantly reduced first-phase, but increased second-phase, GSIS—even when FSIVGTTs were performed after a 24-h fast (Fig. S3A–D). Infusion of the α-blocker phentolamine or the β-blocker propranolol did not affect Kg during FSIVGTTs after a 72-h fast, whereas co-infusion of both blockers significantly increased Kg (Fig. S3E and F). First-phase GSIS was significantly potentiated by phentolamine—even after a 72-h fast—but reduced slightly by propranolol (Fig. S3G and H). Furthermore, PNx significantly increased first-phase GSIS and Kg, even during an FSIVGTT after a 72-h fast (Fig. 4A–D). Therefore, α-adrenergic SNS signaling is involved in the mechanism underlying fasting-induced inhibition of first-phase GSIS.
Fig. 4.

Hypothalamic AMPK-SNS axis control of first-phase GSIS during fasting.
(A–D) Blood glucose levels (A), Kg (B), plasma insulin levels (C), and insulin AUC0–6 min (D) during the FSIVGTT in rats fasted for 72 h with or without PNx (n = 5 each). (E–H) Blood glucose levels (E), Kg (F), plasma insulin levels (G), and insulin AUC0–6 min (H) during the FSIVGTT in rats fasted for 72 h and pre-injected ICV with control aCSF containing urea (n = 7), glucose (n = 6), insulin (n = 5), or glucose and AICAR (n = 6). (I–L) Blood glucose levels (I), Kg (J), plasma insulin levels (K), and insulin AUC0–6 min (L) during FSIVGTTs in rats fasted for 24 h and pre-injected ICV with control aCSF (n = 10), 2-DG (n = 5), LY294002 (n = 5), or AICAR (n = 8). (M) Immunofluorescent labeling of phosphorylated AMPK in the hypothalamus. Scale bar, 200 μm. (N) Representative Western blots of pACC, ACC, pAMPK and AMPK in the hypothalamus of indicated rat groups. β-actin was used as a control. (O) Quantitative results of the pAMPK/AMPK ratio. (P) Quantitative results of the pACC/ACC ratio. Statistical significance was calculated using a Wilcoxon-Mann-Whitney test or a Kruskal Wallis test followed by Bonferroni's post-hoc test for comparisons between two groups or among multiple groups, respectively. P < 0.05 indicates statistical significance. N.S. indicates no statistical significance. Graphs display mean ± SEM. ACC, acetyl CoA carboxylase; AMPK, AMP-activated protein kinase; SNS, sympathetic nervous system; GSIS, glucose-stimulated insulin secretion; Kg, glucose disappearance rate; AUC, area under the curve; FSIVGTT, intravenous glucose tolerance test; PNx, pancreatic denervation; aCSF, artificial cerebrospinal fluid; ICV, intracerebroventricular; AICAR, 5-aminoimidazole-4-carboxamide-1-β-d-ribofuranoside; 2-DG. 2-deoxy-d-glucose.
3.6. Role of Hypothalamic AMPK in First-Phase GSIS in Non-Diabetic Rats
The liver senses peripheral glucose metabolism and communicates this information to the brain via the hepatic vagal nerve (Uno et al., 2006). Additionally, the hypothalamus directly senses a quick change in nutrient conditions via the insulin signaling or glucose-sensing pathways (Minokoshi et al., 2004). We found that hepatic vagotomy had no effect on first-phase GSIS, although it increased Kg, during FSIVGTTs following a 72-h fast (Fig. S3I–L). In contrast, ICV injections of glucose, but not insulin, significantly increased both Kg and first-phase GSIS during FSIVGTTs following a 72-h fast (Fig. 4E–H). ICV injections of 2-DG, a nonmetabolizable glucose analog, but not LY294002, a phosphatidylinositol 3-kinase inhibitor, significantly decreased Kg and first-phase GSIS, even in FSIVGTTs following a 24-h fast (Fig. 4I–L). These results suggest that the glucose-sensing pathways in the brain are essential for regulating first-phase GSIS.
AMPK is an intracellular effector that signals in response to glucose utilization, glycogen content, and leptin (Kahn et al., 2005, Long and Zierath, 2006). Hypothalamic AMPK regulates glucose and energy metabolism (Long and Zierath, 2006, Minokoshi et al., 2004, Lopez et al., 2010, Xue and Kahn, 2006, Mccrimmon et al., 2008). Particularly, AMPK in the VMH is involved in the physiological responses to fasting, such as gluconeogenesis and inhibition of glucose utilization in peripheral tissues(Lopez et al., 2010, Mccrimmon et al., 2008). We confirmed that phosphorylation of AMPK and ACC, a direct substrate of AMPK, in the VMH significantly increased depending on fasting duration but was abolished by ICV glucose infusions (Fig. 4M–P). In contrast, ICV 2-DG infusions activated AMPK, even following a 24-h fast (Fig. 4M–P). ICV injections of AICAR, an AMPK activator, significantly reduced Kg and first-phase GSIS, even during an FSIVGTT following a 24-h fast (Fig. 4I–L). Moreover, ICV AICAR injections reduced the effects of ICV glucose injection on Kg and GSIS during an FSIVGTT following a 72-h fast (Fig. 4E–H). Taken together, these findings indicate that the activation of hypothalamic AMPK, which senses brain glucose depletion, inhibits first-phase GSIS.
3.7. Role of the Brain-β Cell Neural Axis in the Impairment of First-Phase GSIS in Diabetic Rats
We investigated the relationship between fasting- and diabetes-induced suppression of first-phase GSIS. When compared with non-obese control LETO rats, OLETF rats displayed a normal Kg during an FSIVGTT following a 24-h fast until 24 weeks of age. However, Kg was significantly reduced in OLETF rats at 32 weeks of age (Fig. 5A and B). First-phase GSIS was significantly increased in 16-week-old OLETF rats. In contrast, first-phase GSIS was lower, while second-phase GSIS was higher, in 32-week-old OLETF rats (Fig. 5C and D). A similar pattern of insulin secretion was observed in non-diabetic rats following a 72-h fast (Fig. 3C and D). The pancreatic β cell areas of OLETF rats were significantly larger than those of age-matched control LETO rats, regardless of age (Fig. 5E and F), although the pancreas appeared to be of equivalent weight among the groups of rats. These results suggested that diabetes-related inhibition of first-phase GSIS in 32-week-old OLETF rats was not mediated by insufficient β-cell insulin production.
Fig. 5.

Hypothalamic AMPK-SNS axis impairment of first-phase GSIS in diabetic OLETF rats.
(A–D) Blood glucose levels (A), Kg (B), plasma insulin levels (C), and insulin AUC0–6 min (D) during FSIVGTTs in 16-, 24- and 32-week-old LETO (n = 5, 4, and 5 per group, respectively) and OLETF (n = 4, 4, and 6 per group, respectively) rats after a 24 h fast. (E) Immunofluorescent staining of insulin and glucagon in pancreatic islets. Scale bar, 100 μm. (F) The proportion of the β cell area in the total pancreatic area. (G–J) Blood glucose levels (G), Kg (H), plasma insulin levels (I), and insulin AUC0–6 min (J) during FSIVGTTs in 32-week-old OLETF rats treated with (n = 5) or without (n = 7) PNx and fasted for 24 h. (K) Immunofluorescent labeling of phosphorylated AMPKThr172 in the hypothalamus. Scale bar, 200 μm. (L) Representative Western blots of pACC, ACC, pAMPK and AMPK in the hypothalamus of indicated rat groups. β-actin was used as a control. (M) Quantitative results of the pAMPK/AMPK ratio. (N) Quantitative results of the pACC/ACC ratio. (O–R) Blood glucose levels (O), Kg (P), plasma insulin levels (Q), and insulin AUC0–6 min (R) during FSIVGTTs in rats pre-injected ICV with control aCSF containing urea (n = 5) or compound C (n = 6). Statistical significance was calculated using a Wilcoxon-Mann-Whitney test or a Kruskal Wallis test followed by Bonferroni's post-hoc test for comparisons between two groups or among multiple groups, respectively. P < 0.05 indicates statistical significance. N.S. indicates no statistical significance. Graphs display mean ± SEM. ACC, acetyl CoA carboxylase; AMPK, AMP-activated protein kinase; SNS, sympathetic nervous system; GSIS, glucose-stimulated insulin secretion; Kg, glucose disappearance rate; AUC, area under the curve; FSIVGTT, frequently sampled intravenous glucose tolerance test; PNx, pancreatic denervation; aCSF, artificial cerebrospinal fluid; ICV intra-third cerebroventricular.
Systemic co-infusion of α- and β-blockers (Fig. S3E–H) or PNx (Fig. 5G–J) reversed the diabetes-induced reductions in first-phase GSIS and Kg in 32-week-old OLETF rats during an FSIVGTT following a 24-h fast. We demonstrated that phosphorylation of AMPK and ACC significantly increased in hypothalamus of these 32-week-old OLETF rats (Fig. 5K–N), even though they were not subjected to a 72-h fast. Furthermore, this activation was abolished by ICV injection of the AMPK inhibitor compound C (Fig. 5K–N), which also ameliorated first-phase GSIS (Fig. 5O–R). Collectively, these results indicate that the brain-β cell neural axis is also involved in the diabetes-related decrease in first-phase GSIS.
3.8. Therapeutic Potency of Pancreatic Denervation against Type 2 Diabetes
Among the strategies that restore first-phase GSIS in OLETF rats, only PNx plays a direct role in β cell dysfunction without affecting glucose metabolism in other peripheral tissues. Thus, 8-week-old OLETF rats were subjected to PNx, and followed until 32 week-old to assess the significance of restored first-phase GSIS on diabetes onset (Fig. 6A). A comparison of sham- and PNx-treated OLETF rats revealed no differences in dietary intake, body weight gain, or fasting fatty acid, triglyceride, and total cholesterol levels (Table S3). Furthermore, PNx did not affect insulin resistance in OLETF rats following an IPITT (Fig. 6B). However, PNx in OLETF rats significantly improved glucose tolerance, accompanied by an amelioration of early-phase insulin secretion during an OGTT (Fig. 6C–F). The pancreas appeared to be similar weight among three groups of rats. Furthermore, PNx did not affect enlargement of β cell areas in the pancreas or lipid accumulation in the liver and white adipose tissues in OLETF rats (Fig. 6G–I). Thus, PNx played a preventive role in the onset of glucose intolerance in OLETF rats, without affecting diabetes-related morphological changes in various tissues.
Fig. 6.

Preventive role of pancreatic denervation in the development of type 2 diabetes in OLETF rats.
(A) Eight-week-old OLETF rats underwent PNx or sham surgery and were monitored until 32 weeks of age. (B) Percent change in glucose levels during the IPITT in non-diabetic LETO (n = 5) and OLETF rats with (n = 6) or without (n = 7) PNx. (C and D) Blood glucose levels during the OGTT (C) and glucose concentrations at 2 h post-glucose injection during the OGTT (D). (E and F) Plasma insulin levels during the OGTT (E) and the Δinsulin15 min/Δglucose15 min during the OGTT (F). (G) Immunofluorescent staining of insulin and glucagon in pancreatic islets. Scale bar, 100 μm. (H) The proportion of the β cell area in the total pancreatic area. (I) Hematoxylin-eosin-stained sections of the liver and white adipose tissue. Scale bar, 100 μm. (J) Coomassie brilliant blue (CBB)-stained albumin bands in urine samples and control bovine serum albumin (BSA) at the indicated concentrations. (K) Periodic acid-Schiff (PAS)-stained kidney sections. Scale bar, 100 μm. (L) Scanning electron microscopy (EM) showing podocytes. Magnification × 8000 and × 30,000. Statistical significance was calculated using a Wilcoxon-Mann-Whitney test or Kruskal Wallis test followed by Bonferroni's post-hoc test for comparisons between two groups or among multiple groups, respectively. P < 0.05 indicates statistical significance. N.S. indicates no statistical significance. Graphs display mean ± SEM. IPITT, intraperitoneal insulin tolerance test; PNx, pancreatic denervation; OGTT, oral glucose tolerance test.
Increased urinary protein excretion levels, glomerular sclerotic lesions, and severe alterations of podocyte foot processes, all of which are relevant to diabetic nephropathy, were observed in the kidneys of 32-week-old sham-treated OLETF rats and prevented by PNx (Fig. 6J–L). These renoprotective effects of PNx provide evidence that PNx chronically improved glycemic control in OLETF rats.
We also assessed the therapeutic effectiveness of PNx on type 2 diabetes (Fig. 7A). PNx significantly improved glucose tolerance and increased the early insulin secretory response following an OGTT in 32-week-old OLETF rats (Fig. 7B–E). As OLETF rats develop age-dependent severe hyperglycemia accompanied by β cell loss (Kawano et al., 1992), we assessed the effects of PNx on the age-dependent progression of severe hyperglycemia defined as a blood glucose level ≥ 400 mg/dL until 76-week old (Fig. 7A). Six of the 10 sham-treated OLETF rats developed severe hyperglycemia, whereas significantly fewer PNx-OLETF rats exhibited this progression (Fig. 7F). Moreover, fewer TUNEL-positive cells were present in the islets of 76-week-old PNx rats compared with those of 76-week-old sham-treated OLETF rats (Fig. 7G and H).
Fig. 7.

Therapeutic role of pancreatic denervation in the development of type 2 diabetes in OLETF rats.
(A) OLETF rats underwent PNx or sham surgery (n = 10 each) at 32 weeks of age, were analyzed at 36 weeks of age, and were monitored until 76 weeks of age. (B–C) Blood glucose levels (B), glucose concentrations at 2 h post-glucose injection (C), plasma insulin levels (D), and Δinsulin15 min/Δglucose15 min during an OGTT (E). (F) Kaplan-Meier analysis of severe hyperglycemia incidence. (G) Immunofluorescent staining of insulin and TUNEL in islets from 76-week-old OLETF rats with or without PNx. Scale bar, 100 μm. (H) Quantitative analysis of TUNEL staining. Apoptotic index = 100 × (number of TUNEL-positive cells / number of insulin-positive cells). (I) PNx was conducted in OLETF rats that had developed severe hyperglycemia (n = 3). OGTTs were performed before and after PNx surgery. (J and K) Blood glucose (J) and insulin levels (K) during the OGTT. Statistical significance was calculated using a Wilcoxon-Mann-Whitney test. Survival parameters were determined using the Kaplan-Meier method and compared using log-rank tests. P < 0.05 indicates statistical significance. N.S. indicates no statistical significance. Graphs display mean ± SEM. PNx, pancreatic denervation; OGTT, oral glucose tolerance test.
However, PNx failed to reverse the diminished first-phase GSIS observed in 76-week-old OLETF rats that had developed severe hyperglycemia (Fig. 7I–K). Collectively, these results indicate that PNx can delay the onset of glucose intolerance, improve glycemic control in the early stages of diabetes and prevent the loss of β cell mass during the progression of severe diabetes. However, PNx is unable to restore insulin secretion once the β cell mass is mostly depleted, as in end-stage diabetes.
4. Discussion
The present study demonstrated a physiological role of first-phase GSIS. Our study revealed that biphasic GSIS regulated the distribution of adequate amounts of glucose to tissues at re-feeding, and the rate of distribution depended on the duration of the previous fasting period. First-phase GSIS is decreased after long-term fasting but is fully induced in the unfasted state (Fig. 8). This system results in the brain being supplied with glucose as soon as possible after a fast, while also facilitating effective storage of surplus energy in insulin-sensitive tissues to prepare for upcoming fasting periods (Fig. 8). Although blood glucose levels are strictly regulated within a narrow range, postprandial blood glucose levels may require additional fine-tuning by first-phase GSIS to supply an adequate amount of dietary glucose to the brain in response to the most-recent fasting period.
Fig. 8.

Proposed regulatory mechanism of first-phase GSIS at re-feeding after long-term fasting and during frequent feeding.
First-phase GSIS is decreased after long-term fasting but is fully induced in the unfasted state. This system results in the brain being supplied with glucose as soon as possible after a fast while also facilitating effective storage of surplus energy in insulin-sensitive tissues to prepare for upcoming fasting periods. The hypothalamic AMPK-SNS-β cell neural axis is involved in this regulatory system. AMPK, AMP-activated protein kinase.
A long fasting period of 72 h dramatically inhibited first-phase GSIS in our animal study, suggesting that the fasting-dependent decrease in first-phase GSIS might be more important for mammals living in times of scarcity than for humans living in our current time of relative plenty. Insulin halts most catabolic processes, including glycogenolysis, gluconeogenesis, and ketogenesis—all of which are essential for maintaining an energy supply to the brain during a prolonged fast, such as starvation. Therefore, if first-phase GSIS is not suppressed at re-feeding after starvation, insulin action on peripheral tissues may cause an inadequate reduction in postprandial blood glucose levels by inhibiting catabolic processes and enhancing glucose utilization by peripheral tissues. This may result in the brain being supplied with insufficient energy. Therefore, first-phase GSIS may have to be suppressed after starvation. A deficit in first-phase GSIS may therefore be a common insulin secretion pattern during scarce times, whereas increased first-phase GSIS is recognized as a normal pattern during times of plenty.
The mechanism by which first-phase GSIS is reduced after fasting is related to the mechanism underlying diabetes-associated first-phase GSIS impairment. Although the impaired first-phase GSIS observed in diabetes has long been thought to be a loss-of-function of insulin secretion (Weyer et al., 1999), a gain-of-function of fasting-induced suppression of first-phase GSIS may actually be responsible. The activation of the brain-SNS-β cell neural axis is a final common pathway that inhibits first-phase GSIS, regardless of blood glucose levels. During fasting, the axis is physiologically activated to maintain postprandial glucose levels. Under diabetic conditions, the neural axis is pathologically activated, leading to inhibition of first-phase GSIS, because hypothalamic AMPK is abnormally activated despite the existence of hyperglycemia. These findings suggest that β cells during early type 2 diabetes may mistakenly perceive the diabetic condition as prolonged fasting because of abnormal excitability of the brain-SNS-β cell neural axis.
Hypothalamic AMPK is both a central regulator of glucose homeostasis during fasting and a pathogenic factor that promotes insulin resistance (Kahn et al., 2005, Lopez et al., 2010, Minokoshi et al., 2004, Park et al., 2014, Kim et al., 2004, Mccrimmon et al., 2008). Hypothalamic AMPK activation increases appetite, promotes gluconeogenic hormone secretion, stimulates hepatic gluconeogenesis, and suppresses peripheral glucose utilization (Fig. S5). In addition to these properties, we have demonstrated that crosstalk between hypothalamic AMPK and β cells regulated first-phase GSIS. This finding provides additional evidence of the involvement of hypothalamic AMPK in both glucose homeostasis during fasting and the pathogenesis of type 2 diabetes. During fasting, AMPK specifically in the VMH is essential for glucagon- and epinephrine-stimulated gluconeogenesis in response to acute hypoglycemia. Furthermore, it is a negative regulator of glucose uptake and thermogenesis in brown adipose tissue (Mccrimmon et al., 2008, Lopez et al., 2010). Thus, we analyzed AMPK activity in the VMH. However, AMPK in other hypothalamic nuclei might also be involved in the fasting-dependent decrease in first-phase GSIS.
Although α-adrenergic stimulation inhibits insulin secretion from β cells (Kurose et al., 1990, Skoglund et al., 1988), the physiological significance of this is unknown. Our results indicate that α-adrenergic pancreatic nerves may specifically regulate first-phase rather than second-phase GSIS. Interestingly, first-phase GSIS in rats was increased by α-blocker administration and decreased by β-blocker treatment. However, neither α- nor β-blocker treatment altered Kg in the FSIVGTT studies. In contrast, simultaneous treatment with both blockers increased Kg and enhanced first-phase GSIS, even in fasted rats. These results suggest that insulin resistance, alongside a deficit in first-phase GSIS, is also involved in the fasting-induced Kg decrease. Thus, the α- and β-adrenergic nerve systems may play opposite roles in insulin secretion and resistance during the re-feeding period to maintain postprandial glucose levels. Impairment of one system alone does not induce postprandial hypoglycemia after starvation, because the other can compensate. This may be the reason why whole body glucose metabolism is regulated by two different sympathetic nerve systems.
The sympathetic regulation of GSIS should be revisited as a therapeutic target for type 2 diabetes (Porte, 1969). Consistently, we observed that a PNx-induced increase in first-phase GSIS improved glycemic control in diabetic rats. More importantly, this surgical approach prevented β cell loss and severe hyperglycemia during late stage diabetes. The effects of PNx might result from reduced glucose toxicity (Rossetti et al., 1990). Furthermore, PNx might affect β cell death directly by modulating intracellular metabolism or by inhibiting islet inflammation via sympathetic immune modulation (Pereira and Leite, 2016). Although the mechanism remains unclear, our results suggest a concept for future diabetic therapy and indicate the need for further study of the mechanisms that control both the quality and quantity of insulin secretion. Determination of these mechanisms may reveal targets for additional approaches to diabetes treatment. Additionally, currently approved surgical interventions in internal medicine include bariatric surgery for obesity (Buchwald et al., 2004, Mingrone et al., 2012) and renal denervation for hypertension (Esler et al., 2010). Furthermore, early interventions in diabetes can improve β cell survival and patient prognosis (Weng et al., 2008, Holman et al., 2008). Therefore, PNx may represent an effective surgical approach for patients with newly diagnosed type 2 diabetes.
Our observations from human FSIVGTT studies that employed different fasting periods may explain some outstanding clinical questions, such as the mechanism underlying the second-meal effect. Furthermore, the poor correlation between the AIR during an FSIVGTT and insulin concentrations determined by HG clamp or HOMA-β methods has been considered problematic in determining the ability of the FSIVGTT to estimate an individual's insulin secretory capacity (Hermans et al., 1999). Our results suggest that the fasting-induced reduction in the AIR may affect the determination of insulin secretory capacity using FSIVGTTs. Our present findings from human FSIVGTT data indicate that short-term fasting may resolve the technical problems associated with conventional FSIVGTTs.
The principal aim of this study was to identify a β cell-specific change in response to fasting that affected first-phase GSIS. Thus, we performed IVGTTs rather than OGTTs to exclude incretin or decretin effects. Resultantly, we identified that the adrenergic pancreatic nerve was involved in the fasting- and diabetes-dependent decrease in first-phase GSIS, and demonstrated therapeutic potency of the brain-insular axis, in addition to the enteroinsular axis including incretin and decretin (Drucker and Nauck, 2006, Alfa et al., 2015). However, in vivo, the two axes should coordinately regulate first-phase GSIS in response to a prior fasting period. Thus, revealing an interaction between the two axes may be an important subsequent research topic.
Our study highlighted several questions that remain unresolved. First, whether the mechanism by which hypothalamic AMPK is activated in diabetic rats is the same as that in fasting is unknown. Although our findings are consistent with previous studies (De Andrade et al., 2015, Kim et al., 2004, Namkoong et al., 2005), no reports have adequately addressed this question. Since hypothalamic AMPK is negatively regulated by leptin signaling, ATP, and glycogen (Long and Zierath, 2006, Kahn et al., 2005, Polekhina et al., 2003, Mcbride et al., 2009, Halaas et al., 1997), either diabetes-related leptin resistance or local decreases in glucose utilization and glycogen content in the hypothalamus might activate hypothalamic AMPK during diabetes. Second, the links between the brain-β cell neural axis and mechanisms previously reported to regulate first-phase GSIS, such as the glucose-fatty acid cycle (Zhou et al., 1996), insulin-dependent insulin secretion (Kulkarni et al., 1999, Bouche et al., 2010), and the insulin granule dynamic theory (Seino et al., 2011), remain unclear. Third, the relationship between the genetic variance of the α-adrenergic receptor type 2, which is strongly associated with diabetes risk (Dupuis et al., 2010, Tang et al., 2014), and fasting-induced inhibition of first-phase GSIS is also interesting. A human study demonstrated a fasting-dependent decrease in first-phase GSIS during an FSIVGTT regardless of gender. We thus examined the effects of long-term fasting and diabetes on first-phase GSIS in male rats only. Furthermore, metabolism is altered during long-term fasting. Therefore, it is possible that gender differences and metabolic changes, in addition to activated sympathetic nerves, may be associated with longer fasting-dependent and diabetes-related decreases in first-phase GSIS. Future studies to clarify these issues will provide a better understanding of type 2 diabetes pathogenesis.
Another limitation of this study relates to how metabolic change in response to fasting differs among species. For example, in a recent report, lipidomic analysis of human and animal plasma showed that lipid metabolism differed markedly between humans and rats during fasting (Ishikawa et al., 2015). In our study, we examined the regulatory mechanism of first-phase GSIS only in rats, and did not confirm our findings in humans. Species-dependent variation in whole-body energy metabolism during fasting may influence the regulatory mechanism of first-phase GSIS differently in humans and rodents, although both showed a significant decrease in first-phase GSIS after fasting.
Our results demonstrated that the physiological role of biphasic GSIS is to overcome fasting, and that the fasting-induced decrease in first-phase GSIS is linked to the pathogenesis of β cell dysfunction in type 2 diabetes. Modulating this pathogenic alteration with surgical pancreatic denervation may be a promising therapy for type 2 diabetes. Furthermore, this study suggests that the detailed physiology of glucose-insulin metabolism at the moment of re-feeding after fasting, as well as during fasting alone, may increase knowledge of type 2 diabetes pathogenesis and lead to potential therapies for the disease.
The following are the supplementary data related to this article.
Supplementary material
Movies showing whole-body 18F-FDG-PET-CT images.
(A–C) Whole-body 18F-FDG-PET-CT images from three independent healthy human subjects at 120 min after the injection of glucose and 18F-FDG under 12-h or 3-h fasting conditions. Left and right movies in each movie file were obtained from the studies after 12-h and 3-h, respectively.
Funding Sources
This work was supported by the SUMS President's Grant for the Encouragement of Young Researchers (to S.K.). The funder had no role in any process of this work, including study design, data collection, data analysis, interpretation, and writing of the manuscript.
Conflicts of Interest
The authors have declared that no conflict of interest exists.
Author Contributions
S.K. and M.K. designed and performed the experiments. S.M. and A.S. performed the single nucleotide polymorphism genotyping. T.Y., Y.F., and M.H. performed the experiments. S.-i.A., H.A., M.C.-K., S.U., S.K., and K.M. provided technical support for the animal experiments and human study. Y.N., A.K., D.K., T.U., and H.M critiqued and improved the study design. K.K. performed the statistical analysis. S.K., M.K., and A.K. wrote and edited the manuscript with input from the other authors. All authors discussed the results and conclusions.
Acknowledgments
We thank Ms. Y. Omura at the Shiga University of Medical Science, the Department of Radiology at Kusatsu General Hospital, and the Central Research Laboratory of Shiga University of Medical Science for their assistance. We also thank Hirotaka Watada (Juntendo University Graduate School of Medicine, Tokyo, Japan) for his valuable discussions.
Contributor Information
Shinji Kume, Email: skume@belle.shiga-med.ac.jp.
Hiroshi Maegawa, Email: maegawa@belle.shiga-med.ac.jp.
References
- Alfa R.W., Park S., Skelly K.R., Poffenberger G., Jain N., Gu X., Kockel L., Wang J., Liu Y., Powers A.C., Kim S.K. Suppression of insulin production and secretion by a decretin hormone. Cell Metab. 2015;21:323–333. doi: 10.1016/j.cmet.2015.01.006. [DOI] [PMC free article] [PubMed] [Google Scholar]
- Basu A., Alzaid A., Dinneen S., Caumo A., Cobelli C., Rizza R.A. Effects of a change in the pattern of insulin delivery on carbohydrate tolerance in diabetic and nondiabetic humans in the presence of differing degrees of insulin resistance. J. Clin. Invest. 1996;97:2351–2361. doi: 10.1172/JCI118678. [DOI] [PMC free article] [PubMed] [Google Scholar]
- Boston R.C., Stefanovski D., Moate P.J., Sumner A.E., Watanabe R.M., Bergman R.N. MINMOD millennium: a computer program to calculate glucose effectiveness and insulin sensitivity from the frequently sampled intravenous glucose tolerance test. Diabetes Technol. Ther. 2003;5:1003–1015. doi: 10.1089/152091503322641060. [DOI] [PubMed] [Google Scholar]
- Bouche C., Lopez X., Fleischman A., Cypess A.M., O'shea S., Stefanovski D., Bergman R.N., Rogatsky E., Stein D.T., Kahn C.R., Kulkarni R.N., Goldfine A.B. Insulin enhances glucose-stimulated insulin secretion in healthy humans. Proc. Natl. Acad. Sci. U. S. A. 2010;107:4770–4775. doi: 10.1073/pnas.1000002107. [DOI] [PMC free article] [PubMed] [Google Scholar]
- Buchwald H., Avidor Y., Braunwald E., Jensen M.D., Pories W., Fahrbach K., Schoelles K. Bariatric surgery: a systematic review and meta-analysis. JAMA. 2004;292:1724–1737. doi: 10.1001/jama.292.14.1724. [DOI] [PubMed] [Google Scholar]
- Buijs R.M., Chun S.J., Niijima A., Romijn H.J., Nagai K. Parasympathetic and sympathetic control of the pancreas: a role for the suprachiasmatic nucleus and other hypothalamic centers that are involved in the regulation of food intake. J. Comp. Neurol. 2001;431:405–423. doi: 10.1002/1096-9861(20010319)431:4<405::aid-cne1079>3.0.co;2-d. [DOI] [PubMed] [Google Scholar]
- Cahill G.F., JR. The Banting Memorial Lecture 1971. Physiology of insulin in man. Diabetes. 1971;20:785–799. doi: 10.2337/diab.20.12.785. [DOI] [PubMed] [Google Scholar]
- Calles-Escandon J., Robbins D.C. Loss of early phase of insulin release in humans impairs glucose tolerance and blunts thermic effect of glucose. Diabetes. 1987;36:1167–1172. doi: 10.2337/diab.36.10.1167. [DOI] [PubMed] [Google Scholar]
- Caumo A., Luzi L. First-phase insulin secretion: does it exist in real life? Considerations on shape and function. Am. J. Physiol. Endocrinol. Metab. 2004;287:E371–E385. doi: 10.1152/ajpendo.00139.2003. [DOI] [PubMed] [Google Scholar]
- Curry D.L., Bennett L.L., Grodsky G.M. Dynamics of insulin secretion by the perfused rat pancreas. Endocrinology. 1968;83:572–584. doi: 10.1210/endo-83-3-572. [DOI] [PubMed] [Google Scholar]
- De Andrade I.S., Zemdegs J.C., De Souza A.P., Watanabe R.L., Telles M.M., Nascimento C.M., Oyama L.M., Ribeiro E.B. Diet-induced obesity impairs hypothalamic glucose sensing but not glucose hypothalamic extracellular levels, as measured by microdialysis. Nutr. Diabetes. 2015;5 doi: 10.1038/nutd.2015.12. [DOI] [PMC free article] [PubMed] [Google Scholar]
- Defronzo R.A., Tobin J.D., Andres R. Glucose clamp technique: a method for quantifying insulin secretion and resistance. Am. J. Phys. 1979;237:E214–E223. doi: 10.1152/ajpendo.1979.237.3.E214. [DOI] [PubMed] [Google Scholar]
- Drucker D.J., Nauck M.A. The incretin system: glucagon-like peptide-1 receptor agonists and dipeptidyl peptidase-4 inhibitors in type 2 diabetes. Lancet. 2006;368:1696–1705. doi: 10.1016/S0140-6736(06)69705-5. [DOI] [PubMed] [Google Scholar]
- Dupuis J., Langenberg C., Prokopenko I., Saxena R., Soranzo N., Jackson A.U., Wheeler E., Glazer N.L., Bouatia-NAJI N., Gloyn A.L., Lindgren C.M., Magi R., Morris A.P., Randall J., Johnson T., Elliott P., Rybin D., Thorleifsson G., Steinthorsdottir V., Henneman P., Grallert H., Dehghan A., Hottenga J.J., Franklin C.S., Navarro P., Song K., Goel A., Perry J.R., Egan J.M., Lajunen T., Grarup N., Sparso T., Doney A., Voight B.F., Stringham H.M., Li M., Kanoni S., Shrader P., Cavalcanti-Proenca C., Kumari M., Qi L., Timpson N.J., Gieger C., Zabena C., Rocheleau G., Ingelsson E., An P., O'connell J., Luan J., Elliott A., Mccarroll S.A., Payne F., Roccasecca R.M., Pattou F., Sethupathy P., Ardlie K., Ariyurek Y., Balkau B., Barter P., Beilby J.P., Ben-Shlomo Y., Benediktsson R., Bennett A.J., Bergmann S., Bochud M., Boerwinkle E., Bonnefond A., Bonnycastle L.L., Borch-Johnsen K., Bottcher Y., Brunner E., Bumpstead S.J., Charpentier G., Chen Y.D., Chines P., CLARKE R., Coin L.J., Cooper M.N., Cornelis M., Crawford G., Crisponi L., Day I.N., De Geus E.J., Delplanque J., Dina C., Erdos M.R., Fedson A.C., Fischer-Rosinsky A., Forouhi N.G., Fox C.S., Frants R., Franzosi M.G., Galan P., Goodarzi M.O., Graessler J., Groves C.J., Grundy S., Gwilliam R., Gyllensten U., Hadjadj S. New genetic loci implicated in fasting glucose homeostasis and their impact on type 2 diabetes risk. Nat. Genet. 2010;42:105–116. doi: 10.1038/ng.520. [DOI] [PMC free article] [PubMed] [Google Scholar]
- Esler M.D., Krum H., Sobotka P.A., Schlaich M.P., Schmieder R.E., Bohm M. Renal sympathetic denervation in patients with treatment-resistant hypertension (the Symplicity HTN-2 trial): a randomised controlled trial. Lancet. 2010;376:1903–1909. doi: 10.1016/S0140-6736(10)62039-9. [DOI] [PubMed] [Google Scholar]
- Fink G., Gutman R.A., Cresto J.C., Selawry H., Lavine R., Recant L. Glucose-induced insulin release patterns: effect of starvation. Diabetologia. 1974;10:421–425. doi: 10.1007/BF01221632. [DOI] [PubMed] [Google Scholar]
- Grey N.J., Goldring S., Kipnis D.M. The effect of fasting, diet, and actinomycin D on insulin secretion in the rat. J. Clin. Invest. 1970;49:881–889. doi: 10.1172/JCI106307. [DOI] [PMC free article] [PubMed] [Google Scholar]
- Halaas J.L., Boozer C., Blair-West J., Fidahusein N., Denton D.A., Friedman J.M. Physiological response to long-term peripheral and central leptin infusion in lean and obese mice. Proc. Natl. Acad. Sci. U. S. A. 1997;94:8878–8883. doi: 10.1073/pnas.94.16.8878. [DOI] [PMC free article] [PubMed] [Google Scholar]
- Han M.S., Chung K.W., Cheon H.G., Rhee S.D., Yoon C.H., Lee M.K., Kim K.W., Lee M.S. Imatinib mesylate reduces endoplasmic reticulum stress and induces remission of diabetes in db/db mice. Diabetes. 2009;58:329–336. doi: 10.2337/db08-0080. [DOI] [PMC free article] [PubMed] [Google Scholar]
- Hermans M.P., Levy J.C., Morris R.J., Turner R.C. Comparison of tests of beta-cell function across a range of glucose tolerance from normal to diabetes. Diabetes. 1999;48:1779–1786. doi: 10.2337/diabetes.48.9.1779. [DOI] [PubMed] [Google Scholar]
- Holman R.R., Paul S.K., Bethel M.A., Matthews D.R., Neil H.A. 10-year follow-up of intensive glucose control in type 2 diabetes. N. Engl. J. Med. 2008;359:1577–1589. doi: 10.1056/NEJMoa0806470. [DOI] [PubMed] [Google Scholar]
- Ishikawa M., Saito K., Urata M., Kumagai Y., Maekawa K., Saito Y. Comparison of circulating lipid profiles between fasting humans and three animal species used in preclinical studies: mice, rats and rabbits. Lipids Health Dis. 2015;14:104. doi: 10.1186/s12944-015-0104-4. [DOI] [PMC free article] [PubMed] [Google Scholar]
- Kadowaki T. Insights into insulin resistance and type 2 diabetes from knockout mouse models. J. Clin. Invest. 2000;106:459–465. doi: 10.1172/JCI10830. [DOI] [PMC free article] [PubMed] [Google Scholar]
- Kahn C.R., White M.F. The insulin receptor and the molecular mechanism of insulin action. J. Clin. Invest. 1988;82:1151–1156. doi: 10.1172/JCI113711. [DOI] [PMC free article] [PubMed] [Google Scholar]
- Kahn B.B., Alquier T., Carling D., Hardie D.G. AMP-activated protein kinase: ancient energy gauge provides clues to modern understanding of metabolism. Cell Metab. 2005;1:15–25. doi: 10.1016/j.cmet.2004.12.003. [DOI] [PubMed] [Google Scholar]
- kawano K., Hirashima T., Mori S., Saitoh Y., Kurosumi M., Natori T. Spontaneous long-term hyperglycemic rat with diabetic complications. Otsuka long-Evans Tokushima fatty (OLETF) strain. Diabetes. 1992;41:1422–1428. doi: 10.2337/diab.41.11.1422. [DOI] [PubMed] [Google Scholar]
- Kim M.S., Park J.Y., Namkoong C., Jang P.G., Ryu J.W., Song H.S., Yun J.Y., Namgoong I.S., Ha J., Park I.S., Lee I.K., Viollet B., Youn J.H., Lee H.K., Lee K.U. Anti-obesity effects of alpha-lipoic acid mediated by suppression of hypothalamic AMP-activated protein kinase. Nat. Med. 2004;10:727–733. doi: 10.1038/nm1061. [DOI] [PubMed] [Google Scholar]
- Kulkarni R.N., Bruning J.C., Winnay J.N., Postic C., Magnuson M.A., Kahn C.R. Tissue-specific knockout of the insulin receptor in pancreatic beta cells creates an insulin secretory defect similar to that in type 2 diabetes. Cell. 1999;96:329–339. doi: 10.1016/s0092-8674(00)80546-2. [DOI] [PubMed] [Google Scholar]
- Kurose T., Seino Y., Nishi S., Tsuji K., Taminato T., Tsuda K., Imura H. Mechanism of sympathetic neural regulation of insulin, somatostatin, and glucagon secretion. Am. J. Phys. 1990;258:E220–E227. doi: 10.1152/ajpendo.1990.258.1.E220. [DOI] [PubMed] [Google Scholar]
- Long Y.C., Zierath J.R. AMP-activated protein kinase signaling in metabolic regulation. J. Clin. Invest. 2006;116:1776–1783. doi: 10.1172/JCI29044. [DOI] [PMC free article] [PubMed] [Google Scholar]
- Lopez M., Varela L., Vazquez M.J., Rodriguez-Cuenca S., Gonzalez C.R., Velagapudi V.R., Morgan D.A., Schoenmakers E., Agassandian K., Lage R., Martinez De Morentin P.B., Tovar S., Nogueiras R., Carling D., Lelliott C., Gallego R., Oresic M., Chatterjee K., Saha A.K., Rahmouni K., Dieguez C., Vidal-Puig A. Hypothalamic AMPK and fatty acid metabolism mediate thyroid regulation of energy balance. Nat. Med. 2010;16:1001–1008. doi: 10.1038/nm.2207. [DOI] [PMC free article] [PubMed] [Google Scholar]
- Lucignani G., Paganelli G., Bombardieri E. The use of standardized uptake values for assessing FDG uptake with PET in oncology: a clinical perspective. Nucl. Med. Commun. 2004;25:651–656. doi: 10.1097/01.mnm.0000134329.30912.49. [DOI] [PubMed] [Google Scholar]
- Mcbride A., Ghilagaber S., Nikolaev A., Hardie D.G. The glycogen-binding domain on the AMPK beta subunit allows the kinase to act as a glycogen sensor. Cell Metab. 2009;9:23–34. doi: 10.1016/j.cmet.2008.11.008. [DOI] [PMC free article] [PubMed] [Google Scholar]
- Mccrimmon R.J., Shaw M., Fan X., Cheng H., Ding Y., Vella M.C., Zhou L., Mcnay E.C., Sherwin R.S. Key role for AMP-activated protein kinase in the ventromedial hypothalamus in regulating counterregulatory hormone responses to acute hypoglycemia. Diabetes. 2008;57:444–450. doi: 10.2337/db07-0837. [DOI] [PubMed] [Google Scholar]
- Mingrone G., Panunzi S., de Gaetano A., Guidone C., Iaconelli A., Leccesi L., Nanni G., Pomp A., Castagneto M., Ghirlanda G., Rubino F. Bariatric surgery versus conventional medical therapy for type 2 diabetes. N. Engl. J. Med. 2012;366:1577–1585. doi: 10.1056/NEJMoa1200111. [DOI] [PubMed] [Google Scholar]
- Minokoshi Y., Alquier T., Furukawa N., Kim Y.B., Lee A., Xue B., Mu J., Foufelle F., Ferre P., Birnbaum M.J., Stuck B.J., Kahn B.B. AMP-kinase regulates food intake by responding to hormonal and nutrient signals in the hypothalamus. Nature. 2004;428:569–574. doi: 10.1038/nature02440. [DOI] [PubMed] [Google Scholar]
- Mitrakou A., Kelley D., Mokan M., Veneman T., Pangburn T., Reilly J., Gerich J. Role of reduced suppression of glucose production and diminished early insulin release in impaired glucose tolerance. N. Engl. J. Med. 1992;326:22–29. doi: 10.1056/NEJM199201023260104. [DOI] [PubMed] [Google Scholar]
- Myers M.G., Jr., Olson D.P. Central nervous system control of metabolism. Nature. 2012;491:357–363. doi: 10.1038/nature11705. [DOI] [PubMed] [Google Scholar]
- Namkoong C., Kim M.S., Jang P.G., Han S.M., Park H.S., Koh E.H., Lee W.J., Kim J.Y., Park I.S., Park J.Y., Lee K.U. Enhanced hypothalamic AMP-activated protein kinase activity contributes to hyperphagia in diabetic rats. Diabetes. 2005;54:63–68. doi: 10.2337/diabetes.54.1.63. [DOI] [PubMed] [Google Scholar]
- Ohnishi Y., Tanaka T., Ozaki K., Yamada R., Suzuki H., Nakamura Y. A high-throughput SNP typing system for genome-wide association studies. J. Hum. Genet. 2001;46:471–477. doi: 10.1007/s100380170047. [DOI] [PubMed] [Google Scholar]
- Pacini G., Bergman R.N. MINMOD: a computer program to calculate insulin sensitivity and pancreatic responsivity from the frequently sampled intravenous glucose tolerance test. Comput. Methods Prog. Biomed. 1986;23:113–122. doi: 10.1016/0169-2607(86)90106-9. [DOI] [PubMed] [Google Scholar]
- Park S., Kim DA S., Kang S., Shin B.K. Chronic activation of central AMPK attenuates glucose-stimulated insulin secretion and exacerbates hepatic insulin resistance in diabetic rats. Brain Res. Bull. 2014;108:18–26. doi: 10.1016/j.brainresbull.2014.08.002. [DOI] [PubMed] [Google Scholar]
- Pereira M.R., Leite P.E. The involvement of parasympathetic and sympathetic nerve in the inflammatory reflex. J. Cell. Physiol. 2016;231:1862–1869. doi: 10.1002/jcp.25307. [DOI] [PubMed] [Google Scholar]
- Pfeifer M.A., Halter J.B., Porte D., Jr. Insulin secretion in diabetes mellitus. Am. J. Med. 1981;70:579–588. doi: 10.1016/0002-9343(81)90579-9. [DOI] [PubMed] [Google Scholar]
- Polekhina G., Gupta A., Michell B.J., van Denderen B., Murthy S., Feil S.C., Jennings I.G., Campbell D.J., Witters L.A., Parker M.W., Kemp B.E., Stapleton D. AMPK beta subunit targets metabolic stress sensing to glycogen. Curr. Biol. 2003;13:867–871. doi: 10.1016/s0960-9822(03)00292-6. [DOI] [PubMed] [Google Scholar]
- Polyzogopoulou E.V., Kalfarentzos F., Vagenakis A.G., Alexandrides T.K. Restoration of euglycemia and normal acute insulin response to glucose in obese subjects with type 2 diabetes following bariatric surgery. Diabetes. 2003;52:1098–1103. doi: 10.2337/diabetes.52.5.1098. [DOI] [PubMed] [Google Scholar]
- Porte D., Jr. Sympathetic regulation of insulin secretion. Its relation to diabetes mellitus. Arch. Intern. Med. 1969;123:252–260. [PubMed] [Google Scholar]
- Porte D., Jr., Pupo A.A. Insulin responses to glucose: evidence for a two pool system in man. J. Clin. Invest. 1969;48:2309–2319. doi: 10.1172/JCI106197. [DOI] [PMC free article] [PubMed] [Google Scholar]
- Rossetti L., Giaccari A., Defronzo R.A. Glucose toxicity. Diabetes Care. 1990;13:610–630. doi: 10.2337/diacare.13.6.610. [DOI] [PubMed] [Google Scholar]
- Satoh N., Ogawa Y., Katsuura G., Tsuji T., Masuzaki H., Hiraoka J., Okazaki T., Tamaki M., Hayase M., Yoshimasa Y., Nishi S., Hosoda K., Nakao K. Pathophysiological significance of the obese gene product, leptin, in ventromedial hypothalamus (VMH)-lesioned rats: evidence for loss of its satiety effect in VMH-lesioned rats. Endocrinology. 1997;138:947–954. doi: 10.1210/endo.138.3.4989. [DOI] [PubMed] [Google Scholar]
- Seino S., Shibasaki T., Minami K. Dynamics of insulin secretion and the clinical implications for obesity and diabetes. J. Clin. Invest. 2011;121:2118–2125. doi: 10.1172/JCI45680. [DOI] [PMC free article] [PubMed] [Google Scholar]
- Skoglund G., Lundquist I., Ahren B. Selective alpha 2-adrenoceptor activation by clonidine: effects on 45Ca2 + efflux and insulin secretion from isolated rat islets. Acta Physiol. Scand. 1988;132:289–296. doi: 10.1111/j.1748-1716.1988.tb08332.x. [DOI] [PubMed] [Google Scholar]
- Tang Y., Axelsson A.S., Spegel P., Andersson L.E., Mulder H., Groop L.C., Renstrom E., Rosengren A.H. Genotype-based treatment of type 2 diabetes with an alpha2A-adrenergic receptor antagonist. Sci. Transl. Med. 2014;6 doi: 10.1126/scitranslmed.3009934. [DOI] [PubMed] [Google Scholar]
- Uno K., Katagiri H., Yamada T., Ishigaki Y., Ogihara T., Imai J., Hasegawa Y., Gao J., Kaneko K., Iwasaki H., Ishihara H., Sasano H., Inukai K., Mizuguchi H., Asano T., Shiota M., Nakazato M., Oka Y. Neuronal pathway from the liver modulates energy expenditure and systemic insulin sensitivity. Science. 2006;312:1656–1659. doi: 10.1126/science.1126010. [DOI] [PubMed] [Google Scholar]
- Weng J., Li Y., Xu W., Shi L., Zhang Q., Zhu D., Hu Y., Zhou Z., Yan X., Tian H., Ran X., Luo Z., Xian J., Yan L., Li F., Zeng L., Chen Y., Yang L., Yan S., Liu J., Li M., Fu Z., Cheng H. Effect of intensive insulin therapy on beta-cell function and glycaemic control in patients with newly diagnosed type 2 diabetes: a multicentre randomised parallel-group trial. Lancet. 2008;371:1753–1760. doi: 10.1016/S0140-6736(08)60762-X. [DOI] [PubMed] [Google Scholar]
- Weyer C., Bogardus C., Mott D.M., Pratley R.E. The natural history of insulin secretory dysfunction and insulin resistance in the pathogenesis of type 2 diabetes mellitus. J. Clin. Invest. 1999;104:787–794. doi: 10.1172/JCI7231. [DOI] [PMC free article] [PubMed] [Google Scholar]
- Xue B., Kahn B.B. AMPK integrates nutrient and hormonal signals to regulate food intake and energy balance through effects in the hypothalamus and peripheral tissues. J. Physiol. 2006;574:73–83. doi: 10.1113/jphysiol.2006.113217. [DOI] [PMC free article] [PubMed] [Google Scholar]
- Yanagimachi T., Fujita Y., Takeda Y., Honjo J., Atageldiyeva K.K., Takiyama Y., Abiko A., Makino Y., Kieffer T.J., Haneda M. Pancreatic glucose-dependent insulinotropic polypeptide (GIP) (1 − 30) expression is upregulated in diabetes and PEGylated GIP(1-30) can suppress the progression of low-dose-STZ-induced hyperglycaemia in mice. Diabetologia. 2016;59:533–541. doi: 10.1007/s00125-015-3842-y. [DOI] [PubMed] [Google Scholar]
- Yasuhara D., Naruo T., Nagai N., Tanaka M., Muranaga T., Nozoe S. Insulinogenic index at 15 min as a marker of nutritional rehabilitation in anorexia nervosa. Am. J. Clin. Nutr. 2003;77:292–299. doi: 10.1093/ajcn/77.2.292. [DOI] [PubMed] [Google Scholar]
- Zhou Y.P., Priestman D.A., Randle P.J., Grill V.E. Fasting and decreased B cell sensitivity: important role for fatty acid-induced inhibition of PDH activity. Am. J. Phys. 1996;270:E988–E994. doi: 10.1152/ajpendo.1996.270.6.E988. [DOI] [PubMed] [Google Scholar]
Associated Data
This section collects any data citations, data availability statements, or supplementary materials included in this article.
Supplementary Materials
Supplementary material
Movies showing whole-body 18F-FDG-PET-CT images.
(A–C) Whole-body 18F-FDG-PET-CT images from three independent healthy human subjects at 120 min after the injection of glucose and 18F-FDG under 12-h or 3-h fasting conditions. Left and right movies in each movie file were obtained from the studies after 12-h and 3-h, respectively.